Showing posts with label ethnic minorities. Show all posts

Tuesday, April 04, 2023

Shifting Tides: Changing Dynamics of Social Capital in Georgia and Armenia

Note: This article first appeared on the Caucasus Data Blog, a joint effort of CRRC Georgia and OC Media. This article was written by By Milord Shengelia, a Junior Researcher at CRRC Georgia. The views expressed in the article are the author’s alone and do not reflect the views of CRRC Georgia or any related entity. 

Both Georgia and Armenia are known for being close-knit, but levels of social ties and trust vary both between the countries and between demographics. And while levels of trust have increased in Armenia in the last decade, in Georgia, the opposite is true.

Past research has suggested that both Georgia and Armenia have high levels of bonding social capital — levels of trust within a family and community — but low levels of bridging social capital — the ability to make bonds with people outside one’s immediate circle.

However, recent data from the Caucasus Barometer shows that while in Armenia some measures of bonding social capital have risen significantly in the decade between 2011 and 2021, the same characteristics have remained largely stagnant in Georgia.

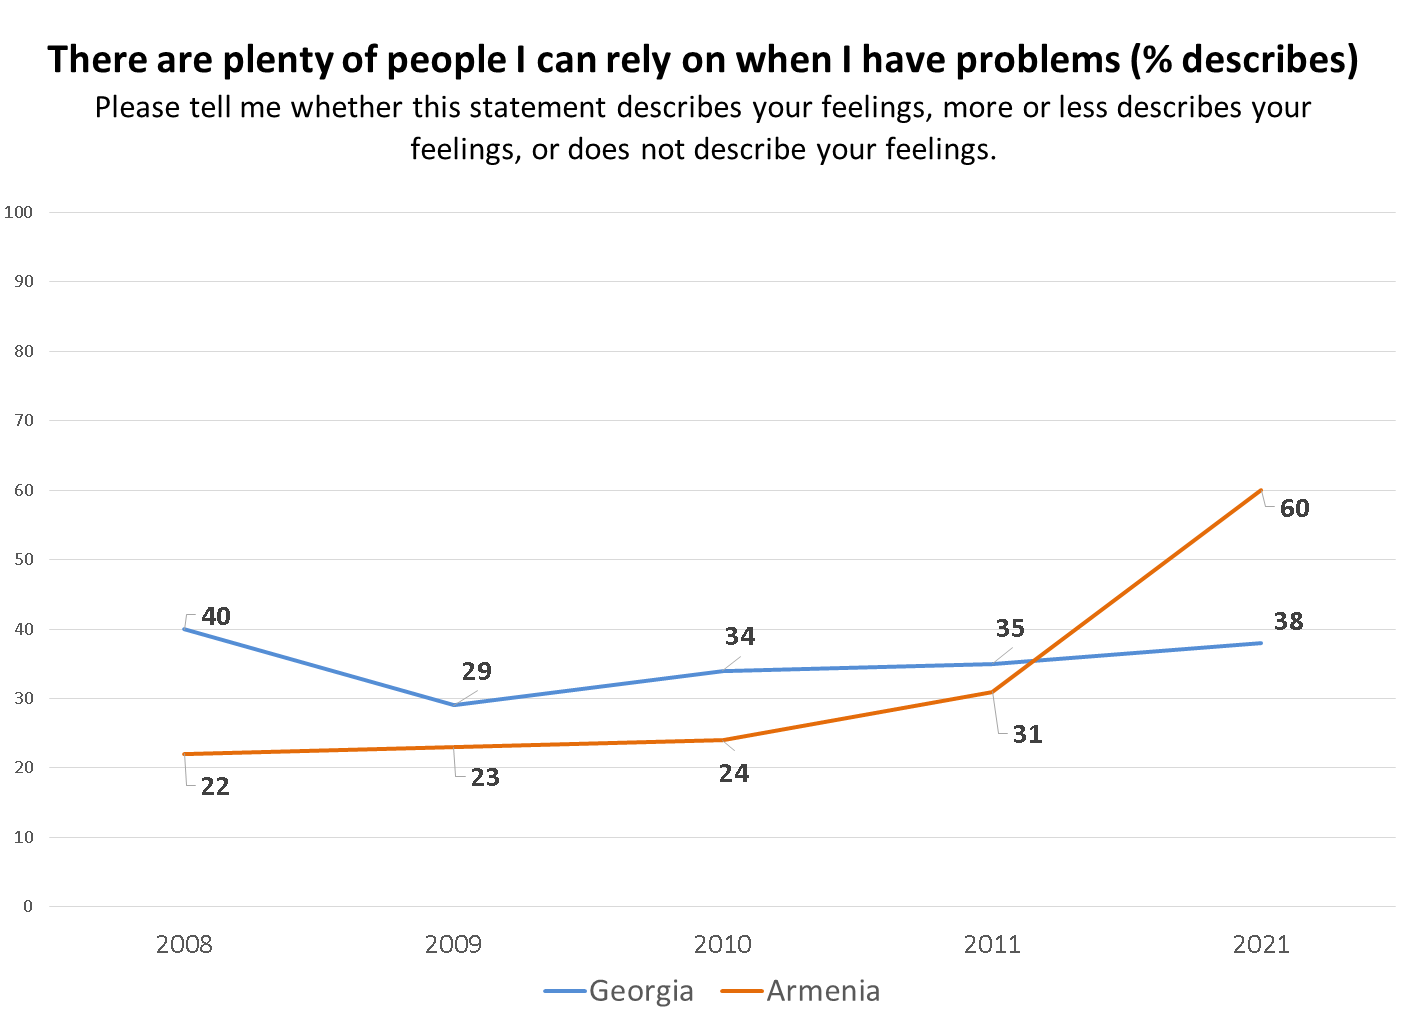
One measure of social capital is whether people feel that they have people that they can rely on when they have problems.

The share of the Georgian population who say that they have people they can rely on has varied slightly over the years, but remained between 34% and 40% between 2008 and 2021. The exception was a low of 29% in 2009, a year which is a relative outlier for Georgia.

In Armenia, however, respondents have increasingly felt that there are people that they can rely on, with this share doubling from 31% in 2011 to 60% in 2021.


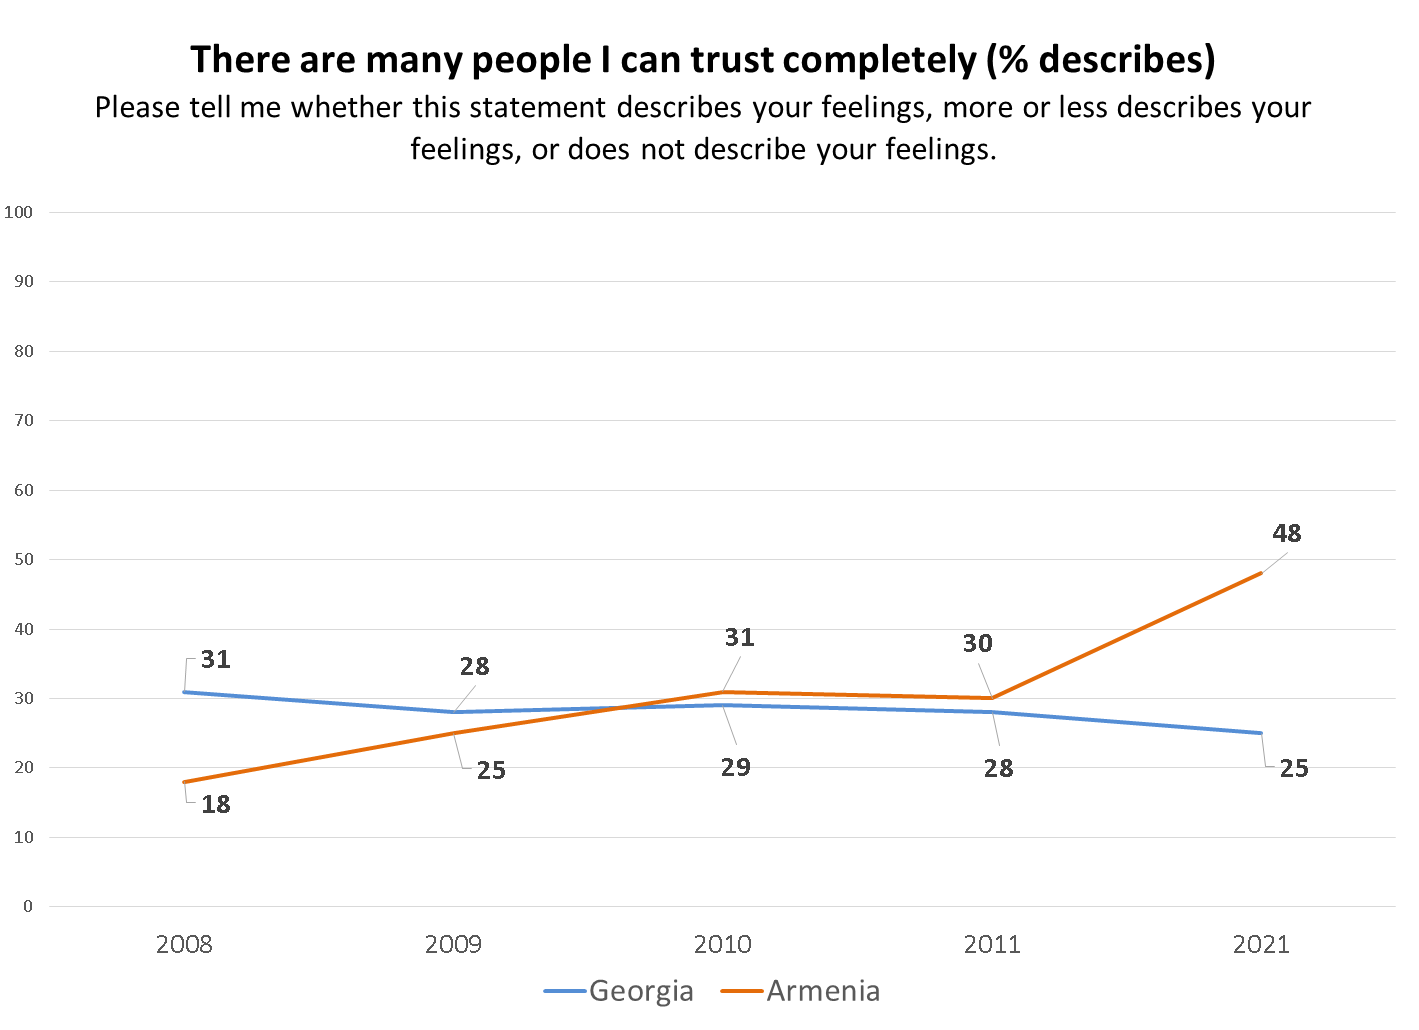
The data show a similar pattern with regard to the statement, ‘There are many people I can trust completely’.

In 2008, 31% of the Georgian public reported that this described them, compared to 18% in Armenia. Since then, however, the situation has reversed, with 25% of the public in Georgia reporting this in 2021, compared with 48% in Armenia.


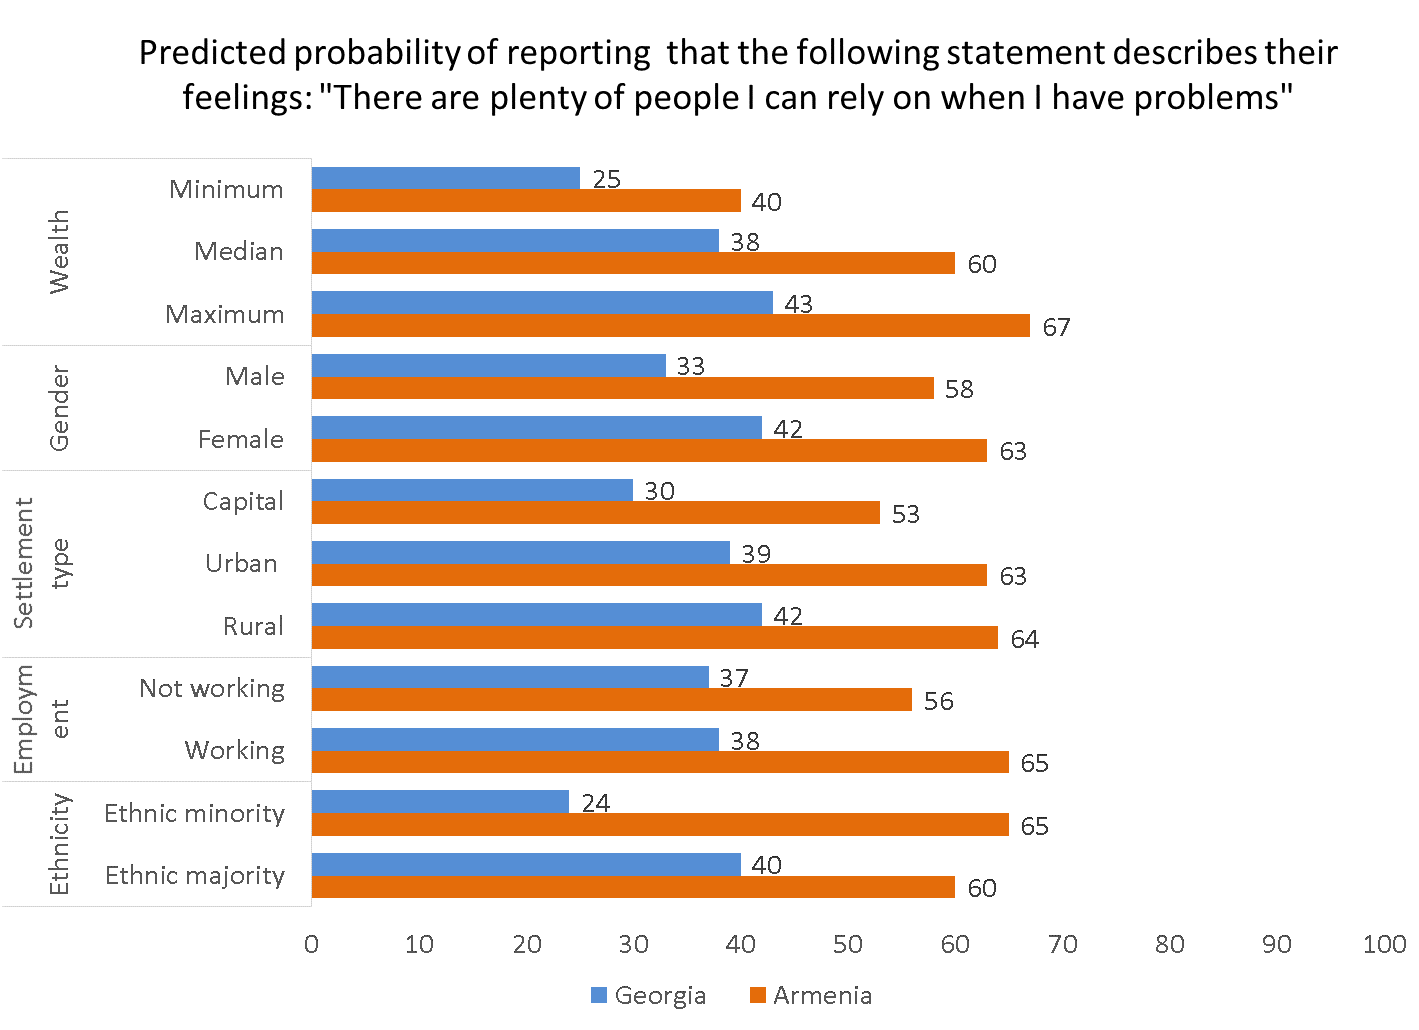
The relative levels of social capital which people report is associated with a number of demographic characteristics in Georgia and Armenia.

A regression model shows that in both Georgia and Armenia, people outside of the capital cities are more likely to say that in times of trouble, they have many individuals they can turn to than those living in Tbilisi and Yerevan. Similarly, wealthier people are more likely to believe they have people to rely on in both countries.

In Georgia, women are more likely to report they have plenty of people to turn to when faced with problems. In Armenia, gender is not associated with responses to this question.

In Georgia, ethnic Georgians were more likely to agree compared to ethnic minorities. Due to the small number of people of ethnic minority descent in Armenia, only a small number were present in the sample. Consequently, the same association was not tested in Armenia.

Employed people in Armenia, but not Georgia, are more likely to feel there are people they can rely on. Age and education are not associated with responses to this question in either country, controlling for other factors.

Regarding how much people feel they can trust others, in Georgia, this is associated with both where someone lives and their sex.

Men are more likely to say that there are many people they can trust completely compared to women, while people who live in Tbilisi are less likely to report people can be trusted, compared with people in other urban and rural areas. There were no differences associated with age, education, employment, or ethnicity on this question.

In Armenia, wealth is a significant predictor of trusting others. Wealthier respondents were more likely to indicate that there were many people they could trust completely. In Armenia, no other variable was associated with this statement.


Over the last decade, the dynamics of social capital in Armenia have undergone a transformation, while in Georgia they have remained stagnant. While Georgian people had more social capital in the past, today Armenians are more likely to have stronger bonding social capital.

Note: The results presented in the above chart came from regression model of the CB 2021 wave. The regressions included the following variables: sex (male or female), age group (18–34, 35–54, 55+), settlement type (capital, urban, rural), ethnic group (ethnic majority or ethnic minority), educational attainment (secondary or lower, secondary technical, higher than secondary), employment (working, not working), wealth (ownership of 14 different durable goods, a common proxy for wealth).

The views expressed in this article reflect the views of the author alone, and do not necessarily reflect the views of CRRC Georgia, or any related entity.

Tuesday, February 15, 2022

Georgians are becoming increasingly tolerant

Note: This article first appeared on the Caucasus Data Blog. It was written by Dustin Gilbreath, Deputy Research Director at CRRC Georgia, and Otto Saldadze, a Researcher at CRRC Georgia. The views presented within the article are the authors’ alone and do not reflect the views of CRRC Georgia, the Council of Europe, or any related entity.

Data from surveys done over several years have shown significant increases in tolerance among the Georgian population for diversity in the country, among a wide range of criteria, as well as increased recognition of the importance of minority rights.

It is easy to remember instances of hate-motivated violence in Georgia — one only has to look to last July to see a hate-motivated riot and an attempted murder of someone based on the fact that they looked, to the attacker, like they might be queer. Despite this, new data from the CRRC and Council of Europe survey on hate crime, hate speech, and discrimination in Georgia released today suggests increased levels of tolerance in Georgia compared to 2018 along a wide range of measures.

The data indicates that Georgians are increasingly appreciative of diversity in the country. Between 2018 and 2021, there was a 14 percentage point increase in the share of the public reporting that diversity, in general, is positive. Similarly, there was a 12 percentage point and 14 percentage point increase in the share of the public reporting that ethnic diversity and religious diversity, respectively, are positive.

The data also shows large increases in the share of the public that would approve of someone like them doing business with a wide range of different groups. On this measure, people had the most negative attitudes towards homosexuals and Jehovah’s Witnesses, just as they did in 2018. However, the data shows a 10 percentage point increase in the share of the public that would approve of someone like them doing business with a homosexual and a 13 percentage point rise in the share of the public who reports the same about Jehovah’s Witnesses. In total, there were 10 point or greater shifts for 11 groups asked about on the survey.

Georgians also increasingly think that protecting the rights of different minority groups is important for the country’s development. While most people thought this was the case in 2018 for most groups, there is a marked rise in the share reporting that protecting the rights of LGBT people is important. In 2018, only a third of the public thought this was important, while in 2021, roughly half of the public (47%) reported the same.

The data tends to paint a positive picture more broadly. People became more willing to recognise the problems that different minority groups face. The public reports increased recognition of a wide range of minority rights. Georgians increasingly think that hate crime and hate speech are problems in the country.

The data points towards positive attitude changes in Georgia around tolerance, despite prominent instances of hate crime as well as the everyday discrimination that different groups face in Georgia. 

The data this article is based on is available here.


Tuesday, August 31, 2021

Georgian views on increased diversity in parliament

Note: This article first appeared on the Caucasus Data Blog, a joint production of OC Media and CRRC Georgia. It was written by Dustin Gilbreath, Deputy Research Director at CRRC Georgia. The views presented in the article do not represent the views of CRRC Georgia, the Carnegie Foundation, the Levan Mikeladze Foundation, the Government of Sweden, or any related entity.

Georgia is a diverse country, with numerous languages, religions, and ethnic groups. Yet, parliament underrepresents both women and ethnic minorities relative to their total shares in the population. Moreover, there are no known LGBTQ+ parliamentarians in Georgia’s history. Data from the September 2020 Future of Georgia survey suggests that people are most positive about more women in parliament, followed by ethnic minorities and LGBT people. 

The data suggests that people are roughly three times as likely to think that there are too few female members of parliament compared with too few minority members of parliament. Very few people (6%) think there are too many female members of parliament, while roughly three times as many (15%) think that there are too many minority members of parliament. 

Similarly, substantially more people think that having more women would have a positive impact than think having more ethnic minorities would. Perhaps unsurprisingly given the homophobic riot on 5 July a large majority of Georgians (69%) think that having more LGBTQ+ people in parliament would have a negative impact, and only 4% think it would have a positive impact.

Age, sex, and education predict people’s views on whether the number of female members of parliament are adequate. Younger people (18-34) are 11-12 percentage points more likely to think that there are too few women in parliament compared to older people. People with vocational education are 8 points less likely than those with tertiary education and 12 points less likely than those with only a secondary education to report there are too few women in parliament. Women are 13 percentage points more likely to report there are too few women in parliament.

When it comes to whether having more women in parliament would be positive or negative, the data suggests that attitudes vary by age, sex, settlement type, and education type. Women are 15 percentage points more likely to think it would have a positive impact. Young people are 10 percentage points more likely to think there would be a positive impact. People in rural areas are 10 percentage points more likely to report there would be a positive impact than people in Tbilisi. People with vocational education are 7 percentage points less likely to think having more women in parliament would have a positive impact.

When it comes to the number of ethnic minorities in parliament, ethnicity and education predict people’s attitudes. While ethnic minorities have a 55% chance of thinking that there were too few ethnic minorities in parliament, ethnic Georgians only had a 13% chance. People with vocational education are slightly more likely to think that there are too many ethnic minorities in parliament, controlling for other factors.

With regard to the impact of having more ethnic minorities in parliament, the data suggests that people with vocational education are more likely to think it would have a negative impact. Ethnic minorities are significantly more likely to think it would have a positive impact.

Although relatively few people had positive views of more LGBTQ+ people being in parliament, there is some variance in attitudes. Notably, ethnic minorities are by far the least negative, controlling for other factors. People with lower levels of education also had relatively less negative attitudes as did people in Tbilisi, people under the age of 55, and non-IDPs.

The above data shows a few patterns. Women are the group that people have the most positive attitudes about in terms of representation in parliament, followed by ethnic minorities and LGBTQ+ people. Women and ethnic minorities are significantly more positive about members of their own group being represented in parliament. Ethnic minorities are also the least negative group about increased LGBTQ+ representation in parliament.

Note: The data analysis in the above is based on ordered logistic regression models controlling for respondent age group (18-34, 35-54, 55+), education level (secondary or less, vocational education, or tertiary education), sex (female or male), settlement type (capital, other urban, or rural), wealth (a simple additive index of ownership of 10 durable goods), and IDP status (IDP or not). The data used in this article are available here.

Monday, September 16, 2019

What divides and what unites Georgian society?

[Note: This article was published in partnership with OC-Media, here.]

The last year has seen a number of conversations about polarization in Georgia. The President of the European Council, Donald Tusk, even commented on the issue in his Batumi speech.  One of the components of polarization, though not the sole factor, is division in society over actors, issues, and institutions.

While many things could divide the public, what do the people think and which groups report more and fewer sources of division? The April 2019 NDI-CRRC poll suggests that there are fewer perceived reasons for division in rural areas and among ethnic minorities.

Although ethnic minorities perceive fewer divisions, they also think that different issues divide the country: minorities are more likely to think that western actors create division, while ethnic Georgians are more likely to blame Russia and domestic institutions.

One factor does unite ethnicities however: the most commonly cited source of division, no matter the respondent’s ethnicity, was politicians.

The survey asked about whether 11 issues, actors, and institutions unite or divide Georgians as a society. The results suggest that politicians are most widely viewed as divisive.  Even Russia was viewed as less of a divider than politicians in Georgia. In contrast, religion and educational institutions were considered to unite society more than any of the other issues, actors, or institutions asked about. Uncertainty (don’t know responses) was greatest about NGOs (28%) and Euro-Atlantic institutions (24% for NATO and the EU).

 To further explore perceptions of division, a simple additive index of the above questions was created to carry out further analysis, with respondents receiving one point for each item they reported divided society. On average, individuals named seven items as dividing society. One in twelve (8%) reported that none of the issues asked about divide society and one in twenty (5%) reported that all of the issues asked about divided society.


The results of a regression analysis on the above index suggests that a number of socio-demographic groups perceive more issues, actors, or institutions as divisive. Ethnic Georgians, Tbilisians, and people with higher levels of education report that more groups are dividing society, all else equal. The difference is rather small for education, with people with vocational and higher education perceiving about one half of one issue more on average.

By comparison the difference is rather sharp with ethnicity. Ethnic Armenians perceive almost two issues less on average, and ethnic Azerbaijanis note around 2.5 issues less on average. The difference between settlement types falls in between, with inhabitants of rural areas highlighting about one issue less than those in Tbilisi, and those in other urban areas falling between the capital and rural areas.


With ethnicity, there are three sources of the observed differences. First, ethnic minorities express uncertainty more often than ethnic Georgians. This is particularly true of ethnic Azerbaijanis who report don’t know more often than ethnic Armenians.

Second, among those that said each of the above issues either united or divided the country, there are differences in attitudes related to foreign policy. Ethnic Armenians and Azerbaijanis are significantly less likely to report that Russia divides the country, and significantly more likely, albeit to a smaller degree, to report that NATO divides the country. Ethnic Azerbaijanis also report the EU divides the country at a greater rate.

Third, ethnic Georgians are much more critical of domestic actors. Georgians are more likely to say that politicians, educational institutions, the Georgian media, the country’s leaders, the current economic system, law enforcement, and NGOs divide the country.

While there is a division in perceptions of what divides the country between ethnicities, one thing is common among ethnic groups: of all the issues, actors, and institutions asked about on the survey politicians are the most commonly cited source of division.

Note: The above analysis was based on an ordinary least squares regression model. The model’s dependent variables was the number of issues respondents named as divisive in the survey. The independent variables included age, sex, wealth (proxied through number of assets owned), educational attainment (secondary or less, vocational, at least some tertiary), ethnicity (Georgian, Armenian, Azerbaijani), settlement type (capital, other urban, rural), and employment status (have a job versus not having a job). The data used in the analysis is available here. Replication code for the analysis is available here.


Dustin Gilbreath is the Deputy Research Director of CRRC-Georgia. The views presented in this article do not necessarily represent the views of CRRC-Georgia. The views presented in this article do not represent the views of the National Democratic Institute or any related entity.

Monday, August 12, 2019

Georgian Language Proficiency and Perceptions of Government Performance among minorities in Georgia

Integration of ethnic minorities into Georgian society is a significant challenge. As a result of ethnic Armenians and Azerbaijanis’ linguistic separation from ethnic Georgian compatriots, some research suggests their ability to participate in government has been low. Indeed, programming aimed at minority integration in Georgia often focuses on language skills. But, the question remains, how do ethnic minorities that are proficient in Georgian perceive the government? The April 2019 CRRC and NDI data suggest that, while ethnic Armenians that speak Georgian at an advanced level have worse attitudes towards government performance in Georgia, ethnic Azerbaijanis that speak Georgian at an advanced level have better attitudes.

Ethnic Azerbaijanis and Armenians generally have positive perceptions of the current government. Almost two thirds (62%) of ethnic Azerbaijani’s and about half (51%) of ethnic Armenians rate the current government as having performed well or very well. By comparison, Georgians rate government performance more negatively.


Further analysis, however, suggests that ethnic Armenian’s perceptions of the government are more negative if they report they have an advanced proficiency in Georgian. In contrast, ethnic Azerbaijani’s perceptions of government are more positive when they report knowing Georgian at more advanced levels.


Knowledge of Georgian language among ethnic minorities is associated with perceptions of government performance. However, for Armenians knowledge is associated with more negative attitudes, while for Azerbaijanis it is associated with more positive attitudes.

Note: The above analysis is based on an ordered logistic regression analysis, where the dependent variable is the respondent's perceptions of the current government's performance. The independent variables are knowledge of Georgian interacted with ethnicity and sex, age group, education, , household size, employment status, settlement type, and household economic status. Replication code for the above analysis can be found here

Monday, January 28, 2019

Georgians have more negative attitudes towards the Chinese than other foreigners in Georgia

Georgia is often famed for its hospitality. While the country is more tolerant of other ethnicities, relative to Armenia and Azerbaijan, it has also experienced a rise in nationalist rhetoric and movements in recent years. A number of incidents have also taken place, with hate crime directed towards immigrants and religious and ethnic minorities. This blog post looks at attitudes towards different migrant groups based on a survey experiment in the Caucasus Barometer 2017 survey.
On CB 2017, respondents were randomly assigned to be asked one of five questions. The basic text read, “In your opinion, will the foreigners that come to live in Georgia contribute to the economic development of Georgia or not?” In the other four questions, respondents were asked about Russians, Americans and Europeans, Chinese, and Turkish people instead of foreigners. Since each group was randomly assigned, it is possible to look at whether attitudes to any of these groups differ from foreigners in general without base lining effects (i.e. the respondent reporting their attitudes towards one group based on a comparison with the previous groups they were asked about).
Only 11% of Georgians think that the Chinese people who come to live in Georgia will contribute to the country’s economic development and 40% think they will not. In contrast, 23% think “Foreigners” without their nationality specified will contribute and 26% that they won’t. People are also relatively more negative towards Turkish people, with 32% reporting a negative attitude.

The above results suggest a relatively lower level of tolerance for Chinese and Turkish migrants relative to people from Russia and “Americans and Europeans.” The importance of tolerance aside, this matters for Georgia’s economic development. Turkey and China are important trade partners for the country, with Turkey consistently being one of the largest sources of foreign direct investment in Georgia. Looking to the future, Georgia is likely to have more economic relations with China due to its strategic position along China’s New Silk Road project. A lack of tolerance towards these groups, if anything, will work against improving economic relations.
While the pattern is clear, the sources for the particularly negative attitudes towards Chinese people is less so. Have a hunch on the cause(s)? Join the conversation on our Facebook or Twitter pages. The data used in this post is available from CRRC’s Online Data Analysis portal.

Tuesday, April 10, 2018

People in Georgia approve of doing business with Russians, despite interstate hostility

In the 2017 wave of CRRC’s Caucasus Barometer survey, 40% of the population of Georgia named Russia as the main enemy of the country.  Turkey and the United States garnered the second highest share of responses with 3% each.  Yet, no particular animosity towards ethnic Russians is observed in answers to a question about people’s (dis)approval of individuals of their ethnicity doing business with Russians. This blog post examines how answers differ by people’s opinions about whether or not Russia is the main enemy of Georgia. 

Seventy-seven percent of the population of Georgia report approving of people of their ethnicity doing business with a Russian, which is one of the highest approval rates of the 14 ethnic groups asked about in the survey.  It is important to note, though, that answers to this question are subject to ‘social desirability bias,’ which is the “tendency of some respondents to report an answer in a way they deem to be more socially acceptable than would be their ‘true’ answer.


Only a slightly greater share of people who named Russia as the main enemy of Georgia report disapproving of their co-nationals doing business with a Russian, compared to those who did not name Russia as Georgia’s main enemy. These findings suggest a rather tolerant attitude towards ethnic Russians in Georgia, amidst a sizeable backdrop of opinions that identify Russia as the main enemy of Georgia. They also suggest that people in Georgia distinguish between attitudes towards “Russia” as a state and “Russians” as a people.  


Note: The question, “In your opinion, which country is currently the main enemy of Georgia?” was open-ended. For this chart, the countries other than “Russia” were combined into category “Not Russia.”

Given the antagonistic relationship between the political elites of Georgia and Russia, the evidence that interstate hostility does not necessarily equate to negative attitudes on a micro-level is important.

To explore the data used in this blog post further, visit our Online Data Analysis platform

Thursday, December 08, 2016

Georgians and other ethnic groups: understanding (in)tolerance (Part 3)


As the first blog post in this series highlighted, approval by Georgians for doing business with members of other ethnic groups is, overall, declining. When it comes to Georgian women marrying men of other ethnicities, Georgians are even less approving. These latter attitudes vary by settlement type, age, and level of education. As in the previous blog posts in this series, only the answers of ethnic Georgians are presented in this blog post.

Georgians living in the capital report the highest approval of Georgian women marrying men of other ethnicities. On average, there is a 14 percentage point difference between the population of the capital and rural settlements. The biggest gap is with Americans (19%): 54% of Georgians in Tbilisi approve of Georgian women marrying Americans, while only 35% of the rural population say the same. The gap is smallest with Russians: 55% in the capital and 45% in rural settlements approve of Georgian women marrying Russians.


Note: Only shares of those answering “Approve” are presented on the charts in this blog post. 

Differences between the answers of people of different ages are also noteworthy, though the gaps are smaller. Overall, younger people show greater approval of Georgian women marrying foreigners. The biggest gap is observed in respect to marrying Americans (14%): while 50% of young people 18 to 35 approve of Georgian women marrying Americans, only 36% of older people (56+) say the same.


Differences by education level are also informative. The higher a person’s level of education, the more s/he tends to approve of Georgian women marrying men of other ethnicities. On average, there is a ten percentage point gap between people with secondary or lower education and those with tertiary education. As with settlement types and age groups, the largest gap is observed in relation to Americans. Only 37% of people with secondary or lower education approve of Georgian women marrying Americans, while 51% of people with tertiary education report the same.


Approval by Georgians of Georgian women marrying men of other ethnicities varies by settlement type, education, and, to a lesser extent, by age. Interestingly, the gaps between the groups are consistently greatest when it comes to (dis)approval of Georgian women marrying Americans.

To take a deeper look at the data used in this blog post, try out our online data analysis tool.

Monday, December 05, 2016

Georgians and other ethnic groups: understanding (in)tolerance (Part 2)

In the previous blog post, we saw that Georgians report approval of doing business with representatives of other ethnic groups less than in the past. Based on CRRC’s 2015 Caucasus Barometer data, this blog post looks at how (dis)approval differs for Georgians of different ages, and living in different settlement types. 

People living in rural settlements report disapproval of business relations with representatives of the other ethnic groups asked about more often than residents of the capital and other urban settlements. On average, 56% of rural residents report approval of doing business with the 11 other ethnicities asked about over time, while the average for Tbilisi residents is 78%. 


Note: Only the answers of those answering “Approve” are shown on the charts in this blog post. 

The highest reported levels of approval of doing business with foreigners in rural settlements was with Russians and Ukrainians, both at 69%. By comparison, in the capital, 83% and 89% approved of doing business with Russians and Ukrainians, respectively. The largest differences between the attitudes of the population of rural settlements and the capital are when it comes to Jews and Kurds/Yezidis, with approximately 30 percentage point gaps. 

Differences in the attitudes by age are also noteworthy, though the gaps are not as large as in the case of settlement types. On average, there is a 10 percentage point difference between the youngest (18-35) and the oldest group (56+). Georgians who are 56 and older show less approval of doing business with non-Georgians asked about, with the largest difference in the case of Americans: 79% of 18 to 35 year olds approve of doing business with them, while only 61% of people older than 56 say the same. The gap is almost the same in the case of Ukrainians. 


Young Georgians and those living in the capital and other urban settlements approve of doing business with people of other ethnicities more than older Georgians and those living in rural settlements. In the next blog post in this series, we present findings on who approves of Georgian women marrying men of other ethnicities. 

Explore more about attitudes towards non-Georgians in Georgia here.

Monday, November 28, 2016

Georgians and other ethnic groups: understanding (in)tolerance (Part 1)

Overall, the population of Georgia reports supporting inter-ethnic business relations. Yet, CRRC’s Caucasus Barometer (CB) longitudinal data show this support is declining. In 2015, Georgians were less likely to report approval of doing business with representatives of all ethnicities asked about than they were in 2009. Interestingly, only (dis)approval of doing business with Russians did not change. These trends are presented in this blog post.

While there is a general downward trend in approval of doing business with non-Georgians between 2009 and 2015, the largest drops were observed between 2009 and 2010 and then between 2013 and 2015. In 2015, the highest level of approval was for doing business with Russians (76%, discussed below separately) and Americans (72%). The lowest reported level of approval was for doing business with Kurds (55%). The relative positions of different ethnicities have been largely stable over time.


Note: Only the shares of ethnic Georgians answering “Approve” are shown on this chart. CB was not conducted in 2014.

CB survey results show that Georgians’ support for doing business with other Caucasians is also declining. In 2015, the highest reported level of approval of doing business with other Caucasian groups was with Abkhazians (69%), while the lowest was with Armenians (60%). Both of these levels of approval are much lower than in 2009. The biggest drops between 2009 and 2015 are in approval of doing business with Azerbaijanis and Armenians, which declined by 15 and 17 percentage points, respectively.


Note: Only the shares of ethnic Georgians answering “Approve” are shown in this chart. CB was not conducted in 2014. 

At the same time, clearly stated disapproval of doing business with all the above ethnicities is increasing. In other words, an active substitution of disapproval for approval is observed.

Of the ethnicities CB asked about, only (dis)approval of doing business with Russians has been steady between 2009 and 2015, exhibiting only minor fluctuations.


The decrease in approval and increase in disapproval of Georgians doing business with other ethnicities over the past six years is considerable. Except Russians, approval of doing business with even the most liked ethnicities CB asked about is declining. In addition, data measuring (dis)approval of doing business with Greeks, Italians, and Iranians, which only exists for some years, also shows a decline in approval over time. Importantly, the rates of approval for doing business with non-Georgians are already systematically higher than rates of approval for Georgian women marrying non-Georgians.

Explore more about attitudes towards non-Georgians in Georgia here.

Georgians and other ethnic groups: understanding (in)tolerance

From the events of May 17th, 2013 when Orthodox priests and their supporters attacked demonstrators at an International Day Against Homophobia rally, to more recently when “sausage-wielding nationalists” attacked a vegan café in Tbilisi, various forms of intolerance have put Georgia into headlines internationally in recent years.

The coming posts on Social Science in the Caucasus will use CRRC’s Caucasus Barometer data (CB) to explore indicators of ethnic (in)tolerance in Georgia. Specifically, we use two questions:

  • Can you please tell me whether you approve or disapprove of people of your ethnicity doing business with an [ethnic group]?
  • Would you approve or disapprove of women of your ethnicity marrying an [ethnic group]?

The blog posts in this series only report the answers of ethnic Georgians.

The data reveals a number of interesting trends and patterns. Today’s post looks at which ethnicities Georgians approve of doing business with and how (dis)approval has changed over time. Diving further into this issue, the second post looks at how (dis)approval of doing business with other ethnicities differs by age and settlement type. The third post mirrors the second, looking at (dis)approval of Georgian women marrying non-Georgians by age, settlement type, and education level.

Part 1 of this series is available here.
Part 2 of this series is available here.
Part 3 of this series is available here.

Monday, November 21, 2016

Georgian parliamentary elections 2016 - Gender and ethnic minority representation on party lists

[This post was co-published with our partner, civil.ge]

The results of the 2016 Parliamentary elections in Georgia reveal some interesting patterns about the representation of women and ethnic minorities in Georgian politics. In the run-up to the election, lawmakers considered instituting gender quotas to come closer to the United Nations’ target of 30% of seats in parliament filled by women. Civil society organizations also lamented low ethnic minority participation in elections in Georgia. In this election cycle, women won 24 out of 150 seats (16.0%) in the upcoming parliament, and ethnic minority candidates won 11 seats (7.3%). While these figures still fall well short of international recommendations, Georgia’s next parliament will have the highest share of women and ethnic minorities that it ever has.

However, substantial roadblocks to the inclusion of women and ethnic minorities in electoral politics still exist. After the 2012 elections, the European Center for Minority Issues assessed party list composition as one of the major factors preventing women and representatives of ethnic minorities from being represented fairly in the parliament of Georgia. The infographic below shows the top six vote-getting parties in the 2016 election, ranked by shares of women and representatives of ethnic minorities on their party lists.


Not surprisingly, in the two parties that are led by women (Nino Burjanadze - Democratic Movement and the Alliance of Patriots of Georgia, chaired by Irma Inashvili), women tend to be better represented throughout the entire list, in spite of the fact that these two parties are generally seen as conservative by international observers. Importantly, the party that won a constitutional majority, the Georgian Dream (GD), had the lowest share of women on its party list (11.6%) of the top six parties. However, female candidates’ average number on the GD party list was 14 positions higher than that of male candidates (respectively, 65.7 and 79.7).

In terms of ethnic minorities, the upcoming parliament will include representatives of several ethnic groups, including Armenians, Azerbaijanis, Ossetians, Abkhaz, and Yezidis. Of the top six parties, the United National Movement (UNM) had the most ethnic minorities on its list, including Samira Ismailova, the first Azerbaijani female majoritarian candidate in Georgia’s history. Election results show that GD and UNM are still dominant in districts heavily populated by ethnic minorities, although a few other parties have made efforts to include similar or even greater shares of ethnic minority candidates on their party lists.

To explore this subject further, take a look at our Online Data Analysis platform, which has a number of surveys which asked about attitudes towards ethnic minority and gender representation in parliament. Also, take a look at CRRC blog posts on the representation of women in Georgia’s parliament compared to Armenia and Azerbaijan and public opinion about women in parliament in Georgia.

Friday, November 27, 2015

Awareness of the EU-Georgia Association Agreement in Georgia, one year on


The June 27, 2014 initialing of the EU-Georgia Association Agreement, a wide reaching, largely economic treaty, was marked with celebration in Tbilisi as the fruit of a long running diplomatic effort to tighten ties with the European Union over the course of three Georgian administrations. To date, 27 EU member states have ratified the Agreement. The EU has become a more important market for Georgian goods since the signing of the Agreement, with the share of total exports to the EU increasing from 21% in the first eight months of 2014 to 28% in the same months of 2015, according to Geostat data. Using the findings of the 2015 Knowledge and Attitudes towards the EU survey carried out by CRRC-Georgia for Eurasia Partnership Foundation, this post looks at public perceptions of the EU-Georgia Association Agreement one year on and, specifically, examines whether Georgia’s ethnic minority population’s awareness of the Agreement has increased since 2013, when a previous wave of the same survey was conducted. 

While in 2013, before the initialing of the Association Agreement, 19% of the population of Georgia reported having heard of the Agreement, today 63% report so. It should be noted, however, that this impressive increase is a measure of reported awareness and does not necessarily reflect the accuracy of information people have about the document. 

Characteristics of those aware of the Agreement fall along the lines to be expected. While half of those with secondary or lower education report having heard of the Agreement, the same is true for three quarters of those with tertiary education. People aged 36 to 55 years old are slightly more likely to report knowing about the Agreement. Interestingly, according to findings of other surveys, representatives of this age group tend to be the most informed about other issues as well, such as, NGOs. Representatives of the youngest and oldest age groups are equally aware of the Agreement (60% and 58%, respectively, report having heard of it). Finally, as is commonly found with other knowledge questions in Georgia, residents of the capital are most informed, with three quarters reporting awareness of the Agreement compared with slightly over half of the residents of other urban and rural settlements. Interestingly, men report having heard of the Association Agreement slightly more frequently than women (67% compared with 58%).


Considering that the previous, 2013 wave of the EU survey found a considerable discrepancy between awareness of the Association Agreement between Georgian speakers and ethnic minority populations, it is important to take a look at this issue in 2015. While reported awareness of the Association Agreement increased by roughly five times between 2013 and 2015 among the non-Georgian speaking, ethnic minority population (from 6% to 26%), this is still half the level of awareness of the Agreement that Georgian speakers report. 


Importantly, the non-Georgian speaking ethnic minority population who have not heard about the Association Agreement are more willing to get more information about the EU than are Georgian speakers who have not heard of the agreement. 


*Note: Only the answers of those who reported that they had not heard of the Agreement, responded that they did not know whether they had heard of the Agreement or refused to answer the question about the Association Agreement are presented in the chart above (74% of ethnic minorities and 34% of ethnic Georgians).

While the majority of the population of Georgia has heard of the Association Agreement with the European Union, slightly over a third of the population is still unaware of its existence. Lack of awareness is particularly acute among representatives of ethnic minorities, but considering that many of those who are unaware of the Agreement are interested in finding out more about the EU, both the Government of Georgia and the European Union could consider public information campaigns on the Association Agreement. As in the past, this is particularly important in ethnic minority settlements where knowledge of the EU and EU-Georgia Association Agreement is much lower than in the rest of Georgia.

To look into the subject more, take a look at the data using the CRRC’s Online Data Analysis tool, here.

Monday, May 25, 2015

Perceived (in)equality in the courts in Georgia - the poor in trouble


The judiciary is essential to the functioning of a state. Hence, not only is its good performance important, but so are perceptions of the courts’ impartiality. In 2011 and 2014, CRRC-Georgia conducted two nationally representative public opinion polls funded by East-West Management Institute and the United States Agency for International Development. The surveys explored Georgians’ knowledge, trust and perceptions of the judiciary. Survey findings suggest that the situation has not changed much during this period, although there was a slight increase in the share of the population who reports completely agreeing that, in Georgia, everyone is equal before the law – from 34% in 2011 to 43% in 2014. Nevertheless, there are still representatives of certain social groups that people do not expect the courts will treat impartially.


During the survey interviews, a number of scenarios were offered to the respondents about representatives of various groups who were hypothetically charged with the same crime they did not commit. The respondents were asked who, in their opinion, would be more likely to be found guilty – rich or poor; Georgian or non-Georgian; Orthodox or non-Orthodox; heterosexual or a representative of a sexual minority.

While over 60% of the population claims in 2014 that Georgians and non-Georgians, Orthodox and non-Orthodox, heterosexuals and a representative of a sexual minority have the same chance of being found guilty or innocent when charged with an identical crime they did not commit, the population thinks that being rich or poor does make a difference – 43% answer that a poor person is more likely to be found guilty. Importantly, though, the most frequent answer reported by 49% in 2014 is that both a rich person and a poor person have the same chance of being found guilty or not guilty. Interestingly, 52% of the residents of the capital report a poor person is more likely to be found guilty, while only 40% think a rich person and a poor person will have the same chance in court. This suggests that the population in Tbilisi is less likely to perceive courts as impartial compared with the population in the rest of the country.

Note:  Don’t know and refuse to answer responses are not displayed on the chart.

Thus, although from 2011 to 2014 there was a slight increase in the perception that in Georgia everyone is equal before the law, almost half of the population still does not expect the courts will treat the rich and the poor equally.

For more information about the surveys on the judiciary, please take a look at the data here. A report comparing the results of the two waves can be found here.

Friday, May 01, 2015

Ethnic minorities, Georgians, and foreign policy orientation


Georgia’s prominent West-ward political orientation has been demonstrated numerous times, especially in the period following the 2004 Rose Revolution. The signing of the Association Agreement with the European Union in 2014 emphasized once more the country’s willingness for closer cooperation with the EU. Georgia’s choice of strategic partners is stark when looking at the country’s neighborhood, with Azerbaijan moving one step forward and one backward in regard to partnership with the EU, Armenia flirting with both the European Union and the Eurasian Economic Union, and Turkey a “forever-candidate” of the EU. Importantly, Russia considers Georgia’s EU and, especially, NATO aspirations a threat to its national security.

While Georgia’s closer ties with the EU represent the views and beliefs of a large majority of Georgian citizens, support for the Euro-Atlantic path is notably weaker among the country’s ethnic minority citizens than among the ethnic Georgian population. Hence, it is important to look at the micro dynamics of attitudes and perceptions within the population of Georgia and explore whether ethnic minorities in the country share the same attitudes as the ethnic majority population. CRRC-Georgia’s 2013 survey Knowledge and attitudes toward the EU in Georgia, funded by the Eurasia Partnership Foundation, offers the opportunity to engage in such an endeavor. Ten percent of all survey respondents were sampled from ethnic Azerbaijanis living in the Kvemo Kartli region and ethnic Armenians in the Samtskhe-Javakheti region, and the data is representative of the opinions and attitudes of ethnic minorities. Notably, minorities in ‘ethnic enclaves’ are often different from ethnic Armenians and Azerbaijanis that live in other parts of Georgia and, in some ways, are better integrated into Georgian society. Throughout this blog post, we refer to the subsample of Armenians and Azerbaijanis in the noted ‘ethnic enclaves’ as “minorities,” and to the rest of the sample as “Georgians”.

While 83% of Georgians would vote for Georgia’s EU membership and 74% would vote for Georgia’s NATO membership if a referendum was to be held the day after the survey interview in 2013, only 38% and 31%, respectively of minorities would do the same. Notably, minorities’ non-response rate for these two questions was also much higher compared to Georgians. Thus, minorities are visibly less inclined to support Georgia’s membership in either the EU or NATO.


Opinions on potential allies that can best support Georgia are also different, with most Georgians (38%) choosing the EU, while most minorities (57%) choose Russia. Smaller, but almost equal shares of Georgians think that the USA and Russia (18% and 17%, respectively) can best support the country, and smaller shares of minorities (17% and 14%, respectively) think that the United States and the EU would be best. If choices of the EU and USA are jointly considered as an orientation towards the West, then 56% of Georgians see the West as the best supporter of Georgia, while the same share of minorities (57%) would see Russia in this role.


Minorities differ from Georgians in other respects as well. Asked about the three most important issues currently facing Georgia, the most visible differences in the opinions of Georgians and minorities regard relations with Russia and Georgia’s territorial integrity. While most citizens of Georgia, no matter their ethnicity, name employment (“jobs”) as the most pressing issue (indicated by 63% of the population), their opinions about the importance of other issues differ – the second most frequently mentioned issue for minorities is relations with Russia (indicated by 56% of minorities), while for Georgians it is territorial integrity (indicated by 39% of Georgians).


This blog post compared the views of ethnic minority populations living in the Kvemo Kartli and Samtskhe-Javakheti regions of Georgia with the rest of the population in the country. Georgians and minorities have different views especially when it comes to Georgia’s membership in the EU and NATO, international actors that can currently best support Georgia, and partially in relation to the most pressing issues the country currently faces.

How do you think these differences in points of views are manifested or reflected in Georgia’s foreign or domestic policy choices? Join the conversation on the CRRC Georgia Facebook page or in the comments section below.

Monday, February 23, 2015

Tracing regional inequalities in the Georgian education system (Part 1)


It has been almost ten years since United National Exams (UNE) for university admissions were introduced in Georgia, and the introduction of UNE has been named by the World Bank as one of the most successful reforms implemented since the Rose Revolution. Previously, university admissions were directly administered by the higher educational institutions, and entrance exams were often the site of highly corrupt practices. UNE ultimately led to the complete elimination of corruption and nepotism from the admissions process.

Corruption aside, fair and exclusively merit-based UNE were expected to give a better chance to applicants from outside Tbilisi, including representatives of ethnic minorities, to enroll in the best educational institutions in Georgia. Some, largely unsystematic evidence, however, suggests that this expectation has not been met. While at present, we do not possess longitudinal data which would enable us to draw comparisons between the situation before and after the reform, we do have data to look at how admitted applicants from different regions of Georgia performed on the 2014 exams. The publicly available 2014 UNE database contains scores for all exam takers (about 26,000 individuals) along with basic demographic data about them, such as date of birth, gender, and municipality where the applicant was registered at the time of exam. It should be noted that the applicants’ place of registration does not necessarily accurately reflect their actual place of residence in Georgia, since no one is obliged by law to live in their place of registration. This is especially true for IDPs, who despite being registered in Abkhazia or South Ossetia, in fact generally reside in areas controlled by Georgia, mainly in Tbilisi (40% of the whole IDP population) and Samegrelo-Zemo Svaneti (32%). However, registration data still makes sense as many people in Georgia, especially the youth graduating secondary schools, generally live in their place of registration.

The map below displays the distribution of UNE scores by applicants’ municipality in 2014. The municipalities on the map below have been assigned a color based on the standard deviation of the applicants’ mean scores. Standard deviation indicates how distant a particular data point, an exam score in this instance, is from the mean. It also “quantifies the amount of variation or dispersion of a set of data values.”  On the map, negative standard deviations indicate values less than the national mean, while positive ones indicate values above the national mean.
  

Looking at the regional distribution of mean exam scores on the map above, a number of patterns can be observed. High and low scores are concentrated territorially and form distinct geographic patterns. Applicants from the capital and large urban areas (Kutaisi, Batumi, Rustavi, Poti) on average have received the highest scores. Another area of concentration of high scores can be observed in Kakheti. The performance of representatives of municipalities from the central-western parts of Georgia was slightly worse (Racha-Lechkhumi, eastern municipalities of Imereti, as well as Khashuri and Gori). Interestingly enough, IDP contestants’ results are also quite high, especially those registered in Sukhumi municipality.

Municipalities with predominantly non-ethnic Georgian populations have the lowest mean exam scores in the country. Applicants from Marneuli, Bolnisi, Akhalkalaki, Ninotsminda and Tsalka municipalities performed the worst on average during the last UNE. Upper Adjara and Svaneti are two other areas with concentrations of low scores.

UNE scores portray a larger problem with the education system in Georgia – regional inequality of access to quality education. Applicants coming from regions and especially ethnic minority applicants are less likely to score high on exams even though they provide everyone with an equal chance. Moreover, provided that advanced knowledge of the state language – Georgian –was necessary to pass the exams, to a certain extent, the UNE discriminated against ethnic minority exam takers, especially those from Samtskhe-Javakheti and Kvemo Kartli, who are often not fluent in Georgian.

Despite the fact that the National Assessment and Examinations Center (NAEC) quickly acknowledged this latter problem and, starting from 2010, offered exams in minorities’ native languages (Armenian, Azerbaijani and Russian), as it is clear from the map above,  the disparity between predominantly Georgian-speaking and ethnic minority municipalities remains. 

This blog post described regional disparities in terms of UNE exam scores in Georgia. In the next blog post, we will investigate whether gender and settlement type impact UNE scores. Despite the above explanations for regional disparities not being exhaustive, they give some food for thought and discussion. Have other insights? Join the conversation on our Facebook page or in the comments section below.

Monday, September 08, 2014

Is xenophobia on the rise in Georgia?


On September 1, 2014 new rules and regulations came into force for foreigners interested in visiting Georgia. Under the previous visa regime, citizens of 118 countries could stay in Georgia without a visa. Many with visa free travel privileges could receive a visa stamp at the airport that would be valid for 360 days, and simply renew their visa by crossing an international border and returning to Georgia. Even nationals of many countries not covered by this visa free travel regime could receive a visa upon arrival in Georgia. This was a liberal visa regime. Under the new visa regime, a shorter list of foreign nationals will be allowed to visit Georgia for 90 days (within a 180-day period), and can receive a visa stamp upon arrival. The new policy intends to bring Georgia in line with EU policy, and it was prescribed by the EU to allow easier access for Georgians to enter the Schengen Zone under the EU-Georgia visa liberalization action plan (VLAP).

Despite the fact that the policy brings Georgia in line with EU legislation, some have questioned the logic of the law. Specifically, many consider the law to be xenophobic and punitive, as Gavin Slade has argued. This change was likely made so that Georgia would not be an entry point for illegal migration to Europe via Turkey. With all of this in mind, readers may be interested in whether xenophobia is on the rise in Georgia. This post looks at the level of approval of foreigners marrying Georgian women, and at the level of approval of Georgian citizens doing business with other ethnicities between 2009 and 2013 (as a proxy for xenophobic attitudes in Georgia).  

If xenophobia were on the rise in Georgia, one would expect an increasing level of disapproval of doing business with foreigners or Georgian women marrying other ethnicities.  Yet, data from the Caucasus Barometer (CB) shows that xenophobia is not on the rise; approval rates for both interethnic marriage (27% on average) and for doing business with different ethnicities (77% on average) have not changed drastically from 2009 to 2013.


Note: Only ethnic groups that were consistently present in the CB from 2009 to 2013 were included in the average calculation. These include Turks, Russians, Armenians, Azerbaijanis, Kurds/Yezidis, Abkhazians, Ossetians, Americans, and Jews. This group is referred to as a ‘collection of ethnicities’. During the CB survey, respondents were asked “Would you approve or disapprove of people of your ethnicity doing business with,” and “Would you approve or disapprove of women of your ethnicity marrying,” followed by a list of ethnicities. Respondents were able to respond ‘approve’ or ‘disapprove’. Approve was coded as 1 and disapprove was coded as 0. In the graph above, averages of respondents’ answers to each ethnicity below or equal to 0.50 were coded as disapprove, and averages greater than 0.50 were coded as approve. The same method was used to calculate averages below. 

Although the above graph suggests that there has not been a pronounced increase in anti-foreign feelings in the last five years, some ethnicities are appraised as more favorable for marriage and business than other ethnicities. Generally, Russians, Americans, and Europeans of different ethnicities are viewed more favorably, and Yezidis/Kurds, Chinese, Iranians, Indians, and Turks are generally perceived as less favorable for marriage and business. The graph below shows views for marriage regarding these and other groups in 2013.
The figure also shows that marriages to ethnicities which tend to be Christian receive higher approval rates than to those generally associated with Islam and other non-Christian religions. The figure below gives averages of approval ratings for marriage and doing business with ethnicities that tend to be Christian, and with those that tend to be non-Christian from 2009 to 2013. The figure shows that Georgians have consistently approved of marriage (by 15 to 20 percentage points) with foreign ethnicities that tend to be Christian, than to those that tend to be non-Christian. It also shows that Georgians have been between 5 and 12 percentage points more likely to approve of business with foreign Christians as opposed to foreign non-Christians. Both trends have been stable over time.
Note: The category Christian in the above graph consists of Russians, Americans, Armenians, Ossetians, and Abkhazians. The non-Christian category consists of Jews, Turks, Yezidis/Kurds, and Azerbaijanis. Only ethnic groups that were consistently present in the CB from 2009 to 2013 were included in the average calculation. Calculations were made as described below the first graph in this blog post.

This blog post has shown that the average level of approval of doing business with foreigners, and Georgian women marrying foreigners, has not changed much in the past four years. The blog has also shown that differences in approval rates between specific ethnicities appear to be related to religion. Georgians are more likely to approve of marriage and business relations with ethnicities that tend to be Christian. Importantly, these levels have been quite consistent from 2009 to 2013 which suggests that, with respect to these specific factors, xenophobic attitudes are not on the rise in Georgia.

To explore issues related to marriage and business relations in Georgia, take a look at this blog post on Georgian nationalism, or examine the data directly with CRRC’s Online Data Analysis tool.