Showing posts with label Data. Show all posts

Tuesday, March 29, 2022

Caucasus Barometer 2021: Changing attitudes amid the pandemic

Today, CRRC Georgia released the most recent wave of the Caucasus Barometer survey, which was conducted between December 2021 and January 2022. The results of the survey shed light on a wide range of changes in the public’s attitudes toward domestic and foreign policy, attitudes towards the media and information security, the COVID-19 pandemic,  and various socio-economic issues.

Dr. David Sichinava, CRRC Georgia’s Research Director, and Nino Mzhavanadze, a Researcher at CRRC Georgia, presented the findings of the new wave of Caucasus Barometer. 

A recording of the presentation is available below:


The 2021 Caucasus Barometer survey was the eleventh wave of the survey to be made publicly available. It included 1540 respondents, and had a response rate of 23%. The survey’s margin of error is 2.27%. The survey was conducted using computer assisted personal interviewing. 

The 2021 wave of Caucasus Barometer is available for download here and to explore here.


Monday, February 03, 2020

Caucasus Barometer 2019 Georgia Now Available

On January 30th, 2020, CRRC Georgia released the 2019 wave of Caucasus Barometer (CB) data for Georgia. CB is the longest running, publicly available household survey which enables longitudinal and comparative analysis of Armenia, Azerbaijan, and Georgia between 2008 and 2013, and for Armenia and Georgia for 2008-2019.

CB 2019 is the 9th wave of publicly available survey data in Georgia. The survey included 2,317 respondents and has a maximum margin of error of 4.1%. The results are representative of Georgia as a whole as well as of Tbilisi, other urban areas, and rural areas independently.

Both data and documentation for the survey are available from CRRC Georgia’s online data analysis tool: caucasusbarometer.org. The data has also been uploaded into the tool to enable analysis of the new wave of survey data as well as explore changes in attitudes over time.

In addition to most of the questions on past waves of the survey, this year, the study brought back questions from past waves focused on conflict resolution, attitudes towards gender related issues, and tobacco consumption among other issues.

A public presentation of the results at the Courtyard Marriot accompanied the release of the data. CRRC Georgia’s Research Director presented a number of findings of the survey, with a focus on changes in attitudes over the last ten years. Presentation slides are available in English and Georgian.


Further analysis of Caucasus Barometer 2019 will be forthcoming on CRRC’s Social Science in the Caucasus blog, including analysis of whether attitudes towards conflict resolution has changed, attitudes towards gender, and how people perceive the political environment. To keep up with new blogs, follow us on Twitter and Facebook.

Monday, January 29, 2018

2017 Caucasus Barometer Data Release

This week, 2017 Caucasus Barometer survey (CB) data will become publicly available on CRRC's online data analysis portal. CB is the longest running survey project in the South Caucasus region, with data available from 2008 to present. It enables the comparison of trends in the region over time. Caucasus Barometer 2017 was carried out in Armenia and Georgia in Fall 2017. To view the data for both countries or download the data sets, check our online data analysis platform from February 1.

Senior Policy Analyst David Sichinava discussing CB 2017 results at CRRC-Georgia's office.


Tuesday, April 25, 2017

How many Tetri are in a Lari? The importance of municipal statistics for good governance

[Note: This post was co-published with Eurasianet and authored by Koba Turmanidze, CRRC-Georgia's Director.] 

The government of Georgia committed itself to collect and publish policy-relevant data in a timely manner under the Open Government Partnership. Yet while most ministries and state agencies are happy to provide national-level statistics, they often fail to break them down to the municipal level. 

As a result, if you think about it in monetary terms, the current system means that officials do not know how many tetri are in a lari. 

Reliable municipal statistics can contribute to good governance in several important ways. First, municipal-level data can let citizens assess the quality of state services they receive compared to other municipalities, or to the national average. Second, municipal-level data can help policy makers improve the targeting of programs, and therefore, spend public money more efficiently. Third, it can help both government and citizens evaluate the successes and failures of municipal governance.

The following scenarios highlight the benefits of comprehensive data on a local level: 

Imagine you want to move from one town to another for a better job. You consider moving with your spouse and a child of school age. However, your spouse does not want to move, arguing that your town has much better public schools than the new one. In such cases, it would help if you could look at municipal-level education data to see if schools in the two towns are similar or different in terms of the student-teacher ratio, exam scores, the success rate on national examinations, etc. 

Imagine you are a civil servant and are working with an investor to build a new factory in a municipality. You want the factory to be built in the municipality where its social impact will be highest. To persuade the investor, you use municipal statistics to demonstrate that the municipality of your choice has high unemployment, yet its labor force is younger and better trained than in comparable municipalities. 

Imagine you are an analyst in a think tank and your task is to advise the government on whether to extend a poverty reduction program or not. The government claims the program helped to reduce poverty by two percentage points nationwide, but you have reasons to suspect that the reduction happened in certain settlements, whereas in others the program had a negligible impact. You look at relevant data on the program and poverty statistics, and conclude that the program’s effect across municipalities was truly unequal. Importantly, it made no difference in the most economically deprived communities. Therefore, you advise the government to redesign the program to improve its impact on the communities with the highest poverty rates, before pouring more money into it. 

Unfortunately, we can only imagine the above. These three scenarios remain purely hypothetical, since, in Georgia, reliable municipal data is rarely available on education, employment and poverty. 

CRRC-Georgia’s repeated interactions with a multitude of state agencies over the past three years have uncovered at least three problems regarding municipal data. First, when municipal data of potentially good quality exists, it is often not processed and made available to the public. Second, if municipal data is accessible, its quality is often questionable. Third, municipal data often does not exist at all, since the responsible agency does not recognize its value, or is unable to collect it due to lack of relevant training. 

Below are three concrete cases that correspond to these three problems: 

Case 1: Until recently, the National Assessment and Examination Center (NAEC) maintained detailed and high-quality data on the results of the Unified National Exams (UNE) for many years. The data allowed one to see which municipality’s and even school’s students were most successful in the exams. Such data was not proactively shared on the Center’s website, but was available upon request. The situation changed when the Center introduced electronic applicant registration in 2011. Under the new system, an applicant’s place of residence and school was no longer recorded. However, the Center could still identify the municipality based on an applicant’s ID number. 

For the 2015 UNE results, NAEC processed the data this way and made the data file available on its website. However, when CRRC-Georgia requested the same data for 2016, the Center turned the request down, arguing it no longer processed data per municipality, and would not do so for our sake. As a result, it is no longer possible to analyze municipal- or school-level performance and map it as we did in this blog post. At the time, this map drew attention to large differences in educational attainment countrywide, including an important fact – that Unified National Exam scores in Upper Ajara were among the worst in the country. In part in response to this fact, AGL, a Norwegian company building a hydro-electric dam in upper Ajara created a tutoring program for students in the region to help them prepare for the exams. If the NAEC withholds such data, it will hinder the ability of interested parties to spot trends and develop remedial policies.

Case 2: The Social Service Agency (SSA) is a leading organization in the country in terms of providing access to comprehensive data on poverty and targeted social assistance at the national and municipal levels. Among other statistics, the Agency reports monthly data on applicants and recipients of social aid. The 2014 census data, however, casts some doubt on whether the SSA poverty statistics are trustworthy. 

The scale of mismatch between the agency’s data and the 2014 census results is evident from the chart below. Using Geostat’s population estimates, the agency calculates the share of the population registered for targeted social assistance in each municipality. The census was conducted in November 2014, so it is possible to re-calculate the share of those registered for targeted social assistance based on the census data and compare it with the agency’s estimates. 

Let’s take the extreme case of Lentekhi. The agency reported that 44 percent of the population applied for targeted social assistance. When the census data is used, the finding is that 89 percent of Lentekhi residents registered for social assistance. Thus, the SSA estimate was 45 percentage points lower than the actual percentage. The chart below plots the differences between the shares of the population registered for targeted social assistance, as calculated and reported by the SSA on the one hand, and updated calculations based on the 2014 census data on the other, for each municipality in November 2014. Overall, the agency underestimated the share of applicants by 14 percentage points, on average. However, publicly available data has yet to be adjusted based on the 2014 census.    


Case 3: In a number of cases municipal statistics do not exist. Measuring the scale of economic activity (level of employment by employment sector, total value added, etc.) in every municipality would require large-scale surveys that are both time-consuming and expensive. Geostat’s periodic Integrated Household Survey cannot provide this information, due to the cost that such a large sample size would entail. 

However, the Revenue Service (RS) under the Ministry of Finance of Georgia could help solve this challenge. Based on taxpayers’ IDs, the agency can provide information about the number of taxpayers, be it individuals or organizations, and amount of taxes collected in each municipality. This information would serve as a good proxy of economic activity by municipality. However, as the RS told CRRC-Georgia, it can only break the data down for regions. Officials claimed that breaking the data down further was not possible. 

Undoubtedly, the collection and analysis of municipal data requires additional resources. However, the three concrete cases highlighted above show that a little increase in awareness regarding municipal data could go a long way toward promoting better municipal governance in important ways. Investors could have clearer insight into the best investment destinations, for one. Civil society groups would also have better ways to assess the successes and failures of government actions. Citizens likewise would have a better idea of where their place of residence stands compared to other parts of the country, or the national average. Government could have better tools to ensure equal access to services in the country, or to achieve efficiencies in the provision of services. 

All of this is possible. Unfortunately, it is not reality. And as a result, the government doesn’t know how many tetri are in a lari.


Monday, February 08, 2016

Playing on traditions: Has Russia’s propaganda worked?

Has Russian influence in Georgia increased in recent years? While the political elite and civil society leaders argue a lot about this issue, in an August 2015 survey, CRRC and NDI asked people what they think. Findings presented in a recent blog post show that a significant share of Georgians (44%) perceives Russian influence as having increased since 2012. This number is all the more alarming considering that only 17% think that the EU’s influence has increased during the same period. Paradoxically, all this is happening against the backdrop of Georgia’s declared EU aspirations and a number of important EU-related foreign policy achievements. This blog post explores how recent efforts of Russian propaganda may have contributed to a decline in support for EU membership.

European Initiative – Liberal Academy Tbilisi (EI - LAT) recently conducted research on Russian soft power and hard power policy in Georgia and published a policy brief highlighting specific mechanisms used by Russia to increase its influence in Georgia. The research findings suggest that there is evidence of increased Russian influence on Georgia, and the brief describes some of its mechanisms. According to the document: 

"Political myths are one of Russia[n] propaganda[‘s] most important tools in Georgia. Russian propaganda is often built on emotional messages to create and strengthen negative stereotypes of ethnic, religious and sexual minorities, discrediting the western political or cultural space and supporting homophobic and xenophobic opinions among the public. By cultivating these myths, Russia [presents] itself as Georgia’s only ally with a common identity, [religious] faith, history and culture. Simultaneously, it portrays the West as a threat to all the above-mentioned values."

While this statement is based on qualitative research findings, it finds support in CRRC’s public opinion survey data. In 2009, 2011, 2013 and 2015 CRRC conducted four waves of The Knowledge of and Attitudes towards the European Union in Georgia (EU survey) survey, funded by the Europe Foundation (formerly the Eurasia Partnership Foundation). These surveys’ findings show that, overall, the Georgian population’s reported support for Georgia’s EU membership has decreased between 2013 and 2015.


The EU survey data shows that Georgians increasingly perceive the EU as a threat to Georgian traditions. These traditions are extremely important for the people in Georgia who believe that preserving traditions is more important for a good citizen than being critical towards government or working as a volunteer. Thus, the above discussed mechanism of cultivating anti-Western myths may be very efficient in altering Georgia’s pro-Western course.

In fact, according to the EU survey data, the fear that the EU will harm Georgian culture and traditions has increased in Georgian society over the past seven years, especially after 2013. The 12% increase in the share of those who fully agree with the statement, “The EU threatens Georgian traditions,” over two years is a significant change and indicates the existence of a mechanism amplifying this fear.


The same attitude is demonstrated in the answers to another question asked on the same survey. About a third of Georgians believe there will be less respect for Georgian traditions if the country becomes an EU member. Notably, the share of those who think that respect for Georgian traditions will decrease significantly has doubled since 2013. 


The increasing fear that Georgia’s membership in the EU could threaten the country’s traditions can be considered another indicator or outcome of Russian propaganda discussed in detail by EI – LAT. Although this blog post does not prove that there is a direct causal relationship between Russia’s propaganda and changes in public attitudes towards the EU, the CRRC/EF data clearly show three trends that are, most probably, interrelated: 

1. Traditions are very important for Georgians; 
2. The EU is increasingly perceived as a threat to Georgian traditions; 
3. Although still at a high level, direct support for EU membership has declined. 

Based on both CRRC/EF and EI-LAT findings regarding Russia’s propaganda, we can assume that Russia’s propaganda was not only well informed and well planned, but also successful to a certain extent: the fear that the EU will harm Georgian traditions appears to have contributed to a decrease in the number of supporters of Georgia’s EU membership. This result is likely facilitated by the public not being well-informed about the EU, specifically – its commitment to preserve national traditions and supporting cultural heritage. 

The findings presented in this blog post shows that empirical research can be used not only for planning a successful propaganda campaign (by getting information on the most sensitive and important aspects of a given society), but also for detecting propaganda mechanisms and, potentially, taking counter measures.

Further research is essential and should focus on exploring the nature of the fear of “losing” traditions, as well as what people mean by Georgian traditions, as suggested by the Europe Foundation in a recent report. The findings also suggest that an awareness raising campaign on what EU membership actually implies is crucial for combating anti-Western propaganda.

If you would like to explore  Georgians’ attitudes towards the EU more, the data used for this post is available on CRRC’s online data analysis platform. As always, we welcome further analysis and your comments on our Facebook or in the comments section below.

Monday, September 21, 2015

Online data analysis (ODA)


Tuesday, October 07, 2014

The Wave of the Future: Optimism, Pessimism and Fatalism in Georgia


A recent CRRC regional blog post analyzed the presence of fatalism in Georgia. The post cited CRRC Caucasus Barometer (CB) data which shows that in 2013, 28% of Georgians agreed that “everything in life is determined by fate.” While the CB findings demonstrate that a sizeable portion of the adult population is fatalistic about the future, Georgians are increasingly likely to see that future in a positive light, whether it be determined by fate or not. This blog post analyzes survey data and finds a recent trend of Georgians describing both their present economic situation and expected future situation in more positive terms than in previous years. However, survey results also illuminate dissonance in Georgian society, as urban residents and the younger population are more likely to look to the future with optimism than are rural dwellers and older Georgians. Notably, members of the latter groups are more likely to hold fatalistic attitudes.

CB longitudinal data demonstrates that over time Georgians have become more likely to describe their current household standing in positive terms. The survey asks: “Let’s imagine there is a 10-step ladder reflecting the economic standing of all households in Georgia today…On which rung of this ladder do you think your household currently stands?” For the purpose of this blog post values were re-coded from a ten-point scale to a three-point scale, with rungs 1-4 designated as the “low” position, 5-6 designated as the “intermediate” position, and 7-10 designated as the “high” position. In 2009 CB results showed that 64% of Georgians described their household being in the “low” economic position in society. That proportion remains high but has steadily declined since, and by 2013 only 45% of citizens described their household position in the same terms. It should be noted that the largest decline in negative responses occurred from 2009 to 2010. One plausible explanation is that GDP recovered rapidly over the same period, with the World Bank reporting that Georgia’s GDP contracted by 3.8% in 2009 before growing by 6.3% in 2010. As for the “high” position, 11% of Georgians placed themselves there in 2013, compared with only 4% in 2009. It appears that most of the difference on the time series is accounted for by people changing their perception from “low” to “intermediate.”

Not only do Georgians feel better about their current standing, they are looking forward to a brighter future. In recent years the vast majority of adults in the country have seen the future of their households in uncertain terms at best, indicating “Don’t Know” or “Refuse to Answer” on the survey, and pessimistic terms at worst. Those attitudes haven’t disappeared, but public sentiment is becoming more sanguine. After describing their current position, respondents are asked “On which rung of this ladder do you think your household will be standing 5 years from now?” The percentage of Georgians expecting their household to be in the “high” position increased over a span of four years, showing an overall rise from 16% in 2009 to 29% in 2013. By contrast, the percentage of those indicating the “low” position was stagnant.


What is most telling about these numbers is that the proportion of pessimists did not rise, given that the proportion of “Don’t Know” and “Refuse to Answer” responses declined from 2009 to 2013, from 60% to 49% (after peaking at 65% in 2011).  This figure remains relatively high, however. At the same time the share of people indicating “high” and “intermediate” positions increased. Taken in aggregate, these numbers suggest that Georgians are more certain about their futures than they were four years ago, and increased certainty has apparently translated into higher expectations.

The data indicates, however, that residents of urban areas are much more likely to view the future with optimism than rural residents. Of those expecting their household to be in the “high” position in five years, 67% percent lived in urban areas (including Tbilisi). Of those expecting to be on the “low” position, 62% lived in rural areas. Thus we observe an association between urbanization and optimistic economic expectations. There is also a discord between age groups. Those aged 18-35 are the most likely to expect to be in the “high” position, while those aged 36-55 and 56+ are less likely to have that expectation and are increasingly likely to give DK/RA responses. According to the CB 35% of Georgia’s young adults indicated “high” compared to 27% of the middle-aged population and 23% of the elderly. It should also be noted that the under-36 age group constituted a larger proportion of the population in Tbilisi than in other urban (non-Tbilisi) or rural areas (42% of Tbilisi’s adult population is under 36, compared to 36% of the population in other urban areas and 31% of the rural population), so it is unclear whether age group or settlement type is a better indicator of optimism.


The presence of fatalistic attitudes offers a possible explanation for these cleavages. Those residing in Tbilisi are more likely to be optimistic about the future and much less likely to agree that “everything in life is determined by fate,” with the CB 2013 finding that 18% of Tbilisi residents agreed with the statement compared to 29% of urban Georgians (excluding Tbilisi) and 32% of rural inhabitants. However, it must be noted that non-Tbilisi urbanites were more likely than residents of Tbilisi to indicate both expectation of the high economic position and having fatalistic attitudes. As for the age divide, only 23% of those aged 18-35 indicated fatalistic attitudes, compared to 26% of the 36-55 age group and 34% of those 56 and over. Comparing age groups, we observe a negative association between optimism for the future and fatalism.

This statistical analysis indicates that Georgians have demonstrated increasingly optimistic attitudes over the past four years. While that is good news, exuberance should be tempered by the fact that high expectations are largely concentrated in the urban population and those under the age of 35. The lack of optimism amongst the rural and 36+ populations also appears to be associated with the presence of fatalistic attitudes in Georgia. Georgian society is becoming more optimistic on the whole, but growing optimism is not spread evenly amongst the population.

For additional information concerning public opinion in Georgia take a look at our data using the CRRC’s Online Data Analysis tool.


Friday, February 24, 2012

ODA Keyword Search

Most CRRC users know about our Online Data Analysis tool, ODA. It is easy to use, continues to be popular, and in less than a year we have had nearly 70.000 charts generated.

What is less well known, as we realized from questions we received, is that ODA also has a useful keyword search, in case you want to find particular pieces of data. Let's say you are interested in Georgian attitudes to the Chinese:


Select the dataset (1), go to Codebook and Keywords (2), and then enter your word (3). In the screenshot here, you already see the results. Note, as highlighted in pink, that we still have occasional typos (marring). These constitute less than 1% of the questions, but yep, the tool is not perfect yet, and you may want to try out different keywords. If you notice a spelling mistake, please leave a comment below.

At any rate, keyword search should further expand the usability of our Online Data Analysis for you, which is why we wanted to let you know about it. Try it out by clicking here on ODA.

Wednesday, December 07, 2011

Can a Cut NATO Supply Route Through Russia Benefit Georgia and Azerbaijan?

The 20th anniversary of the dissolution of the Soviet Union is upon us, and US-Russian tensions have risen as Russia contemplates terminating the NATO supply route through Russia. International news reports such as The New York Times detail the threat as a “death blow” to the U.S.-led NATO mission in Afghanistan and indicate that this could be a blessing in disguise for NATO hopeful Georgia, as well as for Azerbaijan.

NATO has two main transportation routes via the Northern Distribution Network (NDN), which connects Baltic and Caspian ports with Afghanistan via Russia, Central Asia and the Caucasus: the NDN North and NDN South. The NDN North transit route initiates in Latvia, crosses through Russian territory and enters Afghanistan via the Afghan-Uzbek border. The potential blessing for Georgia and Azerbaijan lies in NATO’s NDN South transit route that spans from the port of Poti in Georgia to the Afghan-Uzbek border. The potential termination of the NDN North route leaves the NDN South route as a viable alternative. The NDN South route currently facilitates the transportation of 30% of the U.S.-NATO supplies to Afghanistan, as reported by the Center for Strategic and International Studies (CSIS). Should Russia close its borders to NATO, and the NDN North route cease to function, this could provide an opportunity for economic diversification in the way of transit fees for Georgia and Azerbaijan. This move could also open trade possibilities between Georgia, Azerbaijan and Afghanistan, as well as add leverage for future NATO membership.

Map from Google Earth. Courtesy of CSIS

Therefore, the issues at hand are two-fold. Are Georgia and Azerbaijan willing or prepared for further commitments to the NDN South transit route? What implications does this have for both the future of Georgian and Azerbaijani NATO membership as well as commercial trade?

First, CRRC’s 2010 Caucasus Barometer (CB), shows that NATO membership is supported (fully and somewhat) by 70% of the Georgian population. Support for NATO membership is less in Azerbaijan where 44% of the population is supportive (fully and somewhat) (See the previous post by Nikola for more details). Thus, increased use of the NDN South route could generate an opportunity to demonstrate further interests in NATO membership. Based on public support for NATO membership, more use of the NDN South route could be welcomed.


Second, more traffic through the NDN South route could economically benefit Georgia and Azerbaijan. Data from the World Trade Organization (WTO) shows that trade in commercial services (including transport) is a growing industry in Georgia. As indicated below, Georgia has seen an increase from 2009 to 2010 in import and export transportation (excluding government services). Azerbaijan has seen a slight decline in export transportation, but an increase in import transportation.

Data retrieved from WTO website

Thus, Georgia and Azerbaijan could benefit at least economically if Russia decides to cut off the NDN North transit route.

Friday, October 14, 2011

Fancy Living Abroad? 39% of Young Armenians Say "Preferably Forever"

Last year, Ani Navasardyan asked, “Why do so many Armenians leave Armenia?” Migration is also an issue in Georgia and Azerbaijan. Data from the CB 2010 reveals that around half of the respondents in Georgia (47%) and Azerbaijan (52%) are interested in temporary migration. Still, Armenia stands out since 64% of the adult population is open to the idea of temporarily leaving the country.

With regard to permanent migration, only 7% of Georgians are interested in leaving the country, compared to 17% of Azerbaijanis and 29% of Armenians who say that they would be interested in leaving their country for good.

The analysis by age group shows that younger people in all 3 countries prefer to migrate temporarily. Three out of four young Armenians (77%) between the ages of 18 to 35 are interested in going abroad temporarily. Equally striking, in its own way, is that many people 56 years and older would leave (38%). In Azerbaijan and Georgia too, interest in temporary migration declines with age. Interestingly, young and middle aged Georgians show a similar interest in temporary migration with affirmation rates of 58% and 52%, respectively.


When looking at the interest in permanent migration by age category, there is also a trend where younger people have more of a desire permanently migrate abroad. Georgia has the lowest percentage of young people (9%) who are interested in permanent migration. There are more than twice as many young Azerbaijanis (24%) who would leave permanently, and more than four times as many young Armenians (39%).

If you are interested in slicing CRRC's data on migration by gender, settlement type, income, knowledge of English or other aspects, we welcome you to analyze our data online.

Tuesday, May 10, 2011

ODA – CRRC Data Analysis Online

CRRC is happy to announce its new Online Data Analysis (ODA) program! Crunching numbers from CRRC surveys is now easier than ever.

The CRRC Georgia office has initiated and created this special program with the help of Irakli Naskidashvili. The ODA provides users with the opportunity to access survey data and analyze data online without having to use any special statistical program, such as SPSS or STATA.

The ODA is extremely user-friendly. With one click you can choose a survey question of interest and receive a chart and a table in Excel online. Charts and tables can be exported and downloaded in accessible formats.

Currently we have available on the ODA both the 2009 and 2010 Caucasus Barometer surveys, which includes data on all the three South Caucasus countries. The ODA will be periodically updated with new data gathered by CRRC.

An example of a slide on ODA:

An example of a table on ODA:

Interested? Check out ODA now!

Thursday, April 07, 2011

The Caucasus Barometer 2010 Dataset Is Available!

What are the social, political and economic attitudes of people in Armenia, Georgia and Azerbaijan? Do Georgians, Armenians and Azerbaijanis think employment or territorial integrity is the most important issue facing their respective countries? How do they judge the fairness of elections or media independence? How trusting or supportive are they of the European Union, NATO membership or local institutions? You can find the answer to these questions and many more in CRRC’s 2010 Caucasus Barometer survey dataset which is now available on the CRRC website.

The Caucasus Barometer is CRRC’s annual and nationwide household survey conducted in Armenia, Azerbaijan and Georgia and is in its eight year. The survey covers a wide range of attitudes and opinions on economic, social and political issues. The 2010 survey also includes many new questions on gender issues, employment, internet and cell phone usage, as well as questions on Armenia-Turkey and Georgia-Abkhazia relations.

For example, here is a slide from the CB 2010 survey which shows that 70% of the Georgian population supports Georgia’s membership in NATO, while 44% of Azerbaijanis and 37% of Armenians support their respective countries' membership in the organization.

The next slide on emigration shows that Armenians are more inclined to emigrate from Armenia (both permanently and temporarily) than Georgians and Azerbaijanis are from Georgia and Azerbaijan, respectively.

These are two examples of the fascinating kinds of data available from the survey. The questionnaire and dataset in SPSS or STATA are available on CRRC’s website. We welcome your visit!

Saturday, March 19, 2011

Spreading the News: File Sharing through Mobile Phones in Armenia

How do multimedia phones affect the way media is consumed and circulated? Katy Pearce lays out interesting findings for the case of Armenia in the International Journal of Communication (5, 2011, pp. 511-528).

Amongst others, Pearce’s analysis relies on CRRC’s Caucasus Barometer (CB), illustrating the use of information and communication technology. The data indicates that Armenians are adapting to personal computers and the Internet more slowly than are individuals in neighboring and more economically developed countries. Only 14.7% of Armenian households own a personal computer, 77.4% of respondents report no basic computer skills, and 71% report no Internet skills. Web contents in the Armenian language are still limited.


The delay in some technological access also, paradoxically, fosters creativity: mobile phone usage is rapidly expanding and reached almost 81% in 2008. Especially the spread of multimedia phones since 2006 enables Armenians to substitute services that would be otherwise provided by personal computers. Pearce explores how Armenians share videos, pictures and audio files and in which way prevalent cultural norms foster social sharing. While most of the circulating files serve entertainment purposes, the author illustrates through selected cases how politically relevant contents play a role in population engagement – and are used within this realm by opposition activist groups.


For the full report, click here.

Friday, October 08, 2010

Is the Caucasus in Europe or Asia? | Tim Straight at TEDxYerevan

A particularly intriguing talk at TEDxYerevan was given by Tim Straight, Honorary Consul of Norway and Finland to Armenia. Is the Caucasus in Europe or in Asia? Tim highlighted that there are five countries that defy easy categorization: Russia, Armenia, Azerbaijan, Georgia, and also Turkey. Tim explores how the dividing lines fall according to corporations, mapmakers and values.


In his talk, Tim drew on data from CRRC, but also from the World Values Survey. From CRRC, Jenny Paturyan and Laurene Aubert analyzed the data, helping to make the talk happen. Please let others know about the talk, if you liked it. (If the link does not work, let us know, we just updated it.)

Sunday, August 08, 2010

Respondent Evaluation | A Great Tool for Looking into Survey Interviews

What are the patterns in how the respondents are rated by the interviewers? The relevance of this question is beyond doubt, as patterns in such ratings allow for an idea of the reliability of the data as well as for more general insights into the settings in which interviewers are gathering data. Relevant data has been gathered in the Caucasus Barometer (CB) survey for years, enabling us to analyze the impressions that interviewers have gained during their work in the South Caucasus.

One particularly interesting endeavour is to make comparisons between the perceptions of interviewers in the three countries – Azerbaijan, Armenia and Georgia. In all three cases, interviewers were asked to evaluate issues affecting the interview such as levels of distraction, frequency of the need for clarifications, or the extent to which respondents were reluctant to answer questions. Perceptions of the personal characteristics of respondents, such as sincerity, comfort and interest, are also recorded. Patterns of interviewer’s ratings can subsequently be identified by looking at several of the measured variables. These also allow us to filter out interviews in which respondents were uncomfortable, or seemed insincere.

One first interesting finding is that interviewers in Azerbaijan seem to face more obstacles in the interviewing process when compared with their counterparts in Armenia or Georgia. More concretely, respondents in Azerbaijan are more frequently in need of clarifications of questions and also show more often a lack of knowledge on a certain subject. Only in slightly above 20 percent of the cases were the interviewers in Azerbaijan ‘never’ (i.e. not throughout the entire interview) confronted with such situations. By contrast, in the neighbouring countries, such instances comprise over 30 percent (see Figures 1 and 2). A comparison between Armenia and Georgia shows that inhabitants of Georgia seem to have difficulties in slightly fewer instances, and in particular appear more knowledgeable to the interviewers. (Interestingly, there is some evidence that respondents in all countries seem to face more difficulties in answering questions without clarifications in 2009 as compared to 2007-08, but this is yet another topic.)


Given the above findings, it is then arguably strange that Azerbaijani and Armenian respondents were labelled as "more comfortable" compared with the Georgian respondents (see Figure 3). In other words, although Georgians are perceived by their interviewers to have less trouble during the interview (as reflected in need of clarifications and lack of knowledge), this does not coincide with a more comfortable behaviour even if one might have expected that. However, in all three instances, there is a comparably low number of nervous respondents (slightly less than 10 percent), which suggests that nervousness is not a particularly serious problem in any of the surveys.

Finally, of the many interviewer ratings the CB includes, another remarkable one is the evaluation of interest and involvement. The first striking aspect here is that in all three countries, most respondents do not appear to be interested or involved during the interview. Moreover, Georgians are least interested/involved in the interview process (less than 30 percent were assessed as interested), whereas Azerbaijanis are the most interested (approximately 45 percent; see Figure 4). Armenian subjects are, as in the above cases, perceived to be somewhere in the middle (40 percent). Thus, while interviewers in Azerbaijan seem to be more often confronted with a lack of knowledge and confusion about questions, interviewers in Georgia more often come across higher levels of perceived disinterest and lack of comfort on the part of the their respondents.
 

To be sure, these ratings are done at the end of the interview, and we know that we cannot ask complex questions at this point anymore. Typically we've been talking for 45 minutes and have exhausted the patience of the respondent. Nevertheless, these findings remind us that we need to keep our questionnaires short.

While we know that particular wordings may lead to slightly different interpretations in different languages, the interviewer ratings give us a glimpse into what is going on, and thus help us improve the quality further. Survey work is nearly never perfect. It's a process of continuous improvement. Plenty of opportunities for researchers to analyze the data more closely.

Wednesday, June 16, 2010

Language Learning in Georgia

In winter 2008, CRRC together with the American Councils conducted some research on the ways foreigners learn languages in Georgia. Hans Gutbrod and Malte Viefhues have recently published a paper in CRIA, analyzing the results and providing interesting insights into incentives to language learning and the importance of Georgian and Russian for foreigners in the country.

The data indicates that while Georgian is very important for living in Georgia, Russian is more useful in a professional context. This could explain why, on average, the respondents – many of whom have worked in different CIS countries – have a better level in Russian than in Georgian. As these languages serve in different domains, knowing one did not keep the respondents from learning the other: 87 percent of the respondents with Russian skills know some Georgian as well.

To read the full paper, visit the CRIA's website.

Tuesday, May 18, 2010

Caucasus Barometer | A New Name for the CRRC's Data Initiative

The CRRC’s annual Data Initiative Survey will be renamed into the Caucasus Barometer starting from 2010. At CRRC, we think that the new name better reflects the essence of the survey and is more understandable for the general public and the journalists.

The Data Initiative was first launched in 2004. Since 2007, a representative sample of approximately 2,000 respondents is interviewed annually in each of the counties. They answer core questions about household composition, social and economic situation of households, employment status, assessments of social and political situation in the countries, as well as respondents’ perceptions about direction of life. In addition, we include questions about media, health, crime, and other topical issues.

The change of the name, however, will not cause any changes in the way the survey is carried out – it is still an annual survey conducted every fall in all countries of the South Caucasus, employing the same methodology and the same survey instrument. Its major goal is to get reliable longitudinal empirical data to understand various aspects of the processes of social transformation in Armenia, Azerbaijan, and Georgia. We are committed to ensure the highest possible scientific quality through all the steps of survey implementation.

The data and the survey documentation are open to all interested researchers and represent a unique tool for further quantitative analysis. You can find more information about the Data Initiative/Caucasus Barometer on our website.

Monday, March 15, 2010

New Policy Advice on Migration and Development in Georgia

Migration is a major factor in Georgia. Many Georgians live abroad, and by some estimates the money they send back accounts for nearly 10% of Georgia’s GDP. Did you know that households in rural areas who receive such aid are less likely to be poor, but that in Tbilisi, the opposite is true? Robert Tchaidze from the IMF and Karine Torosyan from CRRC’s partner institution ISET are about to reveal not only who in Georgia migrates, and when and where they go, but also how the country could take advantage of these migration flows in the future.

Their report “Measuring and Optimising the Economic and Social Impacts of Migration in Georgia” is not yet available online, but you can find an early summary. Robert and Karine’s work is part of the global project “Development on the Move” that was created by the Global Development Network and the Institute for Public Policy Research. It aims at analyzing the impact of migration on development around the world, and how these flows can be profited on with adapted public policy, as we had previously mentioned in our blog.

Georgia is one of six countries that have been selected for in-depth quantitative and qualitative studies. In this particular case, CRRC carried out the fieldwork, and we are happy to see our high-quality data used for valuable public policy advice.

Please let us know if you would like to receive the full document once it gets released publicly.

Friday, February 12, 2010

Social networks in rural and urban Georgia

It is often stated that life in a city is fundamentally different from that in rural areas. In the West, village life is said to be more intimate, and its inhabitants more caring about their peers, with strong ties between neighbors and family members. Can this also be said in the South Caucasus? After all, family relations and friendships are supposed to be strong in countries like Georgia. Do these ties reach into the cities, erasing the difference between strong social networks in rural areas and the more anonymous, independent urban setting?

The data from our 2008 Data Initiative (DI) gives us several clues as to how to answer this question. Georgian respondents in three settlements types - rural, urban (excluding the capital), and Tbilisi - were asked about their views on their social environment. The results showed that people with positive feelings about their social networks were, contrary to our expectations, most likely to be found in the capital, but least likely in other urban areas.

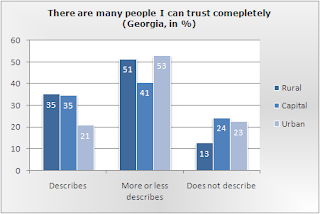
According to our data, inhabitants of rural settlements and Tbilisi are most likely to have enough people to trust. Villagers also have the lowest percentage of people lacking this kind of social support. Our question asked the respondents whether they had “many people to trust completely.” Respondents were most likely to agree with this statement in rural areas and Tbilisi (both 35 percent). Urban Georgia came out last, where only 21 percent felt they had trustworthy people around. By contrast, 24 percent in Tbilisi and about 23 percent in other urban areas said they cannot trust many people in their social environment. In rural Georgia only 13 percent of respondents said the same. The neutral answer reading “the statement more or less describes my feelings” was most often recorded in urban areas (53 percent), followed by rural Georgia (51 percent) and Tbilisi (41 percent).


When asked about people close to them, respondents in Tbilisi were more often satisfied with their situation than those living in other settlement types. Inhabitants of rural areas were least likely to express a lack of close friends. In response to the proposed statement “I have enough people I feel close to”, urban Georgia had again the least favorable response pattern. In cities like Batumi or Rustavi, only 41 percent of respondents stated that they have many close people around. Fifty percent in the capital and 45 percent in rural areas agreed with this statement. This time, Tbilisi also had the highest percentage of negative answers, with as much as 13 percent of the respondents thinking that they lack close friends. Only 9 percent of answers recorded in rural parts of the country, and only 10 percent in urban Georgia, reflected the same negative feelings. The neutral answer was most likely to be found in rural settings and urban areas (both 46 percent), followed by the capital (37 percent).

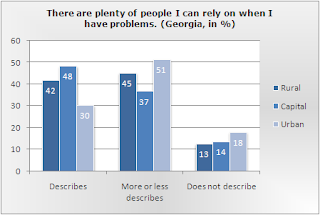
In response to the statement “there are plenty of people I can rely on when I have problems”, once again more people in the capital than in other parts of Georgia agreed, and urban Georgia featured the highest percentage of respondents who miss reliable people when they encounter problems. In urban Georgia only 30 percent of the respondents felt safe to turn to their friends when in trouble, and there were 18 percent who thought that they cannot rely on their social environment in this way. Both in the capital and in rural areas, the spread between positive and negative answers is much higher: in Tbilisi a full 48 percent agreed that they have plenty of reliable people around, compared with 14 percent who disagreed. In rural areas 42 percent gave a positive and only 13 percent a negative answer. The percentage of respondents who chose “describes more or less my feelings” as their answer was lower in the capital (37 percent) than in rural (45 percent) and urban Georgia (51 percent).


Now, which settlement has the highest quality of social networks? If we take a negative definition (i.e. we search the type of settlement with the smallest percentage of respondents expressing a lack of sound social ties), rural life seems to be the best choice, with the fewest amount of people choosing the negative answers. If, however, we compare positive answers (i.e. we search the type of settlement where the highest percentage of respondents were satisfied with their social networks), the capital is ahead of rural settlements. With both definitions, urban Georgia (excluding the capital) comes out last in the comparison. This hints to the fact that city life might have significant drawbacks, but that they have been compensated in Tbilisi by factors not present in other urban settlements. By the way, people in the capital also tend to have a more pronounced opinion about these matters, with fewer respondents choosing the neutral answer in response to the three statements.

What are the factors that help Tbilisi to counterbalance some of the negative aspects of city life? Why does it have so many people satisfied with their social networks, without the large numbers of unsatisfied respondents found in other cities in Georgia? Some of these factors might be found with the help of our survey data. If you feel like exploring this interesting subject, or would like to see similar data for Armenia or Azerbaijan, we invite you to visit http://www.crrccenters.org/sda, where you can find all of our 2008 DI survey data for free, accessible via an easy-to-use web interface. Comments and ideas are appreciated.

Wednesday, February 10, 2010

Top Ten Leisure Activities in Georgia

Wondering what Georgians do in their free time? Do they read, listen to music, go to cinemas and theatres, stay at home and spend time with their families, watch TV, or just sleep?

Find out what are the ten top leisure activities in Georgia, according to a nationwide survey recently conducted by CRRC.

Read the full article, which was recently published in Georgian Times, here.