Showing posts with label Household. Show all posts

Wednesday, July 13, 2022

The importance of remittances for Georgian households

Note: This article first appeared on the Caucasus Data Blog, a joint effort of CRRC Georgia and OC Media. It was written by Anano Kipiani, a Policy Analyst at CRRC-Georgia. The views presented in the article are of the author alone, and do not necessarily reflect the views of CRRC Georgia, or any related entity.

Immigration from Georgia is common, with a prime motivator being the difficult economic situation in the country. Indeed, about three-quarters of Georgians have a close relative living abroad, and most send remittances to their relatives in Georgia. In turn, remittances made up 12.9%  of the country’s GDP in 2019. By comparison, agriculture’s contribution to GDP was about half of this number, at 6.5%. 

The study compared households that receive remittances to: similar households without remittances; similar households with migrants but who do not receive remittances; and similar households without migrants. 

Additionally, households that have migrants, but do not receive remittances were compared to the other three groups of households. This was done using a process called matching, which identifies similar groups of individuals.

Who gets remittances?

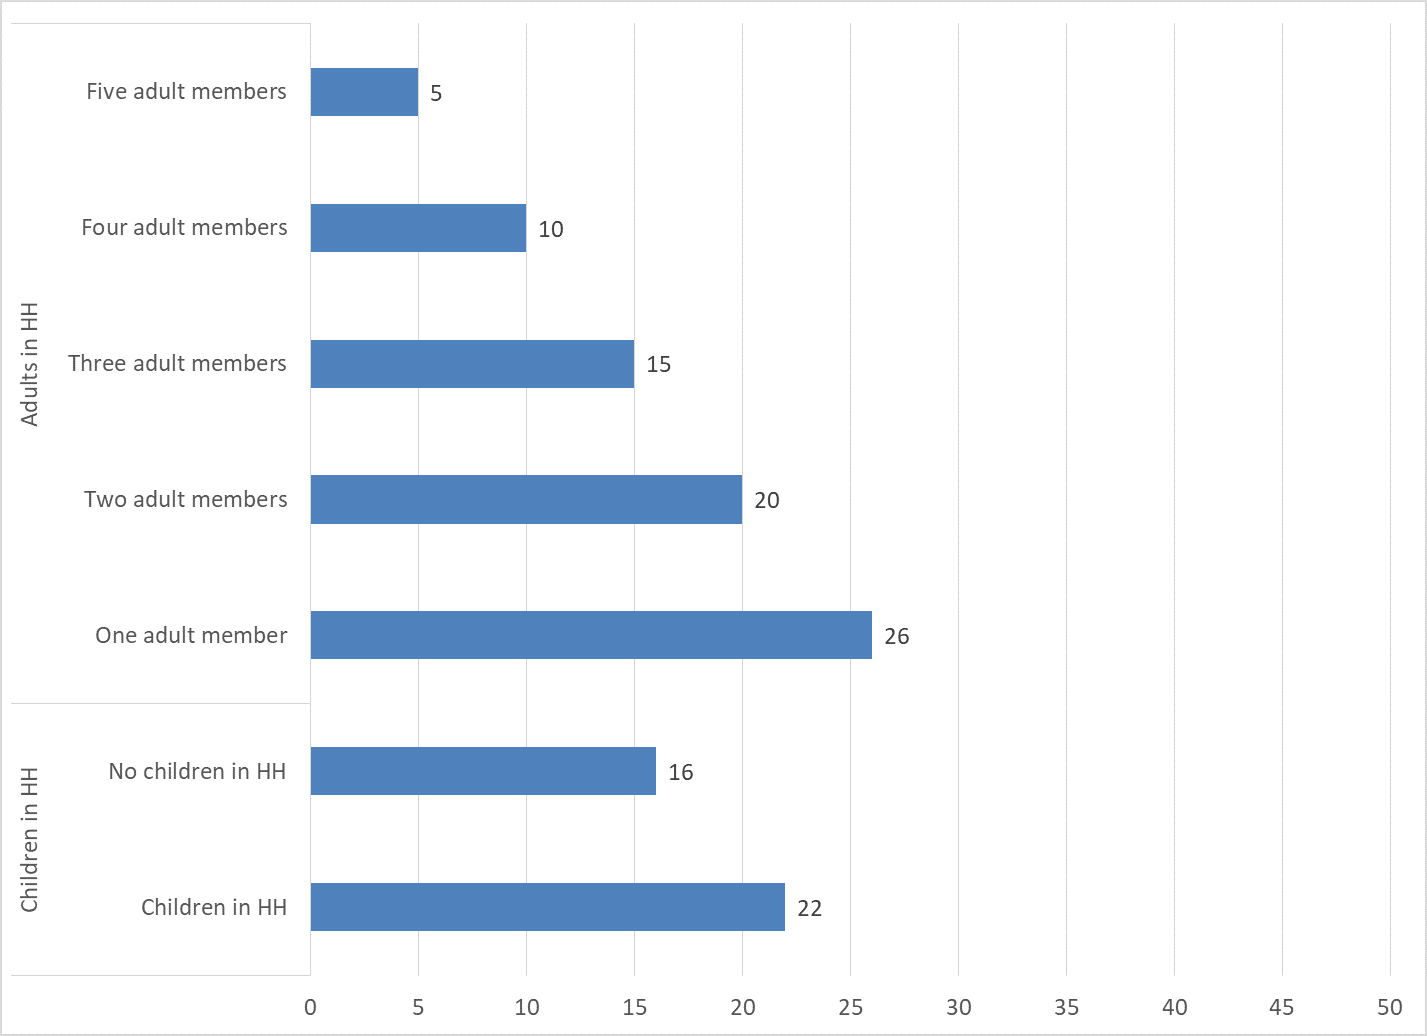
Overall, 19% of households reported receiving remittances from abroad in 2019. While looking at the types of households that receive remittances, a regression analysis suggests that households with one adult household member are 21 percentage points more likely to get remittances than households with five adult members. Households with children are six percentage points more likely to get remittances than households without children.

What are the impacts of remittances?

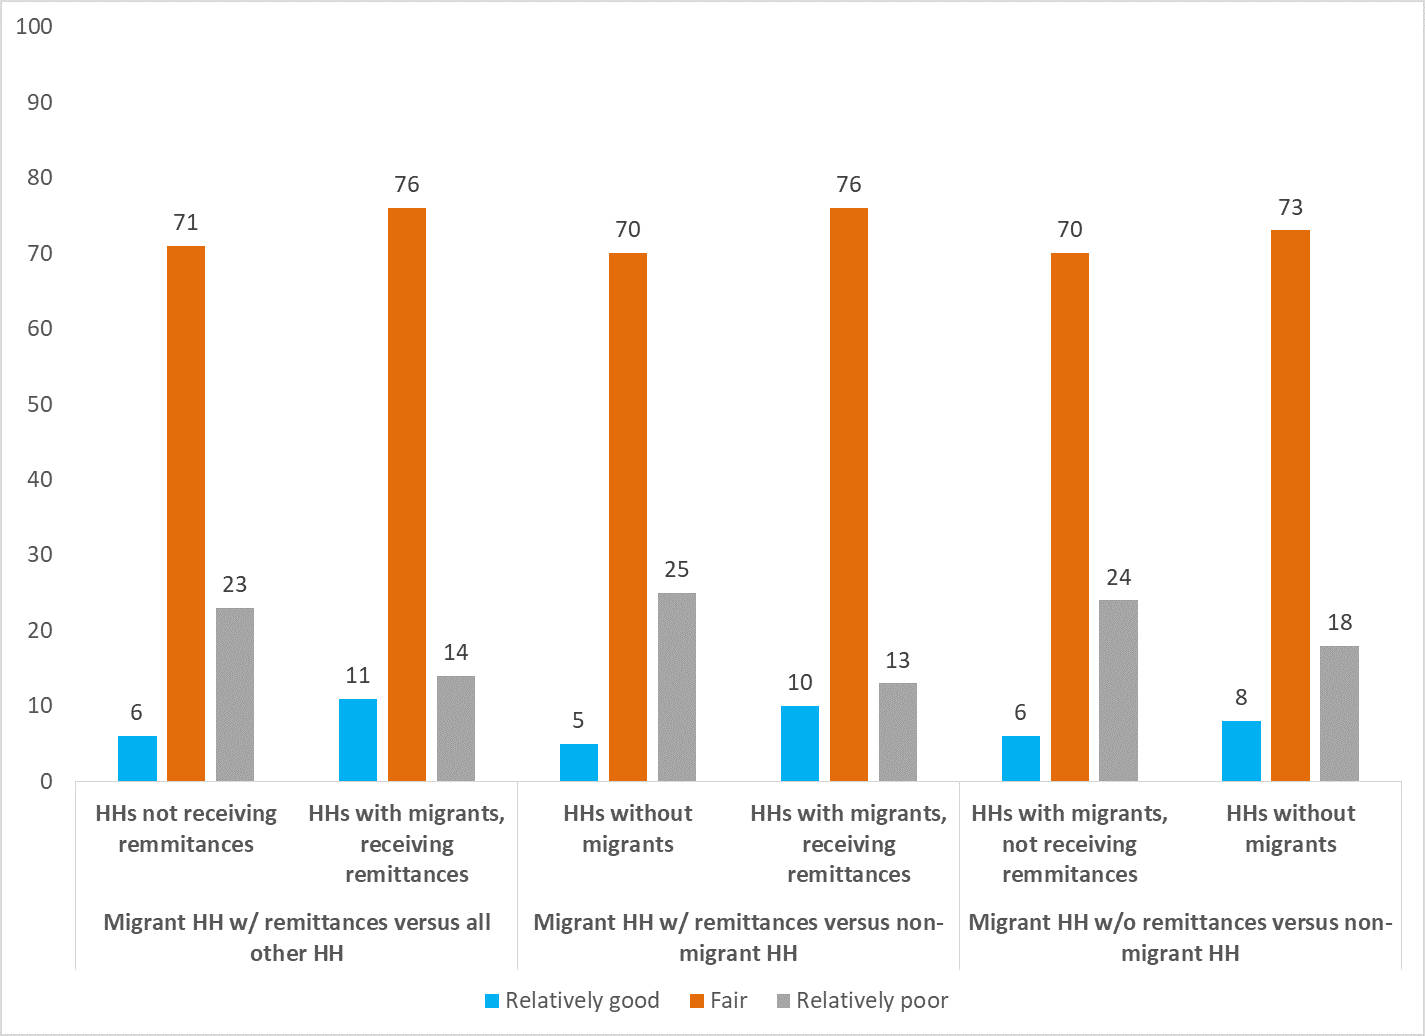
Households which receive remittances report their economic conditions are relatively positive compared to similar households that do not receive remittances. They are five percentage points more likely to assess their economic condition as relatively good, and nine percentage points less likely to believe they have relatively poor economic conditions. 

In contrast, migrant households that do not receive remittances are slightly more likely to assess their economic condition negatively (by six percentage points) compared with households that do not have migrants. 

Note: Answer options 'good' and 'very good' are recoded as 'relatively good', while 'poor' and 'very poor' are recoded as 'relatively poor'. Due to their small number, 'don’t know' and 'refuse to answer' were dropped from the analysis. In some cases, figures in this post may not sum up to 100% due to rounding errors.

Households that receive remittances compared with all other households were nine percentage points more likely to be able to afford enough food and clothes, five percentage points more likely to be able to afford to buy expensive durables, and eight percentage points less likely to not have enough money for food compared with other similar households. 

Remittances also appear to be associated with higher monthly incomes. Households with remittances are seven percentage points slightly less likely to report they earn less than $100 a month compared with all other households and migrant households without remittances. However, households with remittances are slightly more likely to respond ‘don’t know’ or refuse to answer, which is often associated with higher levels of asset ownership and in turn, likely income, in Georgia. 

Households that receive remittances also have more durable goods than others. From a list of 10 different goods asked about on the survey, migrant households owned nearly one additional good on average. At the same time, households with migrants that do not receive remittances had slightly fewer durable goods than households without migrants.

Overall, the data suggests that people benefit from receiving remittances, at least in economic terms. In contrast, households that have migrants but do not receive remittances do relatively poorly on some measures, though by no means all. Despite these positive economic impacts, the results do not speak to any effects, social, psychological, or otherwise, which may be tied to migration.

The data used in this post as well as replication code for the analysis is available here. A full policy brief on this issue is available here. The views expressed in this article are the author’s alone, and do not necessarily reflect the views of CRRC Georgia.

Tuesday, May 07, 2019

Men report doing more at home than they likely do in Armenia and Georgia

[Note: This article first appeared in OC-Media.]

In Armenia and Georgia, traditional gender roles continue to define the division of labour within families. Although a few tasks are within men’s domain and a few others are more or less equally shared, for the most part, women hold the primary responsibility for household duties.

However, men and women also have different perceptions of how much work each are doing: data from a UN Women survey on women’s economic activity and engagement in the informal labour market suggests that men tend to overestimate their own household contributions relative to women’s.

Most Armenians and Georgians see household tasks as divided according to standard gender roles. As shown below, when asked who in their household was mainly responsible for certain tasks, people said that cleaning, cooking, and laundry are often done by women. More Georgians than Armenians said that men share the responsibility of childcare with women: 28% of Georgians said that both male and female household member are responsible for childcare, compared to 12% of Armenians.


Men tend to have fewer household duties. Among the long list of household tasks asked about, ‘Repairing things around the household’ is the only activity for which men are primarily responsible. Grocery shopping is the only household activity with a distribution perceived to be near-equal. The only other task where there is a relatively higher number of shared responsibilities is related to ‘Taking care of other family members’, although the task is still mostly performed by women. These percentages are similar across Armenia and Georgia.


However, men and women also have different perceptions of how household labour is split— and the data suggests that men tend to overestimate the relative share of their contributions. Across a wide range of household tasks, men are more likely than women to report that duties are shared equally. Women, on the other hand, are more likely to report that tasks are their responsibility. This gap is larger in Georgia, where men report more involvement in household labour than in Armenia.

The perception gap is more striking for the activities in which men reported higher levels of equal involvement. For example, as we see below, 20% of Armenian men and 40% of Georgian men said that childcare duties were shared equally, while only 7% of Armenian women and 18% of Georgian women agreed. Regarding grocery shopping, 57% of Armenian men and 57% of Georgian men said that men and women were equally responsible, while only 39% of Armenian women and 42% of Georgian women agreed.


This is not unique to Armenia and Georgia: it’s consistent with trends from other contexts showing that even when both parents work outside the home and aspire towards an equal division of household labour, in practice, women usually still end up doing more. Surveys from the US show that although men are doing more in the house than ever before, they still do not do as much housework or childcare as their partners. Despite this, men are more likely to say that duties are shared equally.

Indeed, in Armenia and Georgia, when asked about the actual time people spent on tasks, women were likely to report higher average hours for most tasks. While men and women reported roughly equal time spent grocery shopping, and men spent more time fixing things, the amount of time required for these tasks was much less than women reported spending on childcare, cooking, or cleaning.


So how do men and women feel about this? Despite these differences, most people in Armenia and Georgia said they expressed satisfaction with their household labour division.  Only 6% of Armenian men, 10% of Armenian women, 5% of Georgian men, and 9% of Georgian women said that they were either ‘dissatisfied’ or ‘very dissatisfied’ with the breakdown of labour in their household.
Gender stereotypes appear deeply rooted in labour distributions in families in both countries. Women bear primary responsibilities for most household activities, while ‘repairing things around the house’ is the only predominantly male activity. Even when men think they are sharing household duties, in practice, women are still likely to be doing more.

This article was written by Meagan Neal, an International Fellow at CRRC-Georgia, and Kristina Vacharadze, CRRC-Georgia’s Programmes Director.

The data used in this article are available at CRRC-Georgia’s Online Data Analysis tool

The views presented in this article are the views of the authors alone and do not represent the views of UN Women. 

Friday, April 03, 2015

Gender roles in Azerbaijan: A cross-generational continuum


While the choice of pink versus blue has come to symbolize how parents and other adults establish a gendered order throughout youngsters’ childhood, the construction of gender roles dynamically accompanies people throughout their life. It starts from early childhood with how children are supposed to play, dress, talk and, most importantly, how they are supposed to act, what competences they are supposed to develop, and what they are encouraged to do as adults. Thus, children’s potentials are largely defined by societies according to their gender – which is a priori defined by their sex. This comes to define not only what men and women “should do”, but also what they can and cannot do. CRRC-Azerbaijan’s 2012 Social Capital, Media and Gender Survey in Azerbaijan, funded by the Swedish International Development Cooperation Agency (SIDA), provides the opportunity to explore this normative dimension of gender roles and its promotion from childhood through adulthood in Azerbaijan.

Tracing gender role construction during childhood is an ambitious aim for a blog post, but nevertheless some basic insights can be discussed while looking at the answers to the questions “When you were a child or teenager, were you taught how to cook // clean the house // clean the bathroom/toilet // fix home appliances // do laundry // drive a car // do shopping for groceries // care for younger siblings?” From the chart below it is clear that as children, people were taught how to perform different tasks in accordance to their gender. Thus, females were taught how to cook, clean the house and the bathroom/toilet as well as do laundry much more frequently than males. Males were predominantly taught how to drive a car and how to fix home appliances. In almost all of these cases, the difference between males’ and females’ answers is greater than 50%.


Note: Options “Do not know” and “Refuse to answer” are excluded from the analysis throughout this blog post.

One might wonder if there are any generational differences in what children in Azerbaijan were taught to do in different decades and, thus, what duties and activities different generations were expected to perform. In other words, did people of different ages report learning different tasks during their childhood? As is clear from the next chart, different age groups did not report differences in the nature of tasks they were taught to perform as children or teenagers. Although one might expect the gendered character of taught activities to be less visible in younger generations, the data does not support this supposition.

In order to have a clear picture of what children of different generations were taught in Azerbaijan, the predominantly female-taught activities such as cooking, cleaning the house, cleaning the bathroom/toilet and doing laundry were combined into ‘taught to do housework,’ while predominantly male-taught activities such as drive a car and fix home appliances were combined into ‘taught how to drive a car and/or fix home appliances’. Interestingly, no variation can be seen by age groups, thus showing that children have been taught what to perform in a gendered manner over the decades – females were consistently taught how to cook, clean the house, clean the bathroom/toilet and/or do laundry, while males were taught how to drive a car and/or fix home appliances.


Note: A positive answer to at least one of the predominantly “female-taught” activities (“taught how to cook”, “taught how to clean the house”, “taught how to clean the bathroom/toilet”, and “taught how to do laundry”) was coded as “Yes” in “taught to do housework”. Similarly, a positive answer to at least one of the predominantly “male-taught” activities (“taught how to drive a car” and “taught how to fix home appliances”) was coded as “Yes” for ‘taught how to drive a car and/or fix home appliances’.

While it is a jump to explain adults’ perceptions of gender roles and occupations by what they were taught to do as children or teenagers, it is nevertheless interesting to see if these roles are internalized and thus there is a gendered consensus on what men and women are supposed to do as adults. Indeed, the chart below shows that stereotypes on gender roles are commonly accepted in Azerbaijan, despite the fact that women tend to hold these views slightly less than men. Thus, there is no difference between genders when it comes to agreeing with the statements that “A women’s most important role is to take care of her home and cook for her family” and “Changing diapers, giving kids a bath and feeding kids are the mother’s responsibility.” Furthermore, although women tend to agree less with the following statements “Men should have the final word about decisions in the home,” “On the whole, men make better political leaders than women do” and “On the whole, men make better business executives than women do,” more than 60% of women still agree with each of these statements.


Note: Answer options to all the above statement were re-coded as follows: “Strongly agree”/“Completely agree” and “Agree”/“Somewhat agree” into “Agree”; and “Strongly disagree”/“Completely disagree” and “Disagree”/“Somewhat disagree” into “Disagree”. 

This blog post explored the attitudes of Azerbaijanis towards gender roles, and whether these have changed over time. It showed that there is a cross-generational continuum in the defined gendered character of the activities children and teenagers have been taught to perform. Furthermore, the blog post described the continuity of the embedded gender roles, noting the fact that as adults, people continued to see men and women as having very distinct roles and responsibilities and that there is a general consensus in Azerbaijan that the outer-home public space is still the domain of men.

To what extent are gender roles embedded in the Azerbaijani, Armenian and Georgian societies? Join the conversation on the CRRC Facebook page or in the comments section below. 


Tuesday, February 04, 2014

Income Levels in Georgia from 2008 to 2013

Following the world financial crisis of 2007-2008 and the global recession of 2008-2009, GDP growth slowed and unemployment increased in many countries. From a peak of 12.34% GDP growth in 2007, Georgia’s GDP contracted by 3.78% in 2009, leveling out to an average of 6.4% GDP growth over 2010 to 2012. Official unemployment in Georgia also worsened over that period, starting at 13.3% in 2007, peaking at 16.9% in 2009 and falling down to 15% by 2012. However, over the same period of time, GDP per capita in Georgia increased from USD 2,920 in 2008 to USD 3,490 in 2012. Household monetary income and ownership of consumer goods, in particular, have noticeably increased since 2008 in Georgia.
Comparing data from CRRC’s Caucasus Barometer (CB) 2008 and 2013, the percentage of Georgian households earning under USD 100 per month has decreased by 10% since 2008, and 15% more households now earn over USD 100 per month. The greatest decrease occurred in the USD 51-100 bracket (down 6%) and the greatest increase occurred in the USD 101-250 bracket (up 10%) indicating that the greatest shift in income occurred from Georgian households crossing the USD 100 per month threshold. Household income is higher in urban than in rural areas in Georgia; 51% of urban households have monthly incomes of under USD 250, but 72% of rural households do.


Household spending is also up. In 2008, 30% of households spent under USD 100 per month and 54% over USD 100. In 2013, only 18% of households spent under USD 100 per month and 72% spent over USD 100 per month, including 37% that spent over USD 251 per month.
Supporting this income and spending data is the increase in household ownership of consumer goods from 2008 to 2013. The most dramatic increases from 2008 to 2013 have been in automatic washing machine ownership (27% to 51%) and cell phone ownership (65% to 89%). Aside from car ownership, urban household ownership of consumer goods is 10-30% higher than that of rural households, depending on the item in question.


Households have also had to limit their consumption of food, utilities and transportation due to budget difficulties less frequently. Electricity is the only item that appears to have remained constant with respect to households’ need to limit their consumption. There is no statistically significant difference between urban and rural households in their limiting of consumption in the mentioned areas.


Some indicators have not shifted significantly since 2008. The frequency of households borrowing money for food or utilities has not changed significantly, and the perceived relative economic condition of Georgians has notably decreased since 2008. Also, considerably more Georgians consider themselves poor or very poor relative to other Georgians than they did in 2008.


Only 19% of Georgians believe that up to USD 400 is the minimal monthly income for a normal life, yet 76% of Georgian households earn under USD 400 monthly. However, 61% of Georgians believe that their children will be financially better off at their age, against only 5% viewing their children as the same or worse off. Georgians consider education (28%), the country’s economic situation (16%), and the ability to work hard (15%) to be the three most important factors that will contribute to their children being better off. For more information on income levels in Georgia please view CRRC’s online data analysis tool.

Monday, August 19, 2013

Material deprivation and quality of life in the South Caucasus

Quality of life and life satisfaction has been a central topic in social science research, as well as an increasingly popular area of interest for many policy makers. Balanced development is especially important in developing societies where political and economic changes can impact social inequality, as well as material wealth and health. This post uses data from the Caucasus Barometer (CB) 2012, as well as the Life in Transition (LIT) 2010 survey (carried out jointly by the European Bank for Reconstruction and Development and the World Bank) to explore issues detrimental to the general quality of life in the South Caucasus region. These issues include the material situation of households (as reflected in the consumption of goods and services), and its impact on health-related indicators and general life satisfaction across the region.

According to the 2010 LIT survey, the average amount of monthly savings was 1628 dram ($4) in Armenia, 7 manat ($9) in Azerbaijan and 10 lari ($6) in Georgia. However, the standard deviation from the mean was high for all 3 countries, which means there were substantial differences between the amounts of money saved by different individuals. This is also reflected in relatively high values of the GINI coefficient for income in these countries. The coefficient measures inequality in income distribution within a population. Across the region the values of the GINI index were 31.3 for Armenia (2010), 33.7 for Azerbaijan (2008) and 42.1 for Georgia (2012), as reported by the World Bank.

Unequal income distribution and material deprivation are also apparent in differences in food consumption across all households included in the CB 2012. The survey asked about which of the following products households limits due to financial reasons: bread and pasta, butter and milk, poultry, beef, pork, fish, fruit and vegetables, potatoes, sweets and chocolates. From this list, 80% of households in Armenia, 66% in Azerbaijan and 74% in Georgia cut down on the consumption of at least one type of food products due to financial constraints.


In terms of the purchases of goods and services such as electricity and gas, slightly more than half of Armenians (55% and 58%, respectively) and Georgians (52% and 55%, respectively) limit their consumption of these items due to financial reasons. Azerbaijanis seem slightly less likely to do so with 49% cutting down on electricity or gas use, yet the difference between the values reported for Azerbaijan and Georgia is within the margin of 3% error. 

Material deprivation, both in the case of limited food consumption or utilities (electricity, gas) is significantly higher in the rural areas. These differences are highest in Armenia and lowest in Azerbaijan, where the difference between material deprivation in the capital and other urban areas is non-significant. 

Living conditions, including material difficulties, can have a substantial impact on overall life satisfaction. An examination of the effect of food limitations on life satisfaction, while controlling for type of settlement (urban, rural and capital), gender, and age shows that across all three countries the necessity to cut down on food consumption has a significant negative impact on the general quality of life. Multivariate regression analysis shows that a cut in each additional food item results in a significant drop in the average life satisfaction level. No cutback on food is used as a reference category in the model, while the other options included 1 to 9 indicating the food items. Gender is not found to affect the level of life satisfaction in any of the countries. Settlement type has an impact in Armenia and Azerbaijan where people living in the capitals declare, on average, significantly higher levels of life satisfaction than in the countryside.


Life satisfaction is not the only variable strongly related to material conditions. Depending on the economic situation of the household (e.g. those that need to limit food consumption, or other expenditures), the subjective assessment of individual health varies. People from poor households are significantly more likely to consider themselves to be in very poor or poor health. Causality is not established here though as poor health might be both the result as well as the reason for material deprivation.


The relationship between health and material deprivation is not a surprise and it has been well-researched in the social science. However, it deserves strong emphasis, taking into account the high number of households that needs to restrict their food and utilities consumption in the South Caucasus.

Monitoring changes in the material situation of households is thus of major importance. Analysis of a LIT 2010 question “My household lives better nowadays than around 4 years ago” shows substantial regional differences in this respect. According to the subjective individual assessment, the quality of life in Armenia and Georgia seems to have deteriorated rather than improved compared to around 4 year ago, whereas in Azerbaijan the assessment of the change in the household situation was more positive. 


As the most recent LIT data come from 2010, the situation and standards of living in Armenian, Azerbaijani and Georgian households might currently be different. Yet, as the CB 2012 shows, most households still face material problems that force them to limit consumption of basic products such as food. Since there is a significant positive relationship between the financial situation of a household and individual health and wellbeing, all of these factors require special attention and long-term monitoring in the region.

For more information on the current social and economic situation in the South Caucasus see our online database


Thursday, May 27, 2010

Levels of trust in the banks in Georgia: Changes over the past two years

Banking is one of the fastest-growing sectors of the Georgian economy, a point which was underlined in a 2009 report from the Ministry of Economic Development of Georgia. But does this development mean that society views banks as trustworthy partners for households (HH) in Georgia?

In fact, from 2008 to 2009, the overall level of trust in banks has decreased in Georgia, especially for the HHs who say they have savings and for those who say they have debts. This could in part be due to the global financial crisis which, according to the European Bank for Reconstruction and Development’s (EBRD) 2010 country strategy report, significantly affected the Georgian economy. The crisis revealed the financial sector’s weaknesses around the world and led to widespread doubt concerning the reliability of banks.

Households & Savings

For the small number of HHs who say they have savings (9 percent in 2008, 6 percent in 2009), the level of trust in banks has significantly decreased. According to the 2008 Caucasus Barometer (CB, previously referred to as the “Data Initiative”), combining the “fully trust” and “somewhat trust” categories shows that 60 percent of HHs with savings said they trusted banks. In 2009, however, this figure fell to 49 percent. As a place to put one’s money and keep it safe, apparently, fewer people view banks in a positive light.

Even for HHs without savings – the majority of the respondents – the level of trust in banks has fallen: in 2008, 53 percent of them had said that they trusted banks, whereas only 42 percent said the same in 2009 (see Figure 1). At the same time, the number of those saying specifically they distrust banks remained the same, hinting at a high degree of uncertainty with regard to banks among the population.


Households & Debts

The level of trust in banks among HHs who reported that they have debts saw an even larger drop. Although these could be debts either to banks or to private persons, without interest, this drop could be linked to the fact that it has become increasingly difficult for HHs to take out loans to help alleviate any debts they have. Overall, 43 percent (2008) and 42 percent (2009) of the HHs claimed to be indebted. Of these HHs, 59 percent said that they trusted banks in 2008, though only 45 percent claimed the same in 2009.

On the other hand, the level of trust remained broadly similar in those HHs who say they do not have debts. Forty-nine percent of them had said that they trusted banks in 2008, while 42 percent said the same in 2009.


Conclusion

The 2008 Caucasus Barometer was carried out from the second half of October to the middle of November, and these figures offer a snapshot of how the global financial crisis may have taken its toll on HHs’ trust in banks in Georgia. Still, there are certainly other factors which play a role, and further research and commentary are needed. We invite you to access the 2008 CB dataset to make your own comparisons here.

Tuesday, May 18, 2010

Caucasus Barometer | A New Name for the CRRC's Data Initiative

The CRRC’s annual Data Initiative Survey will be renamed into the Caucasus Barometer starting from 2010. At CRRC, we think that the new name better reflects the essence of the survey and is more understandable for the general public and the journalists.

The Data Initiative was first launched in 2004. Since 2007, a representative sample of approximately 2,000 respondents is interviewed annually in each of the counties. They answer core questions about household composition, social and economic situation of households, employment status, assessments of social and political situation in the countries, as well as respondents’ perceptions about direction of life. In addition, we include questions about media, health, crime, and other topical issues.

The change of the name, however, will not cause any changes in the way the survey is carried out – it is still an annual survey conducted every fall in all countries of the South Caucasus, employing the same methodology and the same survey instrument. Its major goal is to get reliable longitudinal empirical data to understand various aspects of the processes of social transformation in Armenia, Azerbaijan, and Georgia. We are committed to ensure the highest possible scientific quality through all the steps of survey implementation.

The data and the survey documentation are open to all interested researchers and represent a unique tool for further quantitative analysis. You can find more information about the Data Initiative/Caucasus Barometer on our website.

Thursday, January 14, 2010

Insight to Georgian Households | CRRC Data on Economic Wellbeing in the Caucasus

How are Georgians doing financially, how much do they earn and what do they spend on? CRRC’s Data Initiative allows for an in-depth analysis of these and similar issues on the economic status of the population across the South Caucasus.

We again (see our recent piece on social developments here) published something in Investor.ge, the journal published by the American Chamber of Commerce -- and a great resource for tracking business and economic developments.

In this article, Arpine and Nana discuss how much Georgians earn, what they spend money on, how they borrow, and how they see their financial future. Read the article on economic well-being of Georgian households here.

Friday, February 01, 2008

Alpha Version of CRRC Data Initiative now online!!!

The alpha version of our Data Initiative data set, broad household data, covering lots of household data, but also political attitudes, social development, some health, education, migration, and social capital questions (and more) is online now. We interviewed more than 8000 people, so this really is the single largest dataset that is available on developments across the South Caucasus.

Register here to receive access to the dataset. In case you don't receive the confirmation email, let us know. (You typically should be able to log in with your email-address and password even without getting that confirmation email, though.)

You need SPSS to process it (trial versions of SPSS that last for 14 days can be downloaded here; a hefty 202 MB, though), and if you want to find out how to use SPSS, we offer a quick crude crash course on our website.

More updates on the dataset soon. And let us know what you find!!!