[Note: This article originally appeared on Eurasianet. It was written by Dustin Gilbreath, a Policy Analyst at CRRC-Georgia. The views expressed within the article do not necessarily reflect the views of CRRC-Georgia or any related entity.]
Georgia’s economy appeared to take a step backward earlier this summer when the World Bank demoted the country to “lower-middle-income” status. The demotion, however, has more to do with statistical hiccups than it does with a substantial decline in economic activity.
In 2016, Georgian officials cheered when the World Bank promoted the country into the ranks of “upper-middle-income” states. It was big news in Tbilisi, the capital. But in July, officials didn’t have much to say when the country slipped back into the “lower-middle-income” ranks.
To understand the up-and-down tale of Georgia’s economic status, one needs to know how the World Bank classifies countries into income groups, a bit about Georgia’s 2002 and 2014 censuses, Georgia’s fluctuating exchange rate, and what country classifications are used for in practice.
To start, the World Bank measures economic status primarily by relying on gross national income (GNI) per capita, which is composed of GDP, as well as incomes flowing to the country from abroad, including interest and dividends. To make these calculations, the Bank uses something called the Atlas method, which accounts for fluctuations in the exchange rate using a three-year, inflation-adjusted average of rates.
Thresholds for each income group change slightly every year based on inflation. In the most recent year, countries with less than $1,005 in GNI per capita were designated low-income countries; those with GNIs from $1,006 to $3,955 fell into the lower- middle-income group; $3,956 to $12,235 were upper middle income; and those with $12,236 and above attained high-income status.
Georgia isn’t the only post-Soviet country to experience a downgrade in recent years due to exchange-rate woes and other factors. Russia, for example, moved down to upper-middle-income status in 2016 after three years in the high-income group. Meanwhile, Azerbaijan, which is grappling with a severe downturn due to the global drop in energy prices, is at risk of demotion to lower-middle-income status next year. And Kyrgyzstan and Tajikistan appear poised to slip back into the lower-income category.
GNI per capita is a population-based measure. That means that as the number of people decreases, the figure increases. For this reason, the 2014 census made Georgia an upper-middle income country. This fact stems from Georgia’s population size between 2002 and 2014 being estimated using the 2002 census. In 2002, the Georgian government carried out its first census since the last Soviet census in 1989. The census’s final population count is believed to have heavily overestimated the population at about 4.4 million citizens. Between censuses, the population data is updated using birth and death registries. These too had problems, showing that Georgia’s population was growing steadily.
In contrast to the 2002 census, the 2014 census was more rigorous. It showed a 17% smaller population figure than the Georgian National Statistics Office had estimated for 2014. This meant that the per capita figures for GNI jumped, pushing Georgia into upper-middle income status. Notably, estimates of GNI per capita which use more realistic population figures for the years between 2002 and 2014 suggest that Georgia had likely crossed the upper-middle income threshold in 2013.
Even though the Atlas method takes into account fluctuations in exchange rate, GNI per capita is ultimately denominated in dollars for the World Bank’s calculations. In Georgia’s case, the Lari has dropped from around GEL 1.7 to the dollar in early 2014 to about GEL 2.4 to the dollar at the time of this writing. The value of the Lari was even lower for a time. In practice this has decreased Georgia’s GNI per capita figures to the point of knocking the country into a different income category.
Against the backdrop of population estimate revisions and fluctuating exchange rates, Georgia’s economy has been growing, albeit very slowly for a developing country in recent years. Georgia’s economy grew at an average rate of about 5.9 percent from 1995-2013; since 2014, it has grown at an average rate of 3.4 percent
The exchange rate fluctuation is hampering growth prospects. For one, rate volatility makes it harder for businesses to predict costs. In addition, many Georgians have dollar-denominated loans, while their incomes are in Georgian Lari. Although nominal salaries have slightly outpaced inflation, they have not kept pace with the decline in the Georgian currency’s value. Hence, debt payments consume a rising share of income for those trying to pay off dollar-denominated loans. The Georgian Government and National Bank are addressing this situation via a program that subsidizes the conversion of foreign-currency loans into Georgian Lari at a favorable rate.
While Georgia’s income group status has more to do with how the statistic is calculated than the actual state of Georgia’s economy, the changes have had clear implications. For instance, the Global Fund - an organization that has provided over USD 100 million to Georgia over the years to combat tuberculosis and AIDS - has different rules on aid for lower-middle-income and upper-middle-income countries. Meanwhile, a Brookings Institution study suggests that upper-middle income countries receive aid more often in the form of credits (i.e. loans) than grants when compared with lower middle income countries.
Some development organizations explicitly change lending terms when a country moves from lower middle to upper middle income status, although the World Bank itself does not. Hence, Georgia’s downgrading may have a silver lining, potentially leading to more aid opportunities.
But downgrading also has significant downsides. In political terms, it’s not good news for incumbents because it fosters an appearance among the population that the country is moving backwards. It also can impact the decisions of potential foreign investors. The demotion in status is unlikely to make Georgia a more attractive investment destination.
Monday, August 21, 2017
Statistical Hiccups Cause Georgia to Become Lower-Middle Income Country
Monday, July 04, 2016
How Georgia became an upper-middle income country
A year ago, on this blog, we took a look at how Georgia had likely become an upper-middle income country because of the 2014 census. On July 1st, the World Bank announced that Georgia had indeed changed income categories, moving from lower-middle income to upper-middle income. Given the change, we thought it would be worth re-posting the blog post from last year discussing how Georgia became an upper-middle income country:
The 2002 census was way off
In 2002, the Georgian government carried out a population census and found that there were 4.37 million Georgians. This number though was and is widely considered to be suspect. According to the 2014 UNPF report (and notably, Geostat employees at the time), the main problem with the 2002 census was its method of counting the migrant population. Specifically, the 2002 population count included 114,000 migrants who may have been permanently settled abroad rather than temporarily. This number may have been even higher considering that an estimated one million Georgians left the country between 1990 and 2002. Their family members who were interviewed for the census may have been reluctant to report that their relatives had gone abroad and instead reported them as temporary migrants or still in the country for a variety of reasons.
Not only was the census off, but so too were the civil registries which count birth and death registration. Between censuses, governments update population counts based on birth and death registrations, but because many births in Georgia happened and to a certain extent still happen outside of hospitals, births are not always registered. Also important are the lack of death registrations.
Recognizing these problems, Giorgi Tsuladze, a Professor at Ilia State University, made a downward adjustment of the population figure from the 2002 census, an upward adjustment to the birth rate, and a decrease in the estimate of the average life expectancy to estimate the population. In turn, his estimates of the population are quite close to what the preliminary 2014 census results tell us about the Georgian population – there are about 3.7 million people in Georgia (excluding South Ossetia and Abkhazia).
| Geostat population estimate (thou.) | Tsuladze population estimate (thou.) | |
| 2002 | 4,372 | 4,001 |
| 2003 | 4,343 | 3,966 |
| 2004 | 4,315 | 3,931 |
| 2005 | 4,322 | 3,899 |
| 2006 | 4,401 | 3,869 |
| 2007 | 4,395 | 3,839 |
| 2008 | 4,382 | 3,814 |
| 2009 | 4.385 | 3,797 |
| 2010 | 4,436 | 3,790 |
| 2011 | 4.469 | 3,786 |
| 2012 | 4,498 | 3,777 |
| 2013 | 4,484 | 3,768 |
Source: Tsuladze, G.; N. Maglaperidze and A. Vadachkoria. 2002. Demographic Overview of Georgia. Tbilisi, UNFPA. Cited in
Hakkert, Ralph, Gulnara Kadyrkulova, Nata Avaliani, Eduard Jongstra, Lasha Labadze, Maka Chitanava, and Nino Doghonadze. Population Situation Analysis (PSA) 2014. Rep. Tbilisi: United Nations Population Fund, 2015. Print.
Income classifications
The second important part of this story is understanding how countries are classified into income groups. The World Bank classifies countries by Gross National Income per capita (slightly different than Gross Domestic Product per capita – see here for exact definitions).
Countries with a per capita GNI of less than $1,045 are considered low income countries. Countries with greater than $1045, but less than $4,125 GNI/capita are classified as lower-middle income countries. Countries below $12,736 but above $4,125 GNI/capita are considered upper middle income countries, and countries above the $12,736 mark are considered to be upper income countries.
Since, a country’s income classification is based on the size of its population, and as we saw above, Georgia’s official population size was inflated by a fairly sizable margin for the past twelve years, Georgia’s GNI per capita (as well as GDP per capita) was underestimated.
Georgia probably moved from the lower-middle income to the upper-middle income grouping in 2013 when GNI per capita moved from from $3914 in 2012 to $4240 in 2013 (based on Tsuladze’s population estimates). In 2014, using the preliminary census data, Georgia’s GNI was $4489/capita. Hence Georgia has very likely moved income groups, barring a major miscount of the preliminary census data of roughly 330,000 people.

Why does this matter?
Well, it is good and bad news for Georgia.
To start with the bad, aid is sometimes distributed based on a country’s economic status. There are many other important factors at play (see here for a discussion of the subject), but nonetheless it is often considered in aid decisions. Hence, Georgia may expect lower levels of aid in the coming years as its per capita economic statistics are adjusted upward following the finalization of the 2014 census in 2016.
When it comes to the good news for the country, Georgians are doing better than the numbers suggested. This does not change the facts on the ground and widespread poverty experienced in Georgia, but in the long run it can lead to a number of benefits. For instance, foreign private capital flows may increase as the country may be perceived as a more enticing investment environment, having moved to a higher income category.
The upward adjustment will also be important for Georgia’s Euro-Atlantic integration prospects. One of the key factors which the EU has identified as a barrier to prospective membership for countries in its neighborhood is low income levels, and as Georgia’s income level gradually increases, it will make Georgia a more attractive partner country. Notably, the lower population also means that per capita income is increasing at a higher rate than previously thought. In the short term, it may also help ease fears over migrant flight from Georgia (which is likely an inhibiting factor at present for Georgia in the EU visa liberalization process). It is important to note that if income inequality persists in Georgia, economic growth is unlikely to deter migrants from attempting to make their way to the EU, though a fuller treatment of this subject is beyond the scope of this post.
On the grand scheme of things, the adjustment is good as well. While not necessarily good for Georgia, countries in more dire straits may receive more aid that would have been aimed at Georgia. Better decisions about what kind of aid the country receives may also result from the more accurate data and income categorization.
Although we should not expect to see the official income categorization change to upper-middle until after Geostat has published the final census numbers and adjusted its population estimates for 2002-2014, it should occur in the next few years.
To take a look through the preliminary 2014 census results, take a look here, and for the estimates of the population size which this blog is based on as well as other interesting data and analysis on Georgia’s demographic situation, take a look at the UNPF/ISET report, here. Notably, Georgia is not the first and surely not the last country to have a major economic indicator readjustment based on something besides economic growth. Ghana and Nigeria both have had large changes to their economic indicators in recent years caused by how GDP was calculated rather than growth with interesting implications. Listen to this Planet Money story to find out more.
Monday, March 21, 2016

Monday, February 15, 2016
Dwellings in Georgia's cities

According to the World Bank, Georgia has become more urbanized since the collapse of the Soviet Union. The shift from a planned to a market economy was accompanied by increasing regional disparities, and more people moved to large urban centers looking for economic opportunities and better living conditions. As a result, more than half of the country’s population (57.5%) currently lives in urban settlements, according to the 2014 census. Based on the STEP Skills Measurement Survey conducted in March and April 2013 in urban settlements in Georgia by CRRC-Georgia on behalf of the World Bank, this blog post looks at the type of dwellings where the urban population lives, including data on the number of rooms per dwelling, type of floor covers and toilets, as well as the ownership status of these dwellings at the time of the survey. The survey data was released in 2015 and, for the time being, is the most recent data available.
The majority of Georgia’s urban population (78% of the population of Tbilisi and 53% of the population of other towns and cities) lives in apartments in large apartment blocks with more than ten apartments. Only 14% of Tbilisi residents live in single family houses compared with 41% of residents of other urban settlements.

About one third of residents of urban settlements live in three-room dwellings. One- and two-room dwellings are more common in the capital, while five-room or larger dwellings are more common in the non-capital urban settlements.

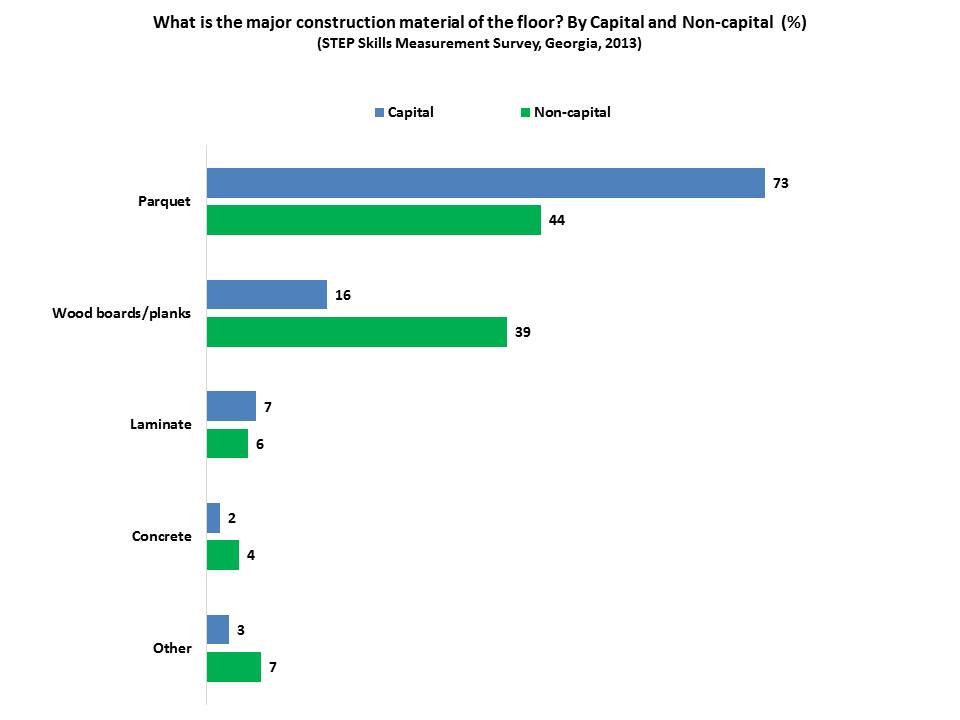
Parquet floors are the most common flooring material in Tbilisi, where 73% of floors are made from parquet. The respective share in other urban settlements is 44%. The next most common flooring material is wood boards used in 16% of dwellings in Tbilisi and 39% in other urban settlements.
As the survey was only conducted in urban settlements, it is not surprising that most of the dwellings have flush toilets connected to a piped sewer system (97% in Tbilisi and 79% in other urban settlements). Still, there are dwellings that have pit latrines with slab (2% in Tbilisi and 11% in other urban settlements).

Thus, most urban Georgians reside in apartments in large apartment blocks. About a third of the urban population lives in dwellings that have two or three rooms. Most people own the dwellings they live in. Notably, there are still homes in the cities that do not have toilets connected to the sewage system.
To explore this topic more, have a look at the data, here.
Monday, August 17, 2015
An interesting implication of the 2014 census: Georgia is likely an upper middle income country
While Georgia has yet to be officially declared an upper middle income country by the World Bank, as a result of the 2014 census, it’s likely to be labeled one after the final census results are published in April of 2016. Interestingly, Georgia likely became one in 2013. Why is this the case and what are the implications? Let’s take a look using the 2014 preliminary census data and a population model developed by Ilia State University’s Giorgi Tsuladze published in a 2014 United Nations Population Fund (UNPF) and International School of Economics at Tbilisi State University (ISET) report.
The 2002 census was way off
In 2002, the Georgian government carried out a population census and found that there were 4.37 million Georgians. This number though was and is widely considered to be suspect. According to the 2014 UNPF report (and notably, Geostat employees at the time), the main problem with the 2002 census was its method of counting the migrant population. Specifically, the 2002 population count included 114,000 migrants who may have been permanently settled abroad rather than temporarily. This number may have been even higher considering that an estimated one million Georgians left the country between 1990 and 2002. Their family members who were interviewed for the census may have been reluctant to report that their relatives had gone abroad and instead reported them as temporary migrants or still in the country for a variety of reasons.
Not only was the census off, but so too were the civil registries which count birth and death registration. Between censuses, governments update population counts based on birth and death registrations, but because many births in Georgia happened and to a certain extent still happen outside of hospitals, births are not always registered. Also important are the lack of death registrations.
Recognizing these problems, Giorgi Tsuladze, a Professor at Ilia State University, made a downward adjustment of the population figure from the 2002 census, an upward adjustment to the birth rate, and a decrease in the estimate of the average life expectancy to estimate the population. In turn, his estimates of the population are quite close to what the preliminary 2014 census results tell us about the Georgian population – there are about 3.7 million people in Georgia (excluding South Ossetia and Abkhazia).
| Geostat population estimate (thou.) | Tsuladze population estimate (thou.) | |
| 2002 | 4,372 | 4,001 |
| 2003 | 4,343 | 3,966 |
| 2004 | 4,315 | 3,931 |
| 2005 | 4,322 | 3,899 |
| 2006 | 4,401 | 3,869 |
| 2007 | 4,395 | 3,839 |
| 2008 | 4,382 | 3,814 |
| 2009 | 4.385 | 3,797 |
| 2010 | 4,436 | 3,790 |
| 2011 | 4.469 | 3,786 |
| 2012 | 4,498 | 3,777 |
| 2013 | 4,484 | 3,768 |
Source: Tsuladze, G.; N. Maglaperidze and A. Vadachkoria. 2002. Demographic Overview of Georgia. Tbilisi, UNFPA. Cited in
Hakkert, Ralph, Gulnara Kadyrkulova, Nata Avaliani, Eduard Jongstra, Lasha Labadze, Maka Chitanava, and Nino Doghonadze. Population Situation Analysis (PSA) 2014. Rep. Tbilisi: United Nations Population Fund, 2015. Print.
Income classifications
The second important part of this story is understanding how countries are classified into income groups. The World Bank classifies countries by Gross National Income per capita (slightly different than Gross Domestic Product per capita – see here for exact definitions).
Countries with a per capita GNI of less than $1,045 are considered low income countries. Countries with greater than $1045, but less than $4,125 GNI/capita are classified as lower-middle income countries. Countries below $12,736 but above $4,125 GNI/capita are considered upper middle income countries, and countries above the $12,736 mark are considered to be upper income countries.
Since, a country’s income classification is based on the size of its population, and as we saw above, Georgia’s official population size was inflated by a fairly sizable margin for the past twelve years, Georgia’s GNI per capita (as well as GDP per capita) was underestimated.
Georgia probably moved from the lower-middle income to the upper-middle income grouping in 2013 when GNI per capita moved from from $3914 in 2012 to $4240 in 2013 (based on Tsuladze’s population estimates). In 2014, using the preliminary census data, Georgia’s GNI was $4489/capita. Hence Georgia has very likely moved income groups, barring a major miscount of the preliminary census data of roughly 330,000 people.
Why does this matter?
Well, it is good and bad news for Georgia.
To start with the bad, aid is sometimes distributed based on a country’s economic status. There are many other important factors at play (see here for a discussion of the subject), but nonetheless it is often considered in aid decisions. Hence, Georgia may expect lower levels of aid in the coming years as its per capita economic statistics are adjusted upward following the finalization of the 2014 census in 2016.
When it comes to the good news for the country, Georgians are doing better than the numbers suggested. This does not change the facts on the ground and widespread poverty experienced in Georgia, but in the long run it can lead to a number of benefits. For instance, foreign private capital flows may increase as the country may be perceived as a more enticing investment environment, having moved to a higher income category.
The upward adjustment will also be important for Georgia’s Euro-Atlantic integration prospects. One of the key factors which the EU has identified as a barrier to prospective membership for countries in its neighborhood is low income levels, and as Georgia’s income level gradually increases, it will make Georgia a more attractive partner country. Notably, the lower population also means that per capita income is increasing at a higher rate than previously thought. In the short term, it may also help ease fears over migrant flight from Georgia (which is likely an inhibiting factor at present for Georgia in the EU visa liberalization process). It is important to note that if income inequality persists in Georgia, economic growth is unlikely to deter migrants from attempting to make their way to the EU, though a fuller treatment of this subject is beyond the scope of this post.
On the grand scheme of things, the adjustment is good as well. While not necessarily good for Georgia, countries in more dire straits may receive more aid that would have been aimed at Georgia. Better decisions about what kind of aid the country receives may also result from the more accurate data and income categorization.
Although we should not expect to see the official income categorization change to upper-middle until after Geostat has published the final census numbers and adjusted its population estimates for 2002-2014, it should occur in the next few years.
To take a look through the preliminary 2014 census results, take a look here, and for the estimates of the population size which this blog is based on as well as other interesting data and analysis on Georgia’s demographic situation, take a look at the UNPF/ISET report, here. Notably, Georgia is not the first and surely not the last country to have a major economic indicator readjustment based on something besides economic growth. Ghana and Nigeria both have had large changes to their economic indicators in recent years caused by how GDP was calculated rather than growth with interesting implications. Listen to this Planet Money story to find out more.
Monday, July 27, 2015
Finding work in Armenia and Georgia
With official unemployment rates in 2014 running at 17.6% and 12.4% in Armenia and Georgia respectively, a World Bank analysis in both countries suggests that the labor markets of these countries suffer from a skills shortage. The World Bank’s STEP Skills Measurement Program gathers information on the supply and distribution of people’s skills, and the demand for these skills in low-income countries’ labor markets, interviewing a representative sample of adults aged 15 to 64 living in urban areas. This blog post looks at the World Bank’s STEP data for Armenia and Georgia, which CRRC collected in 2013, to see how people are finding work, their confidence that they have the skills needed to find work, and how they feel their education prepares them for work.
Interestingly, in both countries, a plurality of employed people reported relying on their social networks (friends/relatives/other) to find a job (37% in Armenia and 45% in Georgia). Also reflecting the informal nature of the job market in both countries, the next most common method was to contact the employer directly: 26% in Armenia and 18% in Georgia.

Note: The chart presents only answers of those who reported they had worked in the previous 7 days and shows the percentage of those reporting having used a given method.
Both employed and unemployed were asked whether they thought they possessed various qualities or knowledge that would help them when looking for work. People appear to be very confident in respect to certain skills – for example, 92% of Armenians and 81% of Georgians thought they would perform well in a job interview. However, the share of those who felt they had the necessary work experience was much lower – 60% Armenians and 58% Georgians thought so. In both countries, few believed they had the means to start their own business: 7% in Armenia and 13% in Georgia.

Note: The chart shows only the percentage of those reporting having a given skill or resource.
A very important issue the World Bank reported about for both Armenia and Georgia was the high level of unemployment in these countries despite a (formally) highly educated workforce. Indeed, in both countries, around half of those who have a bachelor’s degree had not worked. The World Bank report for Georgia concludes that the highly educated population does “not have the skills needed in the labor market … many Georgian employers complain that hiring workers with the required skills is difficult.” Similarly, for Armenia, the WB notes that “despite the high availability of labor and these high educational levels, Armenia’s employers are struggling to find the right workers, which seems to point to a problem of skills in the labor force.”

Note: The chart only shows the answers of those that answered ‘No’ to the question “During the past 7 days, did you work for at least an hour for wage or salary in cash or in kind OR work on your own account for profit or family gain OR work in a family business or on a farm?”
Only around half of those who had worked in the week preceding the survey (42% in Armenia and 37% in Georgia) think their formal studies were “very useful” for their job. The rest, however, are not so sure about this.

Note: The chart only shows the answers of those that answered ‘Yes’ to the question “During the past 7 days, did you work for at least an hour for wage or salary in cash or in kind OR work on your own account for profit or family gain OR work in a family business or on a farm?”
Further analysis of the World Bank data could help to uncover whether this is because people’s skills are being underutilized – for example, by having to take jobs that are at a lower skill level than they are qualified for – or if they believe their education does not provide job-relevant skills. Potentially, there could have been other reasons as well.
The full STEP survey datasets for Armenia and Georgia are available from the World Bank website.
Monday, December 22, 2014
Does public opinion accurately gauge government performance in the South Caucasus?
Robert Putnam’s 1993 work Making Democracy Work: Civic Traditions in Modern Italy marked a seminal moment in the development of institutionalism. Putnam’s exhaustive study of the relationship between the governed and governing in the Italian regions contained the discovery that public opinion provides an accurate picture of actual government performance: “The Italians’ gradually increasing satisfaction with the regional governments … corresponded to real differences in performance,” and in each region Putnam’s measurement of performance was “remarkably consistent with the appraisals offered by the regional attentive public and by the electorate as a whole.” While Italy was the focus of his study, Putnam’s findings can be applied broadly as he draws identical conclusions across regions with disparate social, economic, and historical conditions. Can his insight on the relationship between public opinion and government performance be transposed onto any or all of the countries of the South Caucasus?
The three states comprising the South Caucasus – Armenia, Azerbaijan and Georgia – are characterized by varying degrees of governmental effectiveness. Public opinion data from the CRRC Caucasus Barometer survey (CB) also shows differing levels of trust toward government in each country. This blog post asks the following question: does public trust in government institutions in the South Caucasus countries reflect the actual performance of government? Drawing on CB data as well as the Government Effectiveness dimension of the World Bank’s Worldwide Governance Indicators project (WGI), this blog post finds an apparent mismatch between levels of public trust in state institutions and measures of actual performance.
The populaces of the three South Caucasus states demonstrate divergent attitudes toward the institutions that make up government. Azerbaijanis report more positive views of government, reporting relatively high levels of trust in the Parliament, President, and Prime Minster and ministers. Georgians are less trusting of the Parliament, Prime Minster and ministers, but demonstrate more trust in the courts, the ombudsman and political parties. While it is not possible to say with certainty whether the average Georgian or Azerbaijani has more trust in government institutions overall, it does seem apparent that Armenians demonstrate the least trust. In 2013 residents of Armenia indicated the highest levels of distrust on almost every relevant CB question. The only incidence in which Armenians demonstrated levels of trust slightly higher than a neighboring country was when asked how much they trust or distrust their country’s local government. 35% of Armenians indicated trust, compared to 28% of Georgians.
 |
| Note: This graph only displays the percentage of people who reported distrust in the respective institution. The original question asked, “Please tell me how much do you trust or distrust … [institution]?” Values were re-coded from a 10-point scale used in the questionnaire to the three-point scale used in this text, with original values 1-4 corresponding with the response “distrust” (shown here), 5-6 being “neutral,” and 7-10 corresponding with “trust.” While the graph displays data from 2013 only, this blog post drew on data from 2008 onward. |
In attempting to answer the central research question, this blog post investigates whether the greater propensity to trust state institutions appears alongside higher WGI scores for government effectiveness in each country. While a comprehensive model of governmental effectiveness is the task of a deeper, more comprehensive analysis, this blog post relies on the Government Effectiveness aggregate of the WGI. This metric is intended to measure “the quality of public services, the quality of the civil service and the degree of its independence from political pressures, the quality of policy formulation and implementation, and the credibility of the government’s commitment to such policies.” The indicator is aggregated from 15 individual indicators of governmental effectiveness including the World Bank Country Policy and Institutional Assessment, Economist Intelligence Unit, Bertelsmann Transformation Index and Gallup World Poll.
Provided that the findings of the index paint an accurate picture of the subject at hand, it brings up mixed results with regards to Putnam’s aforementioned conclusion. In each year 2006-2013 Georgia’s score bested those of the other two countries in question, thus the relatively high levels of trust observed in Georgia appear alongside regionally impressive scores for governmental effectiveness. As for Azerbaijan, it scored the lowest of the three South Caucasus states in every year in which scores were awarded. In 2008, the year corresponding to Azerbaijan’s lowest score on the WGI, 87% of Azerbaijanis reported trust in the President and 52% in the Parliament, both measures being higher than those found in Georgia and Armenia (the first being much higher), even though Azerbaijan received a WGI score of less than half of either of its neighbors. Thus it does not appear that public opinion accurately reflects reality in the case of Azerbaijan.
 |
| Note: These scores represent percentile rankings. Not all of the 15 indicators used in the Government Effectiveness metric are available from each country in every year. For example, in 2013 a total of 11 indicators were used to compile Armenia’s score, compared to 10 for Georgia and 9 for Azerbaijan. |
When observing the case of Armenia, viewing CB findings in relation to the WGI index indicates possible dissonance between public opinion and governmental effectiveness. While Armenia scored slightly lower than Georgia on the WGI each year from 2006 and 2013, CB results show that Armenians’ reported trust in government institutions has been much lower than that in Georgia. This could indicate that Armenians are overly pessimistic about the performance of their government, that Georgians are overly optimistic, or a combination of both. In each case, a possible explanation is that Georgia’s scores on the WGI have almost invariably trended upward, starting at a trough of 39.5 in 2005 before peaking at 69.9 in 2012. Armenia, on the other hand, has seen only modest and uneven gains, with public trust in Parliament, the President and the executive government each declining over the same period. Georgian optimism may stem from the appearance of progress, while Armenian pessimism could be the product of a general malaise in the performance of government.
On the whole, it appears that Putnam’s observation cannot be applied neatly to the three states of the South Caucasus. The Azerbaijani public demonstrated the highest levels of trust in almost every governmental institution listed on the CB, even as the country received the lowest scores on the WGI. Georgia scored the highest of the South Caucasus states on the WGI, while public trust in government appeared to be generally lower than in Azerbaijan. Trust in Georgia was significantly higher than in Armenia despite scores on the WGI being only slightly higher. Thus, viewing Georgia and Armenia in relation to one another also appears to uncover a mismatch between perception and reality.
To gain more information on public opinion in Armenia, Azerbaijan and Georgia, please visit the CRRC regional website or refer to the CRRC’s online data analysis tool.
Thursday, May 16, 2013
Education in Azerbaijan: A Snapshot


Contributed by Vitaly Radsky from the Center for Innovations in Education Policy Unit, and former CRRC International Fellow
Tuesday, March 05, 2013
Visa Liberalization Prospects in Georgia – the Way Open for Temporary Emigrants?


Thursday, January 24, 2013
Georgia’s Workforce Development Study
By Ana Diakonidze
In August 2012 CRRC launched the study of Georgia’s Workforce Development system, commissioned by the World Bank. Document review and key informant interviews have been used as main research methods in this study. On 19th of December, the World Bank office in Tbilisi hosted a workshop which aimed at presenting and validating the preliminary findings of the study. The workshop was attended by government representatives, training providers, industry and international donor community.

Currently, the study report is being finalized. It will outline and explain reasoning behind assigning particular scores to each dimension assessed during the study. The scores are assigned to each policy goal and determine the level of development of the system. According to SABER there are four levels of workforce system development: latent, emerging, established and advanced. The scores help to identify where a particular country stands on this continuum. The figure above explains the four different levels of WfD for policy in terms of policy goal 1. The end goal of this exercise is to support Georgian policy makers in their search for promising options and approaches to achieve better results in WfD.
Tuesday, October 05, 2010
Armenia’s ranking in the World Governance Indicators


Friday, September 12, 2008
Doing business in Azerbaijan: easy in theory
According to the report, Azerbaijan made the biggest progress in reforming business regulations among all surveyed countries and rose from last year’s 96th place to the 33rd in 2008. Azerbaijan came ahead of most CIS countries, excluding Georgia with its 15th rank in the report.
The Bank ranks countries according to the following 10 sets of indicators: starting a business, dealing with construction permits, employing workers, registering property, getting credit, protecting investors, paying taxes, trading across borders, enforcing contracts, and closing a business.
Local experts do not agree with the overly optimistic results of the report. Just yesterday the Entrepreneurship Development Foundation, a local NGO, presented results of a survey conducted among businessmen in Baku and regions in May-July 2008. According to the survey, that included 41 questions on entrepreneurship, about 52% of small entrepreneurs in Azerbaijan consider it impossible to conduct business without violating laws and regulations. Sabit Bagirov, the chairman of the Foundation, added that the fear of being persecuted led to a quite high non-response rate.
Tuesday, November 27, 2007
Labor Dynamics in Armenia | Youth Unemployment
In May 2007, the World Bank released a two volume report on Armenia's labor dynamics (click here for the overview page). Unfortunately, most of the report is based almost wholly on Armenian National Statistical Service (NSS) data from 2003 and 2004. Given the problems with Armenian statistical data and the fact that the statistics may already slightly outdated, the results should be read critically.
However, the volume has an exceptionally interesting chapter on "Youth Employment and Unemployment." The most immediate and striking fact is the idleness rate (defined as those who are neither working or in school) divided by the total youth population among youth aged 15-24 in Armenia. According to the NSS, over a third of young Armenians neither work nor study. Such a large cohort of unemployed youth is worrying since it prevents socialization into the labor market and may provide other negative social consequences, such as cycles of dependence and increased likelihood of drug and or alcohol addiction. Also, alarming is the passiveness of those who dropped out of the labor market; the majority of those who dropped out the labor market are not looking for a job.
Supporting findings from the CRRC Data Initiative, the World Banks reports data from the "Survey of Unemployed Youth" 2005. This survey found that networks play the most important role in finding a job. This, of course, puts a damper on incentive to complete professional training or improve skills and instead places a premium on increasing social connectedness. (So all that collective loitering outside the university may be worthwhile after all.)
The report, mirroring other reports, also found that particularly vocational and technical schools are not adapting to the needs of the job market, increasing the rate of dropout, since skill gained in these schools are viewed as useless. This situation is particularly grave, since these schools have no relationships with the job market.
Such high youth unemployment may be a large explanatory variable in the continuing outflow of migrants in Armenia. The question of labor migration is also addressed in the World Bank report.
Thursday, July 19, 2007
World Bank Governance Index, 1996-2006
In a further round comparisons, we have looked at the World Bank's governance index. This index uses six dimensions (voice and political participation, political stability, government effectiveness, rule of law, regulatory environment, control of corruption) to capture the quality of governance. Data run from 1996 to 2006. Armenia, generally, seems to have had the best governance. Georgia, however, is developing dynamically. In Azerbaijan, the index records little movement.
Note the intuitive presentation of the data, where red indicates a ranking in the very low percentiles..png)
By comparison Azerbaijan is fairly red, although there is progress with the regulatory environment. Georgia shows a fair amount of development in all sectors.
 The interactive website allows users to explore features in much more detail. Below is a map that shows regulatory quality in 2006.
But it's also possible to compare dimensions across countries..png)
Charts can be downloaded -- a wonderful tool for researchers looking for information. Follow this link if you want to play with the data.
