Showing posts with label Settlement. Show all posts

Monday, June 12, 2017

Most households in Georgia report limiting food consumption, despite economic growth

According to the World Bank, GDP in Georgia increased from USD 10.1 billion to USD 13.9 billion between 2009 and 2015. Despite this growth, according to CRRC’s Caucasus Barometer survey (CB), the share of those who reported not having enough money to buy food on at least a weekly basis did not decrease between 2011 and 2015. This blog post shows how this finding differs by settlement type and reported household income.

As the chart below shows, the general picture did not change between 2011 and 2015. Only about one third of the population claims it never happened during the 12 month prior to the survey that they did not have enough money to buy food they or their family needed. More than one third report encountering such difficulties periodically and about a quarter monthly or more often.


Note: Answer options “Every day” and “Every week” have been combined for the charts in this blog post.

Taking into account the margin of error, the share of people who reported not having enough money to buy food every week or more often is approximately the same in different settlement types. Importantly, the most common response in Tbilisi and the second most common response in other urban settlements is “Never”. This answer is, however, reported by less than half of the population of these settlement types.

Note: Answer options “Don’t know” and “Refuse to answer” were excluded from the analysis.
                       
A lack of money for food logically suggests a low income. The chart below shows that the higher the reported household income, the higher the share of the population reporting never being in a situation when they did not have enough money for food. According to CB 2015, 61% of the population reported their household income was less than USD 250 the month prior to the survey.


CB data show that a large share of households in Georgia have financial difficulties supporting their families’ primary needs and a majority struggle with not having enough money for food at least some of the time.

To have a closer look at the Caucasus Barometer data, visit CRRC’s Online Data Analysis tool.

Monday, August 15, 2016

What can CRRC’s Caucasus Barometer survey tell us about internal migration in Georgia?

According to existing estimates, the stock of internal migrants is much larger than the stock of international migrants worldwide. In Georgia, however, internal migration is largely overlooked and there is very little data available on the number and distribution of internal migrants. The National Statistics Office of Georgia (Geostat) regularly collects data on internal migration in the country via an Integrated Household Survey. The Public Service Development Agency, on the other hand, is in charge of population registration by place of residence. Several indicators of internal migration in Georgia can also be found in CRRC’s Caucasus Barometer (CB) survey. This blog post discusses one such indicator: whether, at the time of interview, adults in Georgia lived in the same settlement where they were born. Results of the latest, 2015 wave of CB are presented in this blog post.

About half of the population of Georgia (49%) reported having been born in a settlement where they lived and were interviewed at the time of the survey. An extremely small share (under 3%) reported being born outside the country. The rest are internal migrants – a quarter (25%) were born in another settlement, but in the same region of the country, and almost a quarter (23%) in a settlement in another region of the country. Thus, although we do not know the details of their migration (e.g., at what age, or for what reason they migrated), we can estimate that roughly half of the population of the country (48%) are internal migrants. Importantly, this CB finding is in line with Geostat’s estimates, according to which the share of internal migrants constituted 54% in 2014.

Differences between internal migrants and non-migrants by settlement type, age and, especially, gender are quite striking. Unsurprisingly, the share of internal migrants is highest in the capital, with 65% of Tbilisi’s population born elsewhere in Georgia. Villages, on the other hand, house the highest share of non-migrants. Nonetheless, 41% of the rural population was not born in the villages where they resided at the time of the survey.


When it comes to age differences, the share of internal migrants is highest among the oldest segment of the population (58% of those over 60 years old), and gradually decreases with age. Although differences by age groups are statistically significant, these differences are not particularly large.


While 62% of females report not being born in the settlement where they currently live, roughly half as many men (34%) report the same. This may be related to the tradition of women moving to their husbands’ households after marriage. Thus, in the absolute majority of cases when spouses are from different settlements, it would be a wife moving to another settlement, rather than a husband.


Although it might have been expected that those with higher education would more likely be internal migrants than those with lower levels of education, CB data does not suggest any significant differences between internal migrants and non-migrants in Georgia by level of education.
Preliminary analysis of CB 2015 data lets us estimate that about half of the population of Georgia can be considered internal migrants. Most strikingly, internal migrants and non-migrants differ by gender, with women being internal migrants about twice as often as men. There are relatively small differences between internal migrants and non-migrants by age and settlement type.

CRRC’s Caucasus Barometer data can be explored at our online data analysis platform.

Monday, February 15, 2016

Dwellings in Georgia's cities

View of Tbilisi from Turtle Lake (Photo by Mariam Kobaladze)

According to the World Bank, Georgia has become more urbanized since the collapse of the Soviet Union. The shift from a planned to a market economy was accompanied by increasing regional disparities, and more people moved to large urban centers looking for economic opportunities and better living conditions. As a result, more than half of the country’s population (57.5%) currently lives in urban settlements, according to the 2014 census. Based on the STEP Skills Measurement Survey conducted in March and April 2013 in urban settlements in Georgia by CRRC-Georgia on behalf of the World Bank, this blog post looks at the type of dwellings where the urban population lives, including data on the number of rooms per dwelling, type of floor covers and toilets, as well as the ownership status of these dwellings at the time of the survey. The survey data was released in 2015 and, for the time being, is the most recent data available.

The majority of Georgia’s urban population (78% of the population of Tbilisi and 53% of the population of other towns and cities) lives in apartments in large apartment blocks with more than ten apartments. Only 14% of Tbilisi residents live in single family houses compared with 41% of residents of other urban settlements.


When it comes to ownership, 83% of Tbilisi residents and 90% of the residents of other towns and cities own their dwellings. Only 9% of Tbilisi residents and 3% of the residents of other urban settlements rent their homes or apartments.

About one third of residents of urban settlements live in three-room dwellings. One- and two-room dwellings are more common in the capital, while five-room or larger dwellings are more common in the non-capital urban settlements.


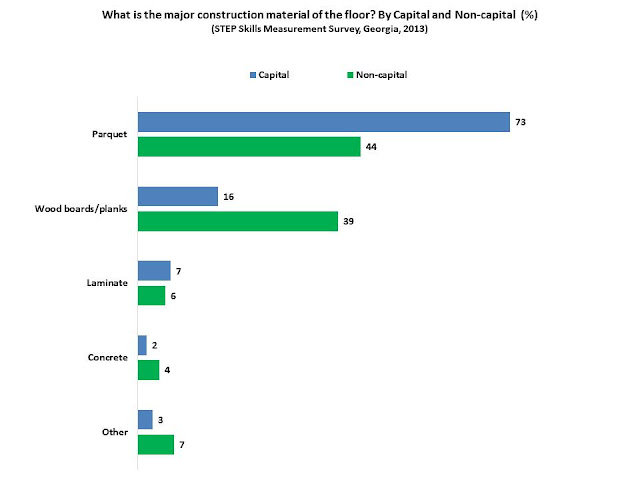
Parquet floors are the most common flooring material in Tbilisi, where 73% of floors are made from parquet. The respective share in other urban settlements is 44%. The next most common flooring material is wood boards used in 16% of dwellings in Tbilisi and 39% in other urban settlements.


As the survey was only conducted in urban settlements, it is not surprising that most of the dwellings have flush toilets connected to a piped sewer system (97% in Tbilisi and 79% in other urban settlements). Still, there are dwellings that have pit latrines with slab (2% in Tbilisi and 11% in other urban settlements).

Note: The sum of answer options exceeds 100% due to the rounding. 

Thus, most urban Georgians reside in apartments in large apartment blocks. About a third of the urban population lives in dwellings that have two or three rooms. Most people own the dwellings they live in. Notably, there are still homes in the cities that do not have toilets connected to the sewage system.
To explore this topic more, have a look at the data, here.

Tuesday, June 30, 2015

Who trusts the police in Georgia?

By Tamar Gzirishvili

[Note:  Social Science in the Caucasus is publishing the work of six young researchers who entered CRRC-Georgia’s Junior Fellowship Program (JFP) in February 2015. This is the fourth blog post in the series. Click here to see the first, second, and third posts in the series.]

The 2004 police reform in Georgia was regarded as a successful transformation of one of the most corrupt institutions in the country into a functional entity. The reform included the mass dismissal of police officers, rebranding of units with new equipment and a new image, and increasing the salaries of police officers in order to decrease the incentive to solicit or accept bribes. Largely as a result of this reform, as Alexander Kupatadze claimed in 2012, “Georgia has been portrayed as the ‘safest place in Europe’ with low victimization and low crime rates,” and as crime rates went down, the police earned increased public trust. However, a recent study on the effectiveness of the Ministry of Interior by several Georgian NGOs including Transparency International Georgia, Georgian Young Lawyers’ Association, and Georgian Democracy Initiative among others highlights a number of violations by the patrol police during searches of people on the streets in 2013. A joint statement by leading Georgian NGOs published in August 2013 identified some of these violations.

The statistics released by the Georgian Ministry of Interior show that the number of registered crimes decreased by 17% from 2013 to 2014, while the number of solved cases increased from 58% to 63% in the same period. However, doubts on the reliability of this data, as well as on the legitimacy of police raids and random searches persist. A public opinion poll conducted by ACT in 2013 shows that 34% of Georgians believe that the crime rate increased in Georgia over the last year, while 18% think it decreased. Considering this quite unstable situation, it is important to understand how levels of trust in the police have changed over time and who trusts the police. Looking at CRRC’s Caucasus Barometer survey data for the period between 2008 and 2013, this blog post examines the Georgian population’s reported trust in the police by settlement type and education.

During this period, different levels of (dis)trust in police have been recorded, with distrust gradually decreasing and trust fluctuating. The highest level of trust (67%) was recorded in 2011. It decreased to 50% in 2012, but increased to 58% in 2013. The share of those reporting “neither trusting nor distrusting” the police has increased from 19% in 2008 to 30% in 2013, with fluctuations in between.


Note: The original 5-point scale used for this question was re-coded during the analysis into a 3-point scale. Answer options “Fully distrust” and “Somewhat distrust” were combined into the category “Distrust,” and “Somewhat trust” and “Fully trust” into “Trust.” “Neither trust nor distrust” was not re-coded. 

Who trusts the police in Georgia? Interestingly, no differences are observed in trust in the police by age or gender. The 2013 Caucasus Barometer data shows that residents of rural settlements express trust in the police more frequently than those living in urban settlements and in the capital (67%, 52% and 49%, respectively). Consequently, distrust is higher in the capital and other urban settlements (11% in both cases) compared to rural ones (5%). It should be noted, however, that a similar trend can be observed in the reported trust towards any other social institution, with the rural population, overall, reporting higher levels of trust.

There are very small differences in levels of trust in the police by education. Those with secondary or lower education tend to trust police slightly more compared to those with secondary technical or higher education (61%, 56% and 55%, respectively).


Note: The variable measuring education level was re-coded, so that answer options “No primary education”, “Primary education (either complete or incomplete)”, “Incomplete secondary education” and “Completed secondary education” were combined into the category “Secondary or lower.” Answer options “Incomplete higher education”, “Completed higher education”, and “Post-graduate degree” were combined into the category “Higher than secondary education”. “Secondary technical education” was not re-coded.

Overall, the data shows that the share of those who report “neither trusting, nor distrusting” police has increased over the years in Georgia, while the share of those who distrust the police decreased. People living in rural settlements tend to report trusting police more than people living in other settlement types. There are very small differences by level of education and no differences by age or gender.

To explore issues related to trust in social and political institutions, take a look at the Caucasus Barometer data using CRRC’s Online Data Analysis tool.

Monday, April 07, 2014

Happiness in Georgia

Happiness is an issue that has been the subject of philosophical and social science reflection at least since the ancient Greek philosopher Democratis (460 BC -370 BC) said, “Happiness resides not in possessions, and not in gold, happiness dwells in the soul.” This oft cited sentiment frequently comes with the suggestion that home and family are more important than material wealth. This blog post will take a look at these sentiments and examine how happiness relates to personal income, settlement type, and marital status in Georgia.

Economists have been debating whether money can “buy” happiness for decades, if not centuries. Douglas J. Den Uyl and Douglas B. Ramussen in their 2010 article have argued that Adam Smith, author of the famed book, The Wealth of Nations “was the first ‘happiness’ theorist in economics.”  Interestingly, the 2013 Caucasus Barometer shows that in Georgia, individuals with higher incomes are also more likely to say they are happy.


Note: The question, “Overall, how happy would you say you are,” was asked using a 10-point scale which was recoded to a 3-point scale (Unhappy, Neither Happy nor Unhappy, and Happy).

Although self perceptions of happiness in Georgia appear to increase with personal income, the Easterlin Paradox holds that happiness will increase with income, but only up to the point where needs and wants are met, and where having more money becomes superfluous. Judging whether the Easterlin Paradox applies in Georgia is not possible from an examination of data from the Caucasus Barometer. However, Lia Tsuladze, Marine Chitashvili , Nani Bendeliani , and Luiza Arutinovi write more about  income, economics and happiness in their 2013 article.

Settlement type also seems to be related to how happy Georgians consider themselves to be. Georgians living in urban areas (66%), including Tbilisi (67%), are more likely to consider themselves to be happy than those living in rural areas (56%).


Marital status is a third factor related to happiness in Georgia. Alfred Lord Tennyson's 1850 poem, In Memoriam: 27, states, “Tis better to have loved and lost/ Than never to have loved at all.” Despite these lines’ continued prominence today, at least in Georgia, it appears that it is better to have loved and not lost, or to have never loved at all. Georgian widows, widowers, the separated and divorced report being unhappy more than twice as much as Georgians who are married, cohabiting or who were never married.


Personal income, where one lives, and marital status appear to be related to perceptions of happiness in Georgia.  We encourage you to explore the data further using our ODA tool. We also recommend reading this blog post which examines happiness in Azerbaijan.

Monday, December 02, 2013

Happiness in Azerbaijan

Happiness is one of many indicators of well-being. On July 9, 2011 the General Assembly of the UN adopted a resolution which declared, “happiness as a universal goal and aspiration [that] embodies the spirit of the Millennium Development Goals”. In response, the UN organized a high level meeting on happiness in April 2012, and in 2013 the UN declared March 20th as the International Day of Happiness. To enhance the connection between happiness and sustainable development, the UN supported the publication of the World Happiness Report in September 2013. The report measured happiness in 156 countries by examining six variables: GDP per capita, life expectancy, social support, perceptions of corruption, prevalence of generosity, and the freedom to make life choices. The report ranks Azerbaijan 116th out of 156 countries, and notes that Azerbaijan has had a negative shift between 2005-2007 and 2010-2012. 

                                        Comparing Happiness: 2005–07 and 2010–12. World Happiness Report 2013.

The annual Caucasus Barometer(CB) asks, “How happy would you say you are?” on a 1 to 5 scale where 1 means extremely unhappy and 5 means extremely happy. The data shows that the level of reported happiness in Azerbaijan has gradually increased from 2010 to 2012, yet it remains lower than in Armenia and Georgia.


CRRC-Azerbaijan's 2012 survey on Social Capital, Media, and Gender asked the same question and showed that 19% of Azerbaijanis between 18 and 35 years old say they are extremely happy relative to those over 56 years old who say the same (9%).


Settlement type also matters. More people in the capital and urban areas say they feel happy -points 4 and 5 combined  (62% and 65%, respectively) compared to those who live in rural areas who say the same (46%).


The correlation between education and happiness can be contentious. British economist and co-editor of the World Happiness Report, Richard Layards, excluded education from the list of factors that might have an effect on happiness. However, data from the Social Capital, Media, and Gender survey shows that there is a strong connection between education and happiness. 93% of people with a Master's degree and above are more likely to describe themselves as happy in Azerbaijan, and this percentage declines as the level of education declines.


For more data on happiness in Azerbaijan please visit the CRRC dataset.