Showing posts with label Economic Situation. Show all posts

Tuesday, August 02, 2022

Georgia’s uneven post-pandemic economic recovery

Note: This article first appeared on the Caucasus Data Blog, a joint effort of CRRC Georgia and OC Media. It was written by Dustin Gilbreath, a Non-resident Senior Fellow at CRRC-Georgia. The views presented in the article are of the author alone, and do not necessarily reflect the views of CRRC Georgia, or any related entity.

Saying that COVID-19 changed the world is perhaps an understatement. Although a health catastrophe first and foremost, economies also plunged with the emergence of wide-ranging restrictions on activity. World Bank data suggests the global economy shrank between 2019 and 2020 by approximately 3.3%. In Georgia, the corresponding figures were a 6.7% decline in the size of the economy. 

As COVID-19 restrictions have been largely removed, the world has witnessed an economic recovery, albeit combined with the highest rate of inflation seen in recent memory. Despite wide-ranging rhetoric around building back better, data from a newly released World Bank study, which CRRC Georgia conducted, suggests that while the economy is recovering, many groups are facing greater barriers to re-entering the workforce.

Since December 2020, CRRC Georgia has been conducting a series of telephone surveys for the World Bank. The results of the survey show a clear rise in the share of the public that is engaged in employment. While 32% of the public (over the age of 18) reported having a job in December 2020, 43% did in March of 2022.

Still, this data indicates that employment has yet to recover to pre-pandemic levels, with 51% of the public reporting that they had been employed prior to the pandemic.


While the economy is clearly recovering, the data also show that recovery in employment is unequal.

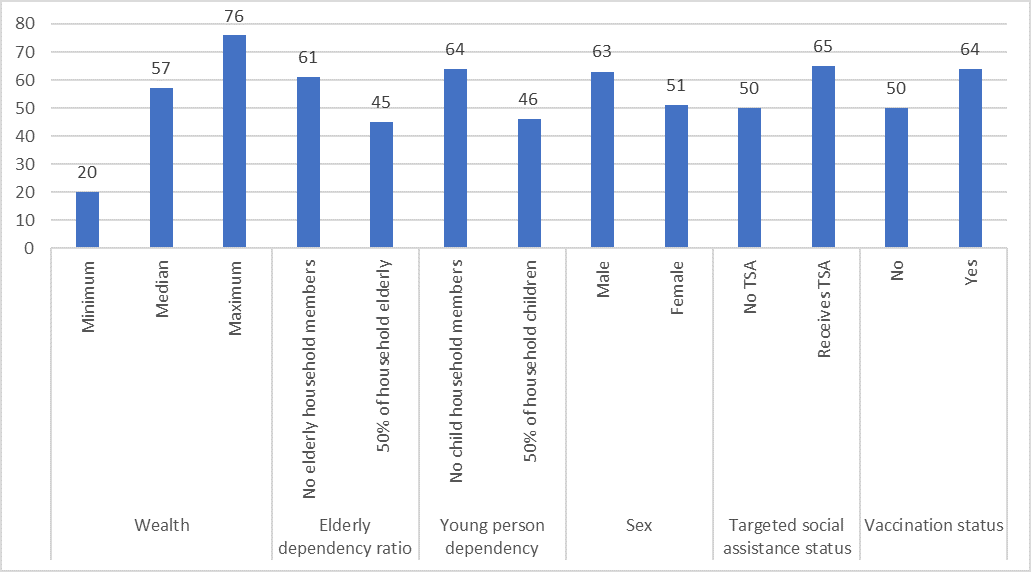
Regression analysis comparing people who lost a job during the pandemic and have not returned to employment to people who lost a job during the pandemic and did return to work suggests that a number of traditionally economically disadvantaged groups face larger challenges in re-entering the workforce.

Women who lost a job during the pandemic are 12 percentage points more likely not to be working at present than men, while people in poor households are substantially less likely to have re-entered the workforce.

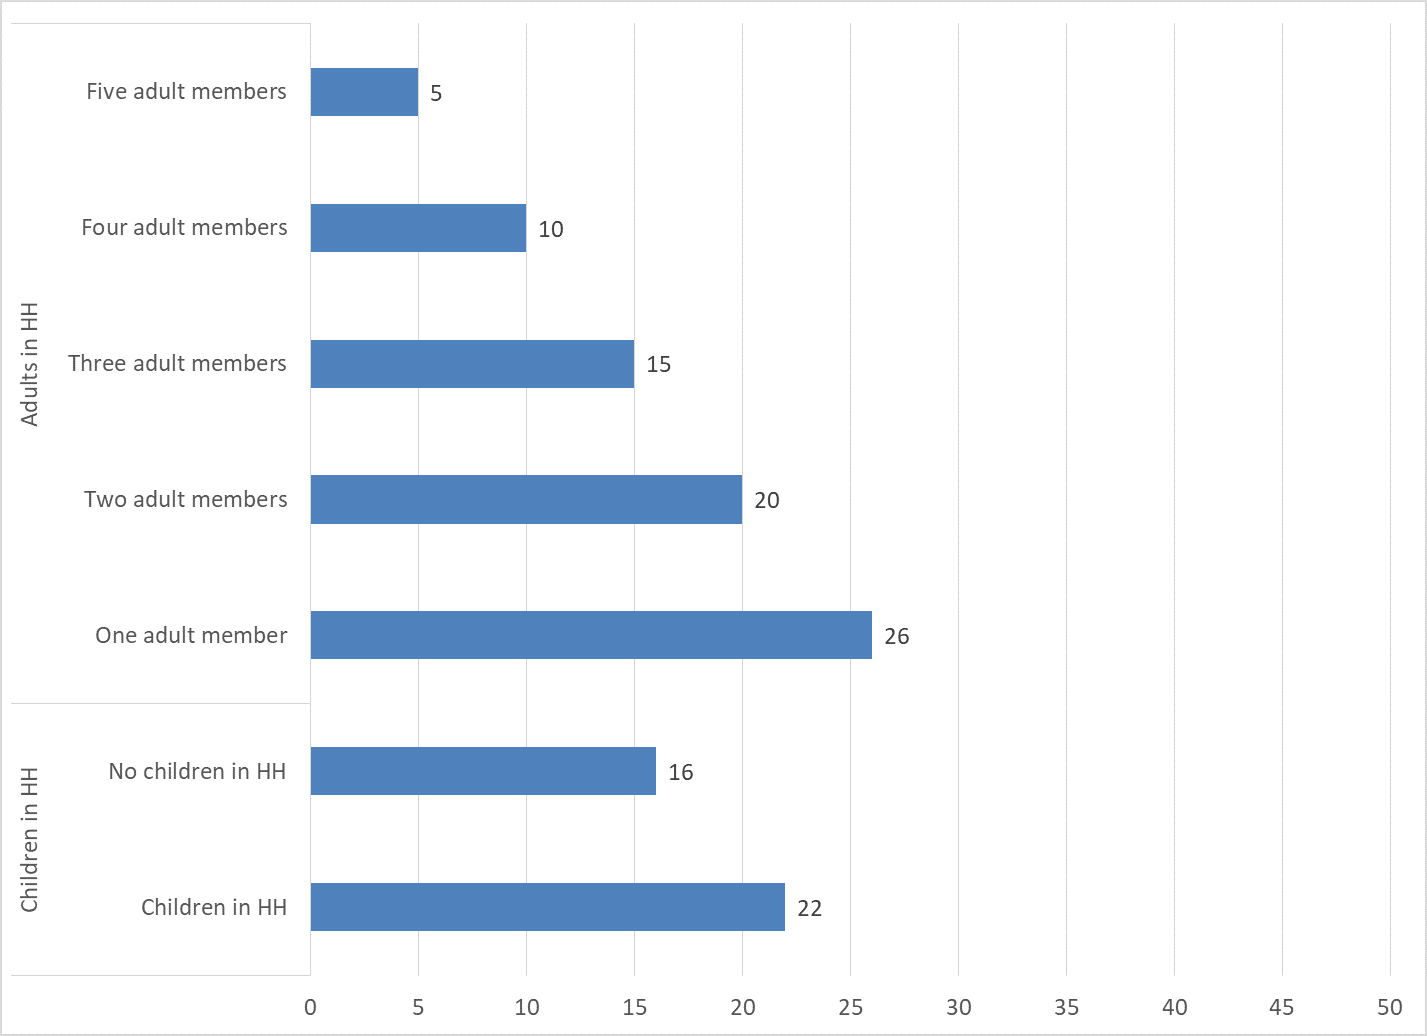
In addition, the more elderly people there are in a household, the less likely someone who lost a job during the pandemic is to have returned. 

Similarly, in households with relatively large shares of children, people who lost a job during the pandemic are significantly less likely to be working today than in households with fewer children. 

People who did not get vaccinated are 14 percentage points less likely to have returned to the workforce than people who did get vaccinated.

In the one bright point in the analysis, people in families that receive targeted social assistance were more likely to return to work than in families that do not receive social assistance.

In contrast, there are no significant differences between age groups, settlement types, households with more and fewer members, people of different education levels, ethnic groups, and people who did and did not catch COVID-19 after controlling for the factors shown in the chart above.

Women, people with greater numbers of elderly people, and greater numbers of children in them all remain less likely to be employed at present than men and people without children or elderly people in the household.

This suggests that domestic work and care work burdens related to the pandemic may be at play in people’s lack of return to the workforce. However, this would require further research to confirm.

In the above context, actors working on Georgia’s economic recovery should look into policies which can support a more equal recovery.

Note: The data this article is based on is available here. The analysis of which groups have and have not returned to the workforce was conducted using a logistic regression which controlled for the following variables: Age (18-34, 35-54, 55+); Sex; Settlement type (Tbilisi, other urban, rural); Household member count; Education level (tertiary or not); Child dependency ratio (share of household 18 or under); Elderly dependency ratio (share of household over the age of 64); Received targeted social assistance aside from an old age pension; Caught COVID 19/ had a family member with COVID 19 or not; Vaccinated against COVID 19 or not; Ethnicity (Ethnic Georgian or ethnic minority); Wealth index (A simple additive index of ownership of a number of durable goods within a household).

Wednesday, July 13, 2022

The importance of remittances for Georgian households

Note: This article first appeared on the Caucasus Data Blog, a joint effort of CRRC Georgia and OC Media. It was written by Anano Kipiani, a Policy Analyst at CRRC-Georgia. The views presented in the article are of the author alone, and do not necessarily reflect the views of CRRC Georgia, or any related entity.

Immigration from Georgia is common, with a prime motivator being the difficult economic situation in the country. Indeed, about three-quarters of Georgians have a close relative living abroad, and most send remittances to their relatives in Georgia. In turn, remittances made up 12.9%  of the country’s GDP in 2019. By comparison, agriculture’s contribution to GDP was about half of this number, at 6.5%. 

The study compared households that receive remittances to: similar households without remittances; similar households with migrants but who do not receive remittances; and similar households without migrants. 

Additionally, households that have migrants, but do not receive remittances were compared to the other three groups of households. This was done using a process called matching, which identifies similar groups of individuals.

Who gets remittances?

Overall, 19% of households reported receiving remittances from abroad in 2019. While looking at the types of households that receive remittances, a regression analysis suggests that households with one adult household member are 21 percentage points more likely to get remittances than households with five adult members. Households with children are six percentage points more likely to get remittances than households without children.

What are the impacts of remittances?

Households which receive remittances report their economic conditions are relatively positive compared to similar households that do not receive remittances. They are five percentage points more likely to assess their economic condition as relatively good, and nine percentage points less likely to believe they have relatively poor economic conditions. 

In contrast, migrant households that do not receive remittances are slightly more likely to assess their economic condition negatively (by six percentage points) compared with households that do not have migrants. 

Note: Answer options 'good' and 'very good' are recoded as 'relatively good', while 'poor' and 'very poor' are recoded as 'relatively poor'. Due to their small number, 'don’t know' and 'refuse to answer' were dropped from the analysis. In some cases, figures in this post may not sum up to 100% due to rounding errors.

Households that receive remittances compared with all other households were nine percentage points more likely to be able to afford enough food and clothes, five percentage points more likely to be able to afford to buy expensive durables, and eight percentage points less likely to not have enough money for food compared with other similar households. 

Remittances also appear to be associated with higher monthly incomes. Households with remittances are seven percentage points slightly less likely to report they earn less than $100 a month compared with all other households and migrant households without remittances. However, households with remittances are slightly more likely to respond ‘don’t know’ or refuse to answer, which is often associated with higher levels of asset ownership and in turn, likely income, in Georgia. 

Households that receive remittances also have more durable goods than others. From a list of 10 different goods asked about on the survey, migrant households owned nearly one additional good on average. At the same time, households with migrants that do not receive remittances had slightly fewer durable goods than households without migrants.

Overall, the data suggests that people benefit from receiving remittances, at least in economic terms. In contrast, households that have migrants but do not receive remittances do relatively poorly on some measures, though by no means all. Despite these positive economic impacts, the results do not speak to any effects, social, psychological, or otherwise, which may be tied to migration.

The data used in this post as well as replication code for the analysis is available here. A full policy brief on this issue is available here. The views expressed in this article are the author’s alone, and do not necessarily reflect the views of CRRC Georgia.

Wednesday, March 10, 2021

What predicts job satisfaction in Georgia?

This article was published on the Caucasus Data Blog, a joint effort of CRRC Georgia and OC Media. It was written by Makhare Atchaidze, a researcher at CRRC Georgia. The views presented in this article do not represent the views of CRRC Georgia or any related entity. 

Unemployment remains one of the most frequently cited concerns among Georgians. But how satisfied with their jobs are those who are employed?

Public opinion polling consistently shows that the most important issue facing the country is unemployment. While official data suggests an unemployment rate of around 17%, Caucasus barometer survey data suggests that only 40% consider themselves employed. 

While unemployment is clearly an issue, a secondary point is the quality of jobs available: a third of the unemployed (36%) reported that they do not work because available jobs do not pay enough, and 61% reported that suitable work is hard to find on a 2018 survey.

The results of the 2019 Caucasus Barometer survey suggest that people who are working tend to be moderately satisfied. Half (47%) of those who considered themselves employed or self-employed (37%) reported they were moderately satisfied with their work. By comparison, 37% of people expressed a positive attitude towards their job and 16% a negative attitude.

Women were nine percentage points more likely than men to report being satisfied with their job. 

People with tertiary education were 17 percentage points more likely to be satisfied with their job than those that have vocational education and 11 points more satisfied than those that have a high school degree or less. 

There were no significant differences between people of different ages, marital status and ethnicities or between settlement types in terms of satisfaction. 

Aside from demographics, job satisfaction is also correlated with income, employment sector, and knowledge of English. 

People with lower incomes tend to be less satisfied. Those whose personal monthly incomes were between $51–$100 were less likely to be satisfied with their jobs than those whose income was more than $101. The data shows that dissatisfaction is almost three times less likely when income exceeds $101. 

People who work in the public sector (including international organisations and NGOs) tend to be more satisfied with their jobs (58%), than those who work in the private sector (34%). 

The data indicated that people who likely have higher skill jobs tend to be more satisfied with their work. 

Having a higher level of knowledge of English was associated with greater job satisfaction, while higher-level computer skills were not. This is despite a strong correlation of around 50% between computer skills and English language knowledge.

Note: In some cases in the above, figures may not sum to 100%. This is due to rounding error.

The above data suggests that women and people with more education were more likely to report being satisfied with their jobs. This was also true of people working in the public sector and those with higher levels of English language knowledge. 

This suggests that those in higher-skilled jobs were more satisfied though not always, as the data on computer skills shows. 

The data used in this article is available here. Replication code for the above analysis is available here.


Wednesday, November 11, 2020

More Georgians than ever own phones and TVs, but inequalities remain

[Note: This article was published in partnership with OC Media on the Caucasus Data Blog. The article was written by Ian Goodrich, a Policy Analyst at CRRC Georgia. The views presented in the article are the author's alone and do not represent the views of CRRC Georgia or any related entity.]

Survey data from the last decade shows that more and more Georgians own household goods like mobile phones, TVs and washing machines, but inequalities in such material wealth still remain.
The Caucasus Barometer survey shows a steady growth in ownership of durable goods across Georgia over the last eight years. 

The percentage of survey respondents reporting ownership of each of a basket of seven household items has risen since 2011, with the increase most marked in rural areas. Whilst the rural-urban divide is seen to be closing, large gaps remain between respondents with higher education and those without. 

Virtually all households now possess a mobile phone (96% of households), colour television (93%), and a refrigerator (92%). Colour television ownership has been consistently high and has grown slightly in the last eight years. The same period has also seen large increases in ownership of refrigerators (up 22 percentage points) and cell phones (up 14 percentage points).

The largest increase, however, is seen in washing machine ownership. In 2011, washing machines could be considered a luxury item, with a minority of households (40%) owning one. In 2019, washing machine ownership is now the norm, with ownership doubling to 80% of households. 

Just over half of households now possess a personal computer. This figure fell slightly between 2017 and 2019, potentially resulting from growth in mobile phone use and increased mobile internet connectivity. 

Car ownership is also up by over ten percentage points, and the number of households owning an air conditioning unit has increased by five percentage points to 12%.

Virtually all households now possess a cell phone (96% of households), color television (93%), and a refrigerator (92%). Color television ownership has been consistently high and has grown slightly in the last eight years. The same period has also seen large increases in ownership of refrigerators (up 22 percentage points) and cell phones (up 14 percentage points).

The largest increase, however, is seen in washing machine ownership. In 2011, washing machines could be considered a luxury item, with a minority of households (40%) owning one. In 2019, washing machine ownership is now the norm, with ownership doubling to 80% of households. 

Just over half of households now possess a personal computer. This figure fell slightly between 2017 and 2019, potentially resulting from growth in mobile phone use and increased mobile internet connectivity. Car ownership is also up by over ten percentage points, and the number of households owning an air conditioning unit has increased by five percentage points to 12%.
The average number of items owned by a Georgian household from within this basket of seven goods has grown steadily since 2011. In 2011, a typical household possessed 3.6 items from the basket. This has increased to an average of 4.6 items in 2019.


Growth has been most dramatic in rural areas, which have caught up rapidly with the capital and other urban settlements. In 2011, a respondent in a rural area with a secondary or technical education could be expected to have 3.2 of the items on the eight-point index compared to 4.2 for a resident of Tbilisi: a gap of one point on the basket. Today, rural households have for the most part caught up with their urban and capital counterparts, scoring just 0.2 points lower on average holding all else equal.
Nonetheless, education remains a key predictor of household asset ownership with the analysis highlighting a continued sharp divide between respondents with higher levels of education and those without. 

Holding all else equal, those with a higher education have on average 15% (or 0.67) more basic household goods than those with a technical education, and 28% (or 1.1) more than those with an incomplete secondary education and below. 


Asset ownership is a simple proxy for household wealth and fails to account for other financial characteristics of a household, such as income or debt. But, the measure does enable analysis of the extent to which some basic material requirements are being met. 

The overall trend in the last eight years has been positive: washing machines and refrigerators are now found in the majority of Georgian homes and at a household level, mobile phone coverage is nearly complete. 

When contrasting the capital and other areas of Georgia, we see that rural areas in particular have caught up rapidly with Tbilisi. But despite greater equality across settlement types, those with higher levels of education appear to enjoy a substantially more comfortable home life than those without.

Note: The above analysis is based on an ordinary least squares (OLS) regression. The dependent variable is a simple additive index of positive responses to questions regarding ownership of the following seven items: cell phone, color television, refrigerator, washing machine, personal computer, car, air conditioner. A score of zero on the index represents ownership of none of these items, a score of seven corresponds to ownership of all items.

The independent variables in the regression are the respondent’s sex, age, ethnic minority status, settlement type, and education level. Independent variables were interacted with the number of years since the first wave in the dataset, where zero corresponds to 2011 and eight to 2019.

Differences between rural and capital scores on the index in 2019 were statistically significant at p <= 0.05 on a univariate OLS regression.

Replication code for the above analysis is available here.

Tuesday, September 08, 2020

Lockdown vs re-opening the economy in Georgia

[Note: This blog was originally published in partnership with OC Media on the Caucasus Data Blog, a joint effort of CRRC Georgia and OC Media.]

As the number of new daily confirmed cases is again on the rise, we look at how people felt about the anti-coronavirus restrictions in May.

Aside from the public health situation, COVID-19 has led to rising unemployment, reduced incomes, and food insecurity in Georgia. As the number of new daily confirmed cases is again on the rise, the Caucasus Datablog takes a look at how people felt about the anti-coronavirus restrictions when they were at their height.

Despite polling from CRRC Georgia’s COVID-19 Monitor surveys showing that the public supported the vast majority of the government’s anti-coronavirus policies, the data also suggests people were eager for the economy to reopen. In fact, a majority said they favoured opening up over a more cautious approach.

CRRC asked the public about the relative importance of caution versus opening up the economy on two surveys conducted between 7–10 May and 14–17 May. Most people agreed with the idea that the economic impacts of COVID-19 were worse than the virus itself and disagreed that it was more important to wait for the virus to be under control than to open the economy.  

In addition, the share of Georgians thinking that economic consequences of the virus could be as severe as virus itself also rose from 51% during the 7–10 May period to 64% during the 14–17 May.

The data from the 14–17 May survey was further analysed to explore differences between socio-demographic groups like age, gender, settlement type, education, employment, ethnicity, and household wealth.

This logistic regression showed that people in Tbilisi were less likely to think it was important to wait for COVID-19 to subside before opening up the economy. Older people were also less likely to support waiting for the epidemiological situation to get under control. 

When it comes to the economic costs of COVID-19, there were no statistical differences between key socio-demographic variables. During the crisis, large shares were uncertain how long the COVID-19 crisis would last (35% in the 7–10 May period and 42% during the 14–17 May period). 

Uncertainty on this question was associated with the idea that the economic costs of the virus could be worse than the virus itself. Controlling for demographic variables from the previous model, those uncertain about the possible period of the crisis were less supportive of the idea that the economic costs of the virus were worse than the virus itself.  

Still, a majority of those who were certain or uncertain about the length of the crisis thought that the economic consequences were worse than COVID-19’s health implications.

Overall, the majority of Georgians were supportive of opening up the economy during the COVID-19 crisis, and this support was increasing during the period when the economy was effectively closed. 


The negative economic impacts of COVID-19 also gained more public attention during this time. 

In general, urban settlements were more supportive of re-starting normal economic activities. Older people were also more prone to agree with opening up. 

Besides socio-demographic variables, uncertainties associated with the COVID-19 timeline also shaped public opinions. Uncertain people generally tended to disagree with the idea that the economic costs were harsher than the virus itself. 

The data presented in this blog post is available here. Replication code for the above analysis is available here.

This article was written by Rati Shubladze. Rati is a policy analyst at CRRC Georgia. The views presented in this article represent the author’s alone and do not represent the views of CRRC Georgia, the Embassy of the Netherlands in Georgia, or any related entity.

Monday, June 01, 2020

Are Lion’s Whelps Equally Lions?!

In Georgia, tradition has it that a son stays in the family and is responsible for taking care of his parents in their old age. Consequently, tradition also gives parents’ property to their sons. This limits women’s access to economic resources. New data from Caucasus Barometer shows that regardless of whether people think that a son or daughter or both equally should take care of their parents in their old age, many believe the son should still get the inheritance.

The data shows that people are either for equally distributing the house between sons and daughters or in favor of giving it only to the son. Daughters are rarely seen as the main heirs of the property. About half (52%) of the population believe that the apartment should be given to both children equally. At the same time, almost half of the population (47%) think that son is the main heir. Only 1% think daughters should inherit their parents’ apartment.

In contrast, Georgians overwhelmingly believe in sharing the responsibilities when it comes to caring for their parents. Three-quarters of Georgians believe that children of both genders should equally take care of parents, and twenty percent think that a son should take care of their parents more. Only 6% believe that the primary caregiver should be a daughter.

Most of those respondents (77%) who think a son should take care of his parents believe that property should be given to him. One fifth (21%) are for equal distribution, and only 1% believe that the property should be given to a daughter. Most people (60%) who think that both should equally care for their parents think that property should be distributed equally. Still, 37% think that the son should inherit and 1% that the daughter should. What is more, (55%) of those who believe that daughters should take care of their parents believe that property should be given to the son, while 40% thinks that it should be equally distributed. These numbers, however, should be treated with caution given the small sample of individuals that reported they think daughters should take care of parents in their old age.


Note: Answer options don’t know and refuse to answer are dropped from the analysis. Overall, less than 2% responded with these answer options to either question. The question “Imagine that there are a son and a daughter in a household; and the household only owns one apartment. In your opinion, who should inherit the apartment?” was shortened to “In your opinion, who should inherit the apartment?”

Further analysis shows that women are less likely to say that sons should inherit property than men. Tbilisi residents are less likely to mention that the inheritance should be given to sons than people in rural areas. Those in Tbilisi are also more likely to say that the inheritance should be given to all children equally. Those who have secondary or lower education are more likely to say that a son should inherit property than those with higher education. Moreover, they are less likely to say that all children should inherit property equally.


Note: On the above chart, base categories for each variable are as follows: male, 18-35 age group, should take care equally, rural, ethnic Georgian, and tertiary education. Answer options don’t know, refuse to answer, and other are not included in the analysis. 

The data shows that people are either for equally allocating inheritances between their children or giving it only to a son. Most people think that all children should take care of their parents equally despite their gender.  Taken together, this shows that gender equality in inheritance still has a ways to go in Georgia.

Note: The above analysis is based on a multinomial logistic regression analysis, where the dependent variable is responses to the question “Who should inherit the apartment: a girl or a boy?” The independent variables are gender, age group, ethnicity, settlement type, education, and conservative index. The data used in the blog is available here. Replication code of the above data analysis is available here.


Monday, February 24, 2020

Who’s thinking about temporary and permanent migration?

The population of Georgia has declined after the dissolution of Soviet Union from 5.4 million to 3.7 million according to the latest estimates provided by the Georgian National Statistical Office. The mass emigration of the Georgian population in the 1990s has been attributed to the decline of the economy and military conflicts in the country. Even though the economic situation stabilized starting in the 2000s, the migration flow has not stopped and interest in emigration is quite widespread in Georgia. This blog shows that interest in both temporary and permanent migration is associated with age. In contrast, settlement type, ethnicity and wealth of the household is associated with interest in permanent migration but not temporary and sex, internet usage, and having a relative living abroad with temporary but not permanent migration.

The Caucasus Barometer 2019 survey shows that around 10% of the Georgian population is interested in permanent emigration, while 50% would temporarily leave Georgian to live somewhere else. These figures have been relatively stable over time, and there was no significant change between the 2017 and 2019 Caucasus Barometer surveys.


This leads to the question who is more or less likely to be interested in temporary and permanent migration? A logistic regression suggests that those living in the capital, younger people, and ethnic minorities have higher chances of considering permanent emigration, controlling for other factors. There are no statistically significant differences for other demographic factors.


Household wealth is also associated with intention to migrate. Those with less wealth are more likely to be interested in emigrating from Georgia on a permanent basis.


When it comes to the temporary migration, the same analysis suggests a number of findings. Younger people are more interested in temporary migration than older people. In addition, males are more likely to say they want to leave the country temporarily. Internet use is also associated with thinking about leaving the country temporarily. Having a close relative abroad is associated with a nine percentage point higher likelihood of being interested in temporary migration. There are no statistically significant differences for other demographic factors.


Overall, Georgians are less enthusiastic about leaving the country permanently than temporarily. Being interested in emigration is associated with several factors. When it comes to the permanent emigration settlement type, ethnicity, and economic well-being matter. While for temporary migration internet use and having relatives abroad matter. In both cases age is a significant factor for emigration. In this regard, permanent migration might have more to do with poverty and temporary migration an interest in seeing the world and being in good enough health to do so.

To explore more the Caucasus Barometer 2019 survey findings for Georgia, visit CRRC’s Online Data Analysis portal. Replication code for the data analysis is available at CRRC’s GitHub repository here.


Monday, February 17, 2020

Grit in Georgia

Grit, the idea that passion and perseverance are important determinants of success aside from intelligence, has gained widespread attention in recent years. This stems from the fact that grit is a strong predictor of a number of outcomes like employment and income in life. Previous analysis on this blog suggests that the grit scale is also a strong predictor of employment in Georgia among young people in a select number of rural areas. Whether this works on a nationally representative sample is however an open question. So too is the question what predicts grit in Georgia. This blog uses data from CRRC Georgia’s January 2020 omnibus survey to address these questions.

CRRC Georgia’s omnibus survey contained the full 12 question grit scale. Respondents were asked how much a set of statements described them including things such as “I always finish what I start” and “Failure does not frustrate me.” Items that indicate low grit are reverse coded. In Georgia, the data suggests that the average score is 3.59 out of 5. People score highest on the statement “I am a hardworking person” and lowest on the statement “My interests change from year to year.”


Who reports being grittier in Georgia? A regression that included age, settlement type, sex, and whether or not a person had been internally displaced suggests that people in Tbilisi and IDPs have slightly higher levels of grit, controlling for other factors. In contrast, women and men and people of different ages do not have significantly different levels of grit. Although the analysis showed statistically significant differences between settlement types and IDPs and non-IDPs, the differences are substantively small as depicted on the chart below.


The data also suggest that higher grit scores are associated with a number of achievement related outcomes. When someone’s grit score increases from two to four, their chances of being employed triple, going from 10% to 33%, controlling for other factors. Similarly, the chances that someone has completed higher education increases from 15% to 43% when a person’s grit score increases from two to four. Higher levels of income are also associated with grit.


The above analysis suggests that grit is a good predictor of success in Georgia as it has been shown to be in other locations. However, caution is warranted in suggesting there is a causal relationship at play in the above data. For instance, higher education may help develop grit rather than gritty people being more capable of completing higher education. A similar pattern could be at play when it comes to employment.

Replication code for the data analysis is available here. To find out more about CRRC Georgia’s Omnibus survey, and opportunities to include questions on the survey, click here.


Monday, January 20, 2020

The economic and educational consequences of child marriage in Georgia

[Note: This article was published in partnership with OC-Media, here. The article was written by Dustin Gilbreath, Deputy Research Director at CRRC Georgia. The views presented in this article do not represent the views of UN Women, CRRC Georgia, or any related entity.]

Widely condemned as a violation of human rights, child marriage is associated with negative health outcomes — both physical and psychological. Aside from these clear issues, a growing body of research suggests child marriage also has economic consequences for both the women who marry under the age of 18 and society at large.

A policy brief released by CRRC Georgia today shows that child marriage remains a persistent problem in Georgia for both ethnic Georgians and ethnic minorities and that it comes with significant economic consequences. Yet, the brief also suggests that interventions in the education system have the potential to alleviate the economic harm of child marriage.

The child marriage rate in Georgia has remained static over the years. Data from a UN Women study on women’s economic inactivity suggests that the share of women who have ever married in the country who did so when they were under the age of 18 has not changed beyond the margin of error over the decades.

In the 2010s, the survey suggests 14% of women who ever married did so before turning 18, the same share as in the 1950s and earlier. This finding falls in line with UNICEF’s most recent estimate of the early marriage rate in Georgia.

Still, it likely underestimates the extent of the issue to a certain extent, since people under the age of 18 at the time of the survey were not interviewed.


The data suggest that child marriage is a particularly acute problem in rural areas, with 21% of rural women who have ever married having done so under the age of 18. This is a rate twice as high as in Tbilisi (9%) and other urban areas (10%).

The study is, however, inconclusive when it comes to child marriage rates among ethnic minorities (10%) compared with ethnic Georgians (9%). This likely stems from the relatively small number of ethnic minorities within the survey; other studies have found much higher rates among Georgia’s ethnic minorities, particularly the country’s ethnic Azerbaijani population.

This finding does, however, underline the point that child marriage is not just a problem among ethnic minorities in Georgia — but also among ethnic Georgians.

The costs of child marriage

Using data from CRRC Georgia, Swiss Development Cooperation, and UN Women, I statistically matched the group of women who had married early to a group who had not but came from similar socioeconomic backgrounds. Using this matched sample, it was possible to estimate the effects of child marriage on women’s economic and educational outcomes.

The results showed that women who married under the age of 18 earned 35% less than those from similar backgrounds who did not marry as children. Moreover, they were significantly less likely to participate in the labour force.

This is in a context where women already make significantly less and participate in the labour force at significantly lower rates than men.

Educational attainment was also significantly lower among the women who married before turning 18. The women in the matched sample who married underage were 2.3 times less likely to attain a higher education than those who married later in life.

Similarly, women who married as adults were six percentage points more likely to obtain a vocational education than those who married as children.

Two-thirds of women who married under the age of 18 (64%) obtained only secondary or lower levels of education, compared with 36% of women from similar socioeconomic backgrounds who married as adults.


However, the study suggests that when women who marry under 18 attain similar levels of education as those who marry as adults, the differences in outcomes largely disappear.

The women who married as children and those who married above the age of 18 in the matched sample who had the same levels of education earned statistically indistinguishable amounts. They also participated in the labour force at similar rates.


This finding suggests clear paths to alleviating the economic harm that child marriage causes in Georgia. By supporting girls who marry under 18 to stay in and complete school, encouraging those who have left to return, and creating an enabling environment for both groups, the economic harm of child marriage could be reduced.

Child marriage has clear social, psychological, and health consequences. These matter more than, and likely contribute to, the economic consequences described above.

While the ultimate goal of policy on child marriage in Georgia should be ending it, until that time, reducing the economic harm it causes should also be a goal. The data suggest that educational interventions are potentially a beneficial place to start.

The data and replication code of its analysis are available here.


Monday, November 04, 2019

Drugs for desert? Biggest monthly household expenses in Georgia

The economy remains the main concern for people in Georgia. Together with the consumer price index and USD-GEL exchange rate rising, average household expenditures also have increased over the last couple of years. Meanwhile, according to recent data only 10% of the population has any savings. Although household expenditures have increased, what are people spending money on? The most recent CRRC-NDI survey from summer 2019 asked questions about household expenditures which provide a sense about what people spend money on in Georgia as well as who spends more on different categories of goods and services.

Most of the families in Georgia spend everything they earn. When asked about the largest monthly household expenses, everyday necessities came out on top, while leisure related expenditures were named by only a few. Food and utilities were named twice as frequently as any other expense. While this might not be a surprise, it is noteworthy that expenses on medicine came third, with more than one in three naming it as one of their largest monthly household expenses. Interestingly enough, some people, though a negligible number, still name travel, exercise, and entertainment related expenditures as the largest.


Note: Respondents were allowed to name up to three categories.

To understand how household expenditures vary between different demographic groups regression models were constructed. They included sex (male, female), age group (18-34, 35-54, 55 and +), settlement type (capital, large urban, small urban, rural), ethnic enclave status (primarily Georgian settlements, primarily minority settlements) and an additive index of ownership of different items, a common proxy for wealth.

When looking at the most common household expenses, food and utilities are on top regardless of people’s gender, age, the type of settlement they live in, or their economic situation. Nevertheless, the regression model showed that several demographic variables are useful in predicting who is more likely to have certain kinds of expenditures. For example, people who live in the capital  are less likely to name loans/installments/mortgages as their largest monthly expenditure compared to people in small urban and rural areas. People over 55 and people with lower economic standing are much less likely to name this expenditure as well, compared to people who are younger and people with higher economic standing. Also, minority settlements are less likely to name loans compared to Georgian settlements.


Similarly, there are some small differences in terms of education costs as well. People who are over 55 and men are slightly less likely to name education related expenditures compared to younger people and women. In households with higher economic standing, education related expenses are more likely to be mentioned among the largest monthly household expenditures.

One of the most interesting issues to look at is spending on medicine. It is third highest on the list, which is telling: a third of the population is spending as much or more medicine as food. There are also some interesting differences between various groups associated with medicine related expenses. People living in small urban and rural areas are more likely to name medicine among their top expenditures than those who live in the capital. Also, minority settlements are slightly less likely to mention medicine in their expenditures, than people from Georgian settlements. Similarly, younger people are one third as likely to name medicine, compared to people who are 56 or older. An additive index of ownership of household items shows that Georgians who own fewer things are more likely to say medicine is one of the top monthly expenditures in their household compared to people who own more. Differences between richer and poorer people hold even, when looking at people in different age groups. In all age groups people with higher economic standing name medicine less frequently than poorer people. Thus, older people and people with worse economic situations are more likely to name medicine as among their largest monthly expenditures. Interestingly, the same pattern is not present with medical care spending as opposed to spending on medication.


The data show that in all demographic groups in Georgia subsistence related expenses occupy the main position in household expenditures. Food, utilities, and medicine are the top expenditure categories for young and old, well-off and poor, men and women, and people in cities and rural areas. Though, there are of course some differences in expenditures between some demographic groups as well. Older people are less likely to have loans or education related expenses. Economically better off people are more likely to name these among their top expenditures. Moreover, older people and people with worse economic situations are more likely to name medicine related expenses, than younger people and those with better economic situation. Importantly, economic situation remains important even when controlling for age: better-off people are less likely to name medicine related expenses than the poor no matter their age.

Note: This blog post is based on logistic regression analyses. The dependent variable was a dummy variable for mentioning food, cost of utilities, medicine, medical care, or loans as the largest monthly household expense versus not naming this expense.  The independent variables included sex, age group, settlement type, ethnic enclave status, and an additive index of ownership of household items. The data used in the above analysis is available here. The replication code can be found here.


Friday, September 27, 2019

The gender gap in expected wages in Georgia exists only among the well off

[Note: This blog post was originally published in partnership with OC Media, here.]

Much has been made of the gender pay gap in Georgia. A related but different economic indicator is the reserve price of labor i.e. the wage which someone wants before they would consider accepting a job. The July 2019 CRRC and NDI survey suggests a gendered gap in the reserve price of labor as well: women want significantly less than men to start working on average. However, further analysis suggests that the gap only exists among the relatively well-off and not among poorer households.

On the survey, respondents that did not consider themselves employed were asked, “Considering your education and skills, what is the minimum salary you would agree to work for?” Eight percent of respondents asked the question refused to answer and 16% reported they did not know. Among those that did know how much they would want to start a job, the average was GEL 719.  For men, the average was GEL 823 while for women, it was GEL 643 – GEL 180 less. Women’s lower reserve prices appear to stem from the larger share of women who report they would be willing to start working for GEL 500 a month (33%) compared with men (22%).

Further analysis of this question suggests that sex remains a significant predictor of the minimum salary someone would be willing to start working for, controlling for education level, settlement type, household wealth (proxied through the number of assets they own), age, and the presence of children in the household. Aside from sex, household wealth has a statistically significant association with the salary people want to start working.  In Tbilisi and other urban areas, salary expectations are also higher than in rural settlements. Among the oldest age cohort in the survey (56+), expectations were lower.

However, after controlling for the interaction between sex and other variables rather than sex in and of itself, the data suggests that the interaction between a household’s wealth and sex is the key gender related factor when it comes to the reserve price of labor. There is no significant difference between the sexes in the reserve price of labor in poorer households. However, as wealth increases, men’s reserve price of labor increases at nearly twice the rate as it does for women: for every additional asset that a household owns, men want GEL 80 more to start working on average, compared to GEL 44 for women.

Rather than wanting more money to start working than men, women have lower reserve prices overall. While women want less to start working, this is only the case when women are in relatively better off households. In poorer households men and women that are not working are willing to start work at statistically indistinguishable wages.

Note: This blog post is based on two ordinary least squares regression analysis. The first controls for sex, age group, education level, household wealth (number of assets owned, from 11 asked about), settlement type (Tbilisi, Urban, Rural), and whether or not there is children in the household as independent variables. The dependent variable is the salary someone would want in order to start working. The second regression analysis looks at the interaction between all of the previously noted variables with sex. The data used in the above analysis is available here. The replication code can be found here.

This piece was written by Dustin Gilbreath, the Deputy Research Director of CRRC-Georgia. The views presented in this article do not necessarily represent the views of CRRC-Georgia. The views presented in this article do not represent the views of the National Democratic Institute or any related entity.

Monday, August 21, 2017

Statistical Hiccups Cause Georgia to Become Lower-Middle Income Country

[Note: This article originally appeared on Eurasianet. It was written by Dustin Gilbreath, a Policy Analyst at CRRC-Georgia. The views expressed within the article do not necessarily reflect the views of CRRC-Georgia or any related entity.]

Georgia’s economy appeared to take a step backward earlier this summer when the World Bank demoted the country to “lower-middle-income” status. The demotion, however, has more to do with statistical hiccups than it does with a substantial decline in economic activity.

In 2016, Georgian officials cheered when the World Bank promoted the country into the ranks of “upper-middle-income” states. It was big news in Tbilisi, the capital. But in July, officials didn’t have much to say when the country slipped back into the “lower-middle-income” ranks.

To understand the up-and-down tale of Georgia’s economic status, one needs to know how the World Bank classifies countries into income groups, a bit about Georgia’s 2002 and 2014 censuses, Georgia’s fluctuating exchange rate, and what country classifications are used for in practice.

To start, the World Bank measures economic status primarily by relying on gross national income (GNI) per capita, which is composed of GDP, as well as incomes flowing to the country from abroad, including interest and dividends. To make these calculations, the Bank uses something called the Atlas method, which accounts for fluctuations in the exchange rate using a three-year, inflation-adjusted average of rates.

Thresholds for each income group change slightly every year based on inflation. In the most recent year, countries with less than $1,005 in GNI per capita were designated low-income countries; those with GNIs from $1,006 to $3,955 fell into the lower- middle-income group; $3,956 to $12,235 were upper middle income; and those with $12,236 and above attained high-income status.

Georgia isn’t the only post-Soviet country to experience a downgrade in recent years due to exchange-rate woes and other factors. Russia, for example, moved down to upper-middle-income status in 2016 after three years in the high-income group.  Meanwhile, Azerbaijan, which is grappling with a severe downturn due to the global drop in energy prices, is at risk of demotion to lower-middle-income status next year. And Kyrgyzstan and Tajikistan appear poised to slip back into the lower-income category.

GNI per capita is a population-based measure. That means that as the number of people decreases, the figure increases. For this reason, the 2014 census made Georgia an upper-middle income country. This fact stems from Georgia’s population size between 2002 and 2014 being estimated using the 2002 census. In 2002, the Georgian government carried out its first census since the last Soviet census in 1989. The census’s final population count is believed to have heavily overestimated the population at about 4.4 million citizens. Between censuses, the population data is updated using birth and death registries. These too had problems, showing that Georgia’s population was growing steadily.

In contrast to the 2002 census, the 2014 census was more rigorous. It showed a 17% smaller population figure than the Georgian National Statistics Office had estimated for 2014. This meant that the per capita figures for GNI jumped, pushing Georgia into upper-middle income status. Notably, estimates of GNI per capita which use more realistic population figures for the years between 2002 and 2014 suggest that Georgia had likely crossed the upper-middle income threshold in 2013.

Even though the Atlas method takes into account fluctuations in exchange rate, GNI per capita is ultimately denominated in dollars for the World Bank’s calculations. In Georgia’s case, the Lari has dropped from around GEL 1.7 to the dollar in early 2014 to about GEL 2.4 to the dollar at the time of this writing. The value of the Lari was even lower for a time. In practice this has decreased Georgia’s GNI per capita figures to the point of knocking the country into a different income category.

Against the backdrop of population estimate revisions and fluctuating exchange rates, Georgia’s economy has been growing, albeit very slowly for a developing country in recent years. Georgia’s economy grew at an average rate of about 5.9 percent from 1995-2013; since 2014, it has grown at an average rate of 3.4 percent

The exchange rate fluctuation is hampering growth prospects. For one, rate volatility makes it harder for businesses to predict costs. In addition, many Georgians have dollar-denominated loans, while their incomes are in Georgian Lari. Although nominal salaries have slightly outpaced inflation, they have not kept pace with the decline in the Georgian currency’s value. Hence, debt payments consume a rising share of income for those trying to pay off dollar-denominated loans. The Georgian Government and National Bank are addressing this situation via a program that subsidizes the conversion of foreign-currency loans into Georgian Lari at a favorable rate.

While Georgia’s income group status has more to do with how the statistic is calculated than the actual state of Georgia’s economy, the changes have had clear implications. For instance, the Global Fund - an organization that has provided over USD 100 million to Georgia over the years to combat tuberculosis and AIDS - has different rules on aid for lower-middle-income and upper-middle-income countries. Meanwhile, a Brookings Institution study suggests that upper-middle income countries receive aid more often in the form of credits (i.e. loans) than grants when compared with lower middle income countries.

Some development organizations explicitly change lending terms when a country moves from lower middle to upper middle income status, although the World Bank itself does not. Hence, Georgia’s downgrading may have a silver lining, potentially leading to more aid opportunities.

But downgrading also has significant downsides. In political terms, it’s not good news for incumbents because it fosters an appearance among the population that the country is moving backwards. It also can impact the decisions of potential foreign investors. The demotion in status is unlikely to make Georgia a more attractive investment destination.


Friday, September 02, 2016

Trends in the Data: Declining trust in the banks in Georgia

The last few years have been turbulent for Georgia’s national currency, the Lari (GEL), the value of which started to decline in November 2014. While in October 2014 one US dollar traded for GEL 1.75, since February 2015 to date, the exchange rate has fluctuated between GEL 2 and 2.5 per dollar. Needless to say, the depreciation of the Lari has been widely covered by the media, and although it had numerous causes, a number of organizations and people were blamed for the devaluation. With this background in mind, this blog post looks at how reported trust in banks has changed in recent years in Georgia, using CRRC’s Caucasus Barometer (CB) survey data.

In 2015, for the first time since CB started asking the population about their trust in banks, more people in Georgia reported distrusting than trusting them. The decline in trust, however, started well before the GEL began to depreciate. While 27% reported trusting banks in October 2015, 53% did in October 2008.


Note: The original five-point scale was recoded into a three-point scale for this chart. Answer options “Fully trust” and “Trust” were combined into the category ‘Trust,’, while “Fully distrust” and “Distrust” were combined into ‘Distrust.’ “Neither trust nor distrust” was not recoded. The Caucasus Barometer survey was not conducted in 2014.

As is generally the case with trust in social and political institutions in Georgia, the population of rural settlements report less distrust in banks than residents of urban settlements. Nonetheless, since 2008, distrust in the banks in rural settlements has nearly tripled, from 11% in 2008 to 30% in 2015. In the capital, distrust has almost doubled during the same period.
 

Although there has been a decline in trust in the banks in recent years, this decline started before the devaluation of the Lari began in 2014. While the devaluation likely contributed to the decline in trust, the fact that trust began declining earlier shows that there is more to the story than the devaluation.
Given that the banking system, and trust in it, is crucial to the effective functioning of a country’s economy, the government of Georgia and banks themselves should consider efforts aimed at building trust in the banking sector.

What factors are at play in declining trust in the banks in Georgia? Join the conversation on the CRRC-Georgia Facebook page here, and to explore more data on Georgia and the South Caucasus, visit our online data analysis tool (ODA).

Monday, July 04, 2016

How Georgia became an upper-middle income country

A year ago, on this blog, we took a look at how Georgia had likely become an upper-middle income country because of the 2014 census. On July 1st, the World Bank announced that Georgia had indeed changed income categories, moving from lower-middle income to upper-middle income. Given the change, we thought it would be worth re-posting the blog post from last year discussing how Georgia became an upper-middle income country:


An interesting implication of the 2014 census: Georgia is likely an upper middle income country

While Georgia has yet to be officially declared an upper middle income country by the World Bank, as a result of the 2014 census, it’s likely to be labeled one after the final census results are published in April of 2016. Interestingly, Georgia likely became one in 2013. Why is this the case and what are the implications? Let’s take a look using the 2014 preliminary census data and a population model developed by Ilia State University’s Giorgi Tsuladze published in a 2014 United Nations Population Fund (UNPF) and International School of Economics at Tbilisi State University (ISET) report.

The 2002 census was way off

In 2002, the Georgian government carried out a population census and found that there were 4.37 million Georgians. This number though was and is widely considered to be suspect. According to the 2014 UNPF report (and notably, Geostat employees at the time), the main problem with the 2002 census was its method of counting the migrant population. Specifically, the 2002 population count included 114,000 migrants who may have been permanently settled abroad rather than temporarily. This number may have been even higher considering that an estimated one million Georgians left the country between 1990 and 2002. Their family members who were interviewed for the census may have been reluctant to report that their relatives had gone abroad and instead reported them as temporary migrants or still in the country for a variety of reasons.

Not only was the census off, but so too were the civil registries which count birth and death registration. Between censuses, governments update population counts based on birth and death registrations, but because many births in Georgia happened and to a certain extent still happen outside of hospitals, births are not always registered. Also important are the lack of death registrations.

Recognizing these problems, Giorgi Tsuladze, a Professor at Ilia State University, made a downward adjustment of the population figure from the 2002 census, an upward adjustment to the birth rate, and a decrease in the estimate of the average life expectancy to estimate the population. In turn, his estimates of the population are quite close to what the preliminary 2014 census results tell us about the Georgian population – there are about 3.7 million people in Georgia (excluding South Ossetia and Abkhazia).


Geostat population estimate (thou.)Tsuladze population estimate (thou.)
20024,3724,001
20034,3433,966
20044,3153,931
20054,3223,899
20064,4013,869
20074,3953,839
20084,3823,814
20094.3853,797
20104,4363,790
20114.4693,786
20124,4983,777
20134,4843,768

Source: Tsuladze, G.; N. Maglaperidze and A. Vadachkoria. 2002. Demographic Overview of Georgia. Tbilisi, UNFPA. Cited in
Hakkert, Ralph, Gulnara Kadyrkulova, Nata Avaliani, Eduard Jongstra, Lasha Labadze, Maka Chitanava, and Nino Doghonadze. Population Situation Analysis (PSA) 2014. Rep. Tbilisi: United Nations Population Fund, 2015. Print.

Income classifications

The second important part of this story is understanding how countries are classified into income groups. The World Bank classifies countries by Gross National Income per capita (slightly different than Gross Domestic Product per capita – see here for exact definitions).

Countries with a per capita GNI of less than $1,045 are considered low income countries. Countries with greater than $1045, but less than $4,125 GNI/capita are classified as lower-middle income countries. Countries below $12,736 but above $4,125 GNI/capita are considered upper middle income countries, and countries above the $12,736 mark are considered to be upper income countries.

Since, a country’s income classification is based on the size of its population, and as we saw above, Georgia’s official population size was inflated by a fairly sizable margin for the past twelve years, Georgia’s GNI per capita (as well as GDP per capita) was underestimated.

Georgia probably moved from the lower-middle income to the upper-middle income grouping in 2013 when GNI per capita moved from from $3914 in 2012 to $4240 in 2013 (based on Tsuladze’s population estimates). In 2014, using the preliminary census data, Georgia’s GNI was $4489/capita. Hence Georgia has very likely moved income groups, barring a major miscount of the preliminary census data of roughly 330,000 people.


Why does this matter?

Well, it is good and bad news for Georgia.

To start with the bad, aid is sometimes distributed based on a country’s economic status. There are many other important factors at play (see here for a discussion of the subject), but nonetheless it is often considered in aid decisions. Hence, Georgia may expect lower levels of aid in the coming years as its per capita economic statistics are adjusted upward following the finalization of the 2014 census in 2016.

When it comes to the good news for the country, Georgians are doing better than the numbers suggested. This does not change the facts on the ground and widespread poverty experienced in Georgia, but in the long run it can lead to a number of benefits. For instance, foreign private capital flows may increase as the country may be perceived as a more enticing investment environment, having moved to a higher income category.

The upward adjustment will also be important for Georgia’s Euro-Atlantic integration prospects. One of the key factors which the EU has identified as a barrier to prospective membership for countries in its neighborhood is low income levels, and as Georgia’s income level gradually increases, it will make Georgia a more attractive partner country. Notably, the lower population also means that per capita income is increasing at a higher rate than previously thought. In the short term, it may also help ease fears over migrant flight from Georgia (which is likely an inhibiting factor at present for Georgia in the EU visa liberalization process). It is important to note that if income inequality persists in Georgia, economic growth is unlikely to deter migrants from attempting to make their way to the EU, though a fuller treatment of this subject is beyond the scope of this post.

On the grand scheme of things, the adjustment is good as well. While not necessarily good for Georgia, countries in more dire straits may receive more aid that would have been aimed at Georgia. Better decisions about what kind of aid the country receives may also result from the more accurate data and income categorization.

Although we should not expect to see the official income categorization change to upper-middle until after Geostat has published the final census numbers and adjusted its population estimates for 2002-2014, it should occur in the next few years.

To take a look through the preliminary 2014 census results, take a look here, and for the estimates of the population size which this blog is based on as well as other interesting data and analysis on Georgia’s demographic situation, take a look at the UNPF/ISET report, here. Notably, Georgia is not the first and surely not the last country to have a major economic indicator readjustment based on something besides economic growth. Ghana and Nigeria both have had large changes to their economic indicators in recent years caused by how GDP was calculated rather than growth with interesting implications. Listen to this Planet Money story to find out more.