Showing posts with label Social Capital. Show all posts

Tuesday, April 04, 2023

Shifting Tides: Changing Dynamics of Social Capital in Georgia and Armenia

Note: This article first appeared on the Caucasus Data Blog, a joint effort of CRRC Georgia and OC Media. This article was written by By Milord Shengelia, a Junior Researcher at CRRC Georgia. The views expressed in the article are the author’s alone and do not reflect the views of CRRC Georgia or any related entity. 

Both Georgia and Armenia are known for being close-knit, but levels of social ties and trust vary both between the countries and between demographics. And while levels of trust have increased in Armenia in the last decade, in Georgia, the opposite is true.

Past research has suggested that both Georgia and Armenia have high levels of bonding social capital — levels of trust within a family and community — but low levels of bridging social capital — the ability to make bonds with people outside one’s immediate circle.

However, recent data from the Caucasus Barometer shows that while in Armenia some measures of bonding social capital have risen significantly in the decade between 2011 and 2021, the same characteristics have remained largely stagnant in Georgia.

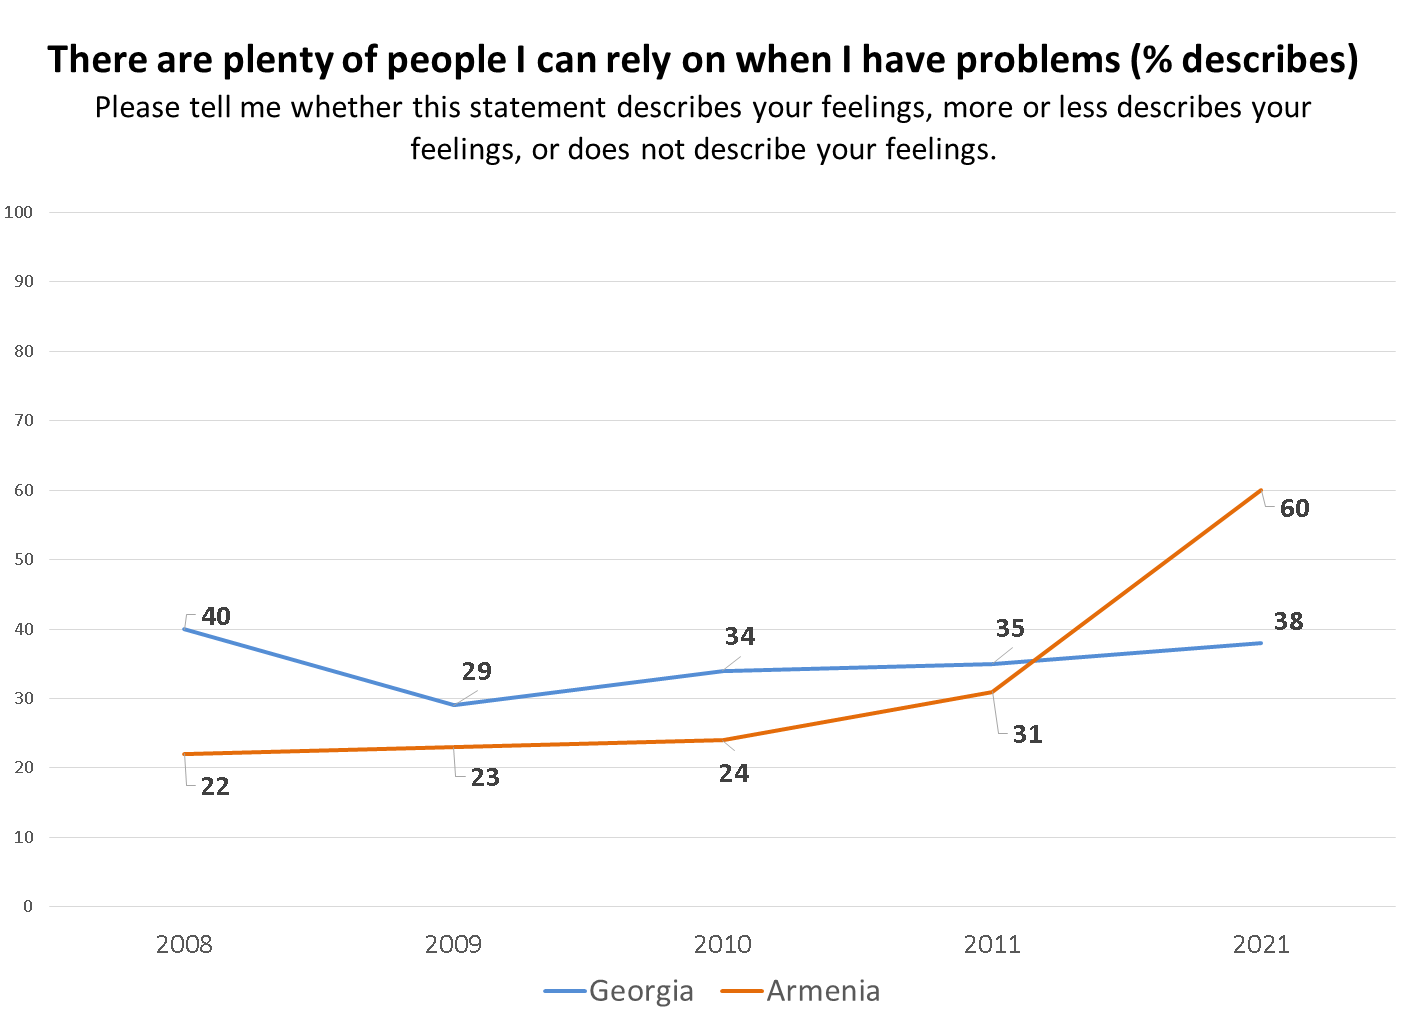
One measure of social capital is whether people feel that they have people that they can rely on when they have problems.

The share of the Georgian population who say that they have people they can rely on has varied slightly over the years, but remained between 34% and 40% between 2008 and 2021. The exception was a low of 29% in 2009, a year which is a relative outlier for Georgia.

In Armenia, however, respondents have increasingly felt that there are people that they can rely on, with this share doubling from 31% in 2011 to 60% in 2021.


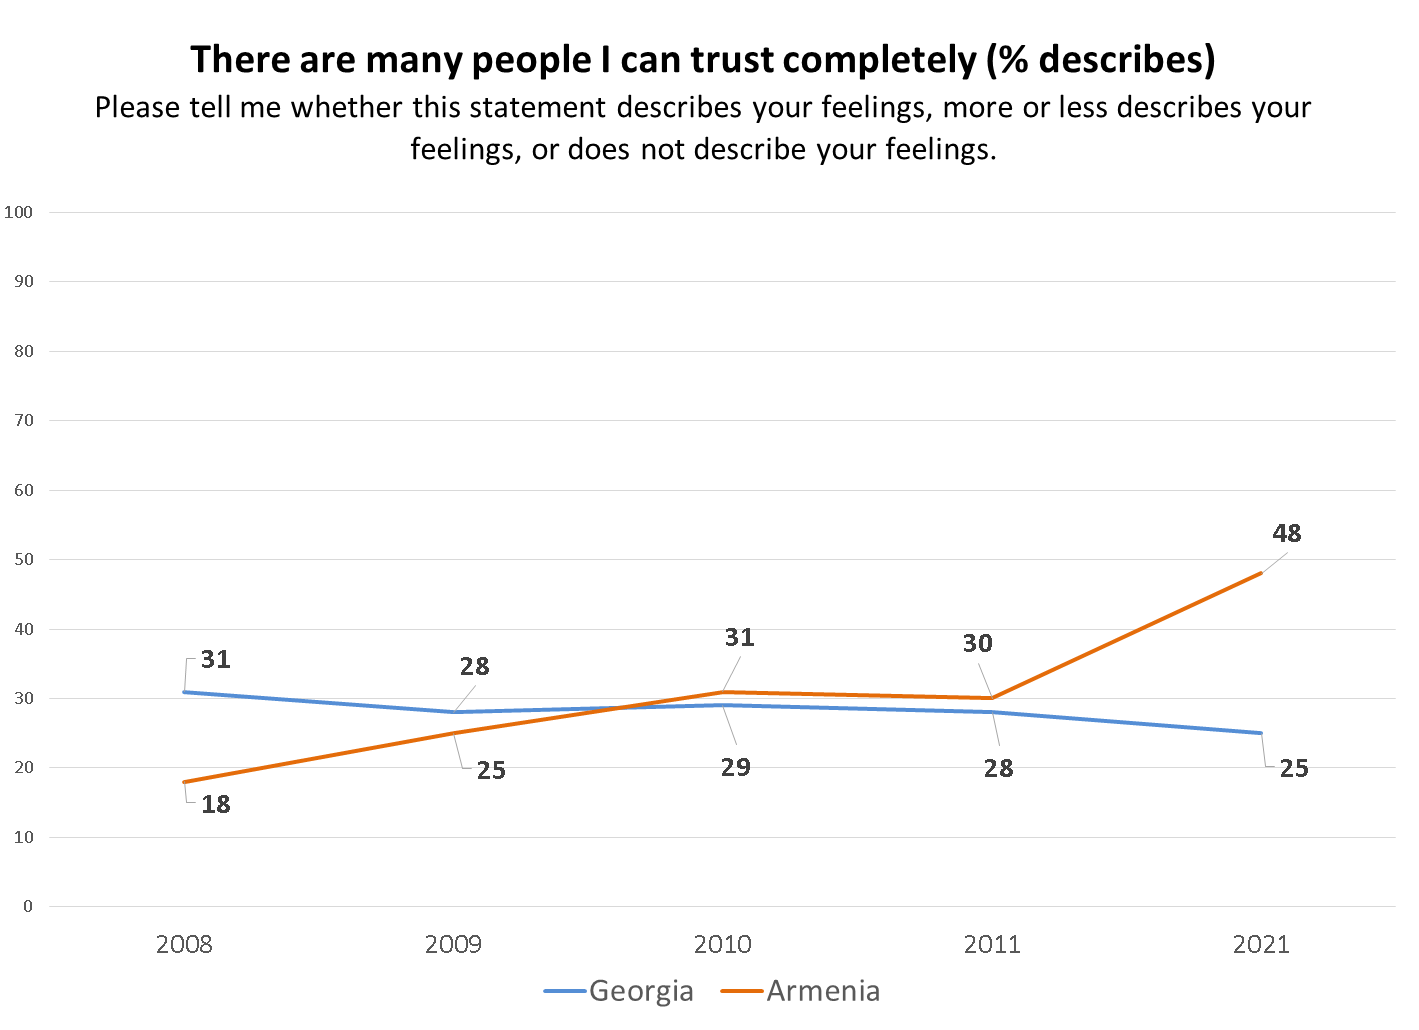
The data show a similar pattern with regard to the statement, ‘There are many people I can trust completely’.

In 2008, 31% of the Georgian public reported that this described them, compared to 18% in Armenia. Since then, however, the situation has reversed, with 25% of the public in Georgia reporting this in 2021, compared with 48% in Armenia.


The relative levels of social capital which people report is associated with a number of demographic characteristics in Georgia and Armenia.

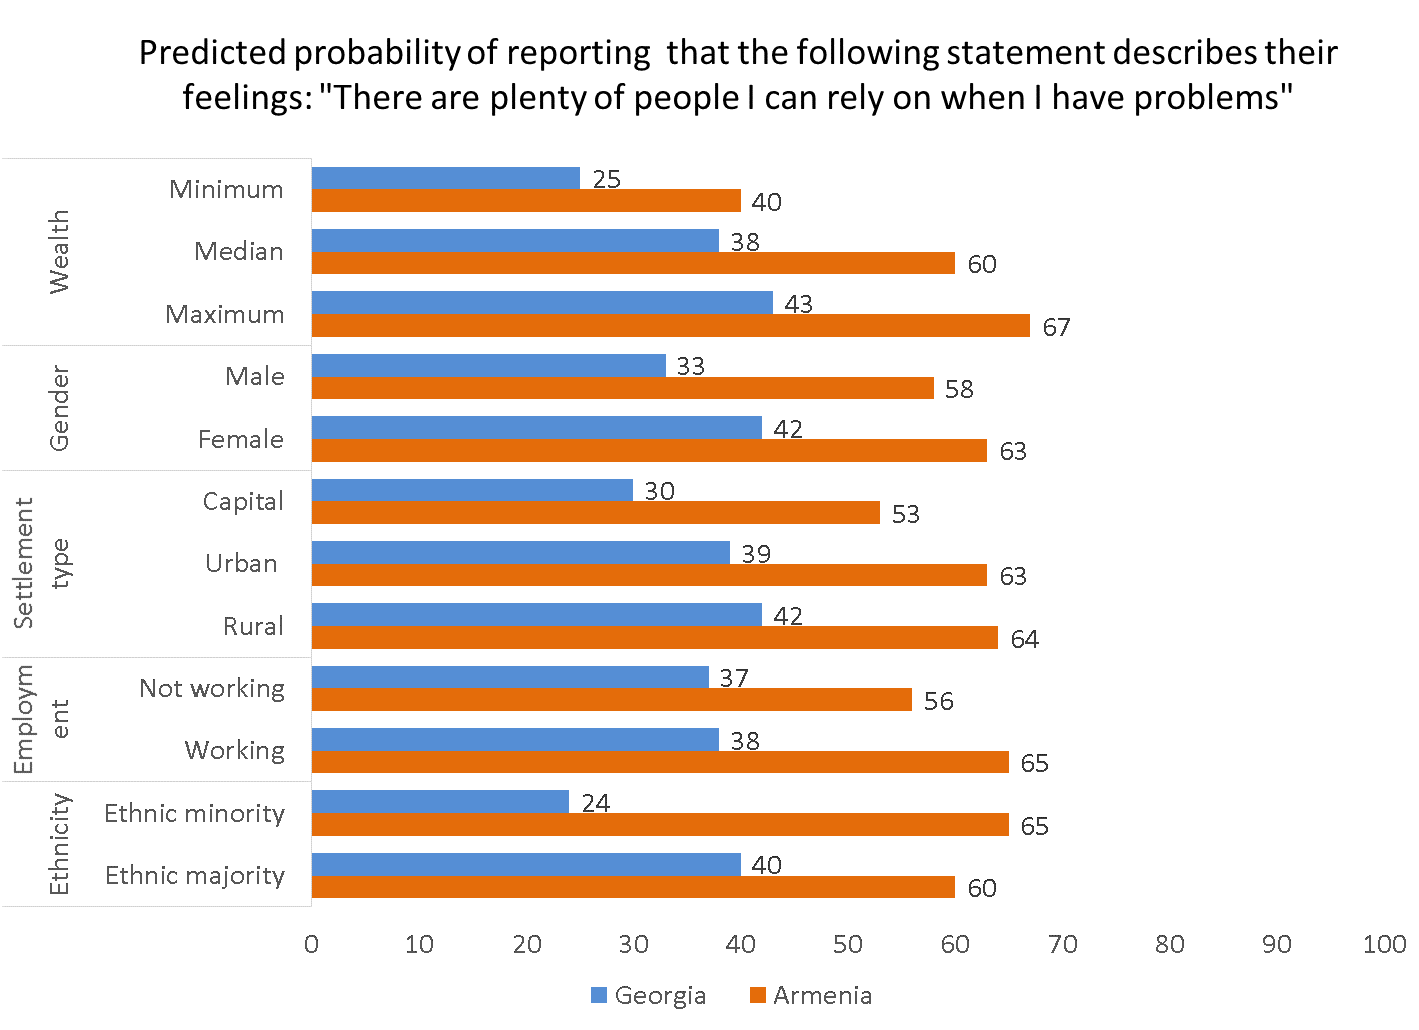
A regression model shows that in both Georgia and Armenia, people outside of the capital cities are more likely to say that in times of trouble, they have many individuals they can turn to than those living in Tbilisi and Yerevan. Similarly, wealthier people are more likely to believe they have people to rely on in both countries.

In Georgia, women are more likely to report they have plenty of people to turn to when faced with problems. In Armenia, gender is not associated with responses to this question.

In Georgia, ethnic Georgians were more likely to agree compared to ethnic minorities. Due to the small number of people of ethnic minority descent in Armenia, only a small number were present in the sample. Consequently, the same association was not tested in Armenia.

Employed people in Armenia, but not Georgia, are more likely to feel there are people they can rely on. Age and education are not associated with responses to this question in either country, controlling for other factors.

Regarding how much people feel they can trust others, in Georgia, this is associated with both where someone lives and their sex.

Men are more likely to say that there are many people they can trust completely compared to women, while people who live in Tbilisi are less likely to report people can be trusted, compared with people in other urban and rural areas. There were no differences associated with age, education, employment, or ethnicity on this question.

In Armenia, wealth is a significant predictor of trusting others. Wealthier respondents were more likely to indicate that there were many people they could trust completely. In Armenia, no other variable was associated with this statement.


Over the last decade, the dynamics of social capital in Armenia have undergone a transformation, while in Georgia they have remained stagnant. While Georgian people had more social capital in the past, today Armenians are more likely to have stronger bonding social capital.

Note: The results presented in the above chart came from regression model of the CB 2021 wave. The regressions included the following variables: sex (male or female), age group (18–34, 35–54, 55+), settlement type (capital, urban, rural), ethnic group (ethnic majority or ethnic minority), educational attainment (secondary or lower, secondary technical, higher than secondary), employment (working, not working), wealth (ownership of 14 different durable goods, a common proxy for wealth).

The views expressed in this article reflect the views of the author alone, and do not necessarily reflect the views of CRRC Georgia, or any related entity.
Monday, March 19, 2018

Temporary emigration intentions from Georgia: Do migration networks count?

The UN estimates the number of international migrants worldwide to be on the rise. Academics and policy makers continue to pay considerable attention to drivers of international migration, i.e. the factors that cause people to move from their home country, either temporarily or permanently.  While a significant body of scholarship exists on the structural ‘push’ factors of international migration, such as limited economic opportunities, poverty, poor governance, or war in migrants’ home countries, interpersonal factors are no less important in shaping migration.  This blog post investigates the latter, seeking to examine how individuals in Georgia with and without close friends and family living abroad differ in their willingness to emigrate from the country temporarily. 

Studies have been conducted that demonstrate the impact of personal networks on migration behavior.  One central theory guiding these studies is the ‘migration network theory,’ which posits that the reduced social, economic, and emotional costs of migration stemming from existing contacts who are able and willing to help new migrants ultimately ease migration, and, to a certain degree, promote it. Understanding migration networks permits a more comprehensive view of migration as a dynamic process, rather than a mechanical outcome of economic or political deprivation.  Migration networks include family, friends, neighbors, and former colleagues — essentially anyone an individual can rely on and share information about opportunities abroad, including settlement assistance.

Emigration has been an important coping strategy for the population of Georgia since the dissolution of the Soviet Union. CRRC’s Caucasus Barometer survey data from 2010 through 2017 indicates that the share of people in Georgia willing to temporarily emigrate has increased slightly.  In CB 2017, 55% of the adult population of Georgia responded ‘yes’ to the question: “If you had a chance, would you leave Georgia for a certain period of time to live somewhere else?”  In 2010, this share was 47%.


CB also asked two questions that can help see individuals’ temporary migration intentions in light of the migration networks they might have.  Of those who had a close relative living abroad at the time of the survey, 59% responded that they would leave Georgia temporarily to live somewhere else.  In contrast, only 40% of those without close relatives living abroad responded that they would emigrate temporarily. Similarly, individuals who reportedly had a close friend abroad were more likely to report a willingness to temporarily emigrate than those who did not. It is still important to mention, though, that about 40% of those not having a close friend or relative abroad still report willingness to temporarily emigrate from the country.


The findings presented in this blog post suggest, in accordance with the migration network theory, that social networks may play a role in people’s willingness to temporary emigrate from Georgia. Individuals with a close contact who was living abroad at the time of the survey were more likely to respond that they would leave Georgia for a certain period of time to live somewhere else.  It should be emphasized, however, that CB does not present data on actual emigration, but rather reported intentions that may or may not result in individual actions.

To explore the data used in this blog post further, visit our Online Data Analysis platform.


Monday, August 28, 2017

Helping in Georgia: A myth confronted

There are a number of persistent myths about the population of Georgia, with some of the most famous being about hospitality and readiness to help others. As with any myth, it would be quite impossible to say exactly where such beliefs come from. However, relevant survey data often allows for the testing of whether these myths are accurate or not.

CRRC’s 2015 Caucasus Barometer survey findings make it possible to get quite specific information about whether and how people in Georgia help others – from donating money to a church or mosque to helping a neighbor or a friend with some household chores or childcare. This blog post compares how similar or different reported behavior is in the case of non-monetary vs. monetary help (donations), with the latter being asked separately about religious and non-religious charity. As the findings show, there are no drastic differences in the reported level of involvement in these activities.


For a society that praises “helping others” and, according to a widely cited CRRC report, is characterized by an “abundance” of bonding social capital, the share of the population that reported having helped others is unexpectedly small. Even in villages, where, intuitively, mutual help would be expected to be the most widespread, only 63% reported having helped neighbor(s) or friend(s) in the six months prior to the survey. This share is the lowest in urban settlements outside Tbilisi, with just around half of the population reporting having helped neighbor(s) or friend(s). Overall, men report helping others slightly more often than women, as do those in the youngest age group. This share is 67% among those who are between 18 and 29 years old. Among those who are 65 or older, the respective share is almost half of that, at 37%.

Importantly, helping others with household chores or childcare is an activity that does not require any direct monetary investment, and thus it is very different from the other forms of help CB asked about – donating money to a religious or non-religious cause. In a society like the Georgia’s, where almost 2/3 of the population report they need to borrow money to buy food at least occasionally, the economic situation will inevitably influence the population’s potential to donate money to a cause, even if people strongly support it. Still, and quite surprisingly, the share of those who reported having donated money to a church or mosque in 2015 is not any different from the share of those who reported having helped others with household chores or childcare. The demographic profiles of these two groups are, however, slightly different. For example, there are no obvious gender differences in the case of religious charity, and the population of the capital reported having made such donations more often (62%) than the population of other settlement types. Similar to the case with non-monetary help though, those who are 65 years old or older are the most passive in the case of religious donations.

Only 67% of those who reported having donated money to a church or mosque reported to have also helped others with household chores or childcare. Slightly less, about 2/3, of those who reported having donated money to a church or mosque also reported having made a contribution to a non-religious charity, including donations by sms or giving money to beggars.

With monetary donations, a person’s economic situation does not seem to be solely conditioning whether s/he would actually donate money or not. Even when people report they needed to borrow money for food, some still say they have donated money for either religious or non-religious charity – often at a rate similar to those who report being better off. Of those who said that it happened at least on a monthly basis in the past 12 months that they did not have enough money to buy food, equal shares (49%) reported having donated and not donated money to a church or mosque. As for non-religious monetary donations, however, the situation is rather different. Only 38% of this group reported having made a contribution to a non-religious charity (including donations by sms or giving money to beggars) and a larger share, 60%, reported not having done so. Involvement in non-monetary help was reported at the same level by people of different reported levels of well-being.


 Note: The category “At least every month” combines the original response options “Every day”, “Every week”, and “Every month”.

Leaving aside the relatively low involvement of the population of Georgia in a variety of activities aimed at helping others, there are understandable differences by one’s economic situation when it comes to monetary vs. non-monetary help. People of different levels of well-being report very similar, albeit rather low levels of helping neighbors or friends with household chores or childcare. When it comes to monetary help, however, economic well-being obviously makes a difference, but less so in the case of religious charity. Although the answers may partially be subject to social desirability bias, the behavioral patterns reported in cases of religious and non-religious charity are unlikely to be explained by such a bias alone.

CRRC’s Caucasus Barometer and other survey data is available at our Online Data Analysis portal.

Monday, December 28, 2015

People to rely on - Georgians and their social networks

[In this last blog post of 2015, CRRC Researcher Tamuna Khoshtaria reflects on one the most important aspects of Georgian society – people to rely on, i.e. relatives, friends, neighbors.]

When I was studying in Germany, the dormitory’s housekeeper told me: ‘I have seen students of many nations coming here to live, and many of them were homesick at some point, but for Georgians, it has always been the hardest to live abroad.’

He had a point. Now, almost ten years later, what keeps me in Georgia are, for the most part, my friends and the people I can rely on – my social circle. Many people around me feel the same way. The findings of CRRC’s 2014 survey on Volunteerism and Civic Engagement let us see how valuable social networks of friends, relatives and neighbors are for Georgians.

The overwhelming majority of Georgians (92%) say they have close friends. Of these, 21% report getting together with their close friends every day, 34% at least once a week, and a further 22% at least once a month. If we break down the data by gender, we see that compared to females, slightly more males manage to meet with their friends on a daily basis (24% vs 18%). Also, young people (18 to 35 years old) manage to get together with friends more frequently than those who are older (30% vs 16%).

At the same time, most people in Georgia are quite open to new friendships: 73% disagree with the statement that they already have many friends and do not need to make new friends. Roughly the same share (74%) agrees with the statement that they enjoy meeting new people.

Half of the Georgian public reports they have not gained new friends during the last 12 months. For those who did though, new friends are most often found through the old ones.

 
Note: Respondents could select more than one answer option.

Close relatives are another important part of social networks. Half of the Georgian population reports seeing close relatives who do not live in the same household at least once a month. The majority (66%) say they always or often discuss private problems with them.

Neighbors represent another important part of Georgians’ social networks. Fifty-six percent of the population says they know all the neighbors in their neighborhood. Another 24% says they know more than ten families in their neighborhood, and only 17% knows ten or less families. The share of those who know all of their neighbors is higher in rural settlements (68%), in the big cities (57%) and in other urban settlements (66%), compared to Tbilisi, where only about a third of the population (34%) report so.

Knowing their neighbors implies talking to them, and 64% of Georgians say they talk with their neighbors every day. Another 25% say they talk at least once a week. These talks with neighbors quite often turn into discussing different issues. Twenty-nine percent report always or often discussing common problems in the neighborhood, and 23% say they always or often discuss politics with their neighbors.

These results show that Georgians do not lead isolated lives. They have people around them whom they can trust and count on when it comes to good and bad times. Half (52%) of Georgians agree with the opinion that there are plenty of people they can rely on when they have problems, and 74% say there are people who would look after them if they needed to, without expecting any compensation. Importantly, this support seems to be a two-way street, as 64% of Georgians also say they can be helpful to many people outside of their families.

The people we are around and who we rely on could be the main motivation for many Georgians to stay in the country, even when there are possibilities to emigrate and improve one’s living conditions. Though it is hard to talk about others – I know I am one of those Georgians.

To learn more about the social networks of the Georgians, take a look at the data used in this post using our Online Data Analysis tool, here.

Thursday, January 22, 2015

A taxi driver’s tale, Part 2: The poverty of social status in Georgia


Looking at the association between an individual’s social status and his/her standing in the labor market, the first part of this blog post concluded that higher labor market mobility is characteristic for people with high social status, and that those with high social status have better chances of finding an attractive job. Yet, the question remains whether people with higher social status actually live better lives i.e., enjoy economic well-being and have better perceptions about their and their children’s future. To answer this question, this blog post examines how social status is associated with individual and household well-being. Data again comes from CRRC’s 2013 Caucasus Barometer (CB) survey.

According to Geostat, the subsistence minimum in Georgia was GEL 137 in 2013 (approximately USD 80). CB 2013 asks a question about personal income last month, but the answer options are given in categories (income ranges). The subsistence minimum of $80 falls into the category between $51 and $100. It is used in the blog post as a reference category to compare, on the one hand, individuals with higher incomes and, on the other hand, individuals with lower incomes. The group of respondents reporting not having personal income are considered a separate group.

As expected, social status is positively associated with personal income. Almost half of the representatives of the high social status group made more than $100 last month, whereas only 30% of the low status group and 36% of the middle status group managed to exceed the same threshold. Interestingly, the no income category prevails in the high and middle social status groups. One in every three people in these groups reports having no personal income compared to one in every four in the low status group.

Unsurprisingly, the higher its social status, the more money a household spends. Geostat reported GEL 900 (approximately USD 500) as average monthly household expenditures in 2013. In CB’s corresponding question, this falls into the category between $401 and $800. Again, this is used as a reference category to differentiate households spending more than the average from households spending less than the average. A higher social status is still positively associated with higher spending. However, the overall economic condition of Georgian households looks quite poor. As the chart below shows, even in the high social status group, the majority of households spent under $401 last month, and only 19% spent more than the reference category. In the low social status group, almost everyone (91%) spent less than the reference category, meaning that the low status group households spend significantly less than Georgian households on average.


The poor economic condition of the majority of the Georgian population is confirmed by CB questions about personal savings and debt. The vast majority of Georgians do not have savings, regardless of their social status. However, the high social status group (17%) is almost twice as likely to have some savings compared with members of the low (8%) and middle (9%) status groups. Likewise, money is more often owed to the representatives of the high status group (25%) compared to the middle and low status group members (18% and 12% respectively). The data does not show significant differences in terms of personal debts. Approximately 40% of each group reports owing money.

So far, it has been demonstrated that high social status is helpful to overcome economic hardship, but does not guarantee it. The reported gap between a household’s income and the amount of money it needs to cover its basic needs reinforces this statement. Half of the high status group representatives affirm that during the past 12 months there were occasions when their household did not have enough money to buy food. In the middle and low status groups, more than 70% reported the same. Moreover, the majority of the middle and low status groups and 40% of the high status group had to borrow money to cover utilities in the past six months.

The chart below shows that even representatives of the high social status group can largely satisfy only basic needs. Half reported that money is enough for food and clothes, but not for expensive durable goods (a new refrigerator or washing machine, for example). In the low status group, 35% stated that money is not enough even for food. Interestingly, a quarter of the middle and one in every ten of the high status group report facing the same problem.


It is not surprising that the poor economic realities of households are reflected in perceived place on an imaginary economic “ladder”. The chart below shows that only 19% in the high social status group perceive their household’s economic rung as high (45% place their households on the middle rungs and about one third towards the lower end). In the middle and low social status groups, the majority believes their households stand on the low rungs (46% and 54% respectively).

Note: Original answers were on a 10-point scale. For this graph, answers were re-coded as follows: rungs 1 through 4 – Low, rungs 5-6 – Middle, rungs 7 through 10 – High. 

At the same time, belonging to a higher social status group helps people to be more optimistic – 71% of the high status group believes that they will be better off in five years. Despite pressing current economic conditions, the other two groups are also quite optimistic – 57% of the middle and 43% of the low status group believe in a better future. Optimism absolutely flourishes, and the relevance of current social status fades when individuals contemplate their children’s future. Over 90% of all social status groups believe in a brighter financial situation for their descendants. Notably, all three status groups agree that the most important factor that will contribute to the well-being of the next generation is education.

This blog post described how social status is associated with economic well-being and perceptions about the future. The most important message to the taxi driver is that a higher social status in contemporary Georgia leads to more mobility on the labor market, as well as relatively higher income and spending. However, social status alone is hardly enough to overcome poverty and substantially improve well-being. Perhaps this explains why a man with more than one university diploma chooses to continue driving a taxi.

Monday, January 19, 2015

A taxi driver’s tale, Part 1: Social status in the Georgian labor market


Taxi drivers tell perhaps the most telling story of Georgia’s economic transition. They often complain that the transition made their high social status useless, thus pushing them into taxi driving. This often heard and mocked complaint highlights the contrast between what is expected from and what is delivered by the labor market. Taxi drivers expect their social status to remain at work in economic life, while the mockers believe that social status has no relevance for Georgia’s current labor market. Based on CRRC’s Caucasus Barometer (CB) survey data, this blog post shows that the taxi drivers are not entirely wrong. According to 2013 Caucasus Barometer survey, higher social status is associated with a higher likelihood of employment, a better job, and greater mobility on the labor market.

The taxi drivers often “operationalize” their social status as having a diploma or two from one or more higher educational institutions. In Georgia, another common cue to signal high social status is family background, normally operationalized in the same way. Not only are these two cues at the core of the taxi driver’s tale, but notably, the same characteristics often prevail when traditionally selecting a favorable bride or groom. Hence, the two cues fit the Weberian understanding of social status as perceived prestige and esteem that is related to economic relations, but cannot be reduced to it.

Following the taxi drivers’ perspective, this post proposes a simple index of social status, which includes two components: (1) respondent’s level of education, and (2) level of education of the respondent’s parents. In both cases, education variables are recoded so as to have three categories: (1) secondary or lower education, (2) secondary technical education, and (3) incomplete or complete tertiary education.

The index is a simple sum of these indicators and hence, it ranges from 0 to 4. At the highest extreme of the index stands a person with tertiary education having at least one parent with tertiary education (score 4). A person without any of these characteristics stands at the lower extreme of the continuum (score 0). Individuals with scores between the extremes are counted as having middle social status. As shown below, more than half the population belongs to the middle status group, whereas 28% and 19% fall into the low and the high social status groups respectively.  


Looking at the distribution of social status groups across settlement type, age and gender, it is notable that 39% of Tbilisi residents are in the high status group compared to only 7% of residents of rural areas. Low (42%) and middle (51%) status groups are predominant in rural areas. Urban settlements outside the capital have the highest percentage of the middle status group (62%). Interestingly, no important differences can be observed by gender. Younger cohorts tend to have higher education as well as more educated parents compared to older cohorts, and are thus more likely to belong to a higher status group.  

But, does social status have implications for an individual’s standing on the labor market? The Caucasus Barometer uses several questions to measure respondents’ employment status. While those who are employed or self-employed are identified using one survey question (“Which of the following best describes your situation?” with answer options including “Working either part-time or full-time” and “Self-employed”), identifying the unemployed is a trickier affair. To do so, it is necessary to separate those who do not work by choice and those with physical constraints to labor force participation from those who do not work resulting from a failure to find a job, i.e. the unemployed. To identify the latter group, a combination of two questions has been used - is the respondent interested in a job and if so, is he or she ready to start working within two weeks if a suitable job were available. Respondents who do not meet these two conditions are not formally unemployed and are not counted as part of the active labor force.  

From cross-tabulating an individual’s social status and his/her employment status, it is evident that the plurality of the low status group is out of the labor force (34%) or unemployed (29%). In contrast, the plurality of the high status group is employed (43%). However, it is noteworthy that one in three of the high social status group is unemployed (35%), while almost half of the individuals with low social status, on the other hand, were never employed.


Thus, the higher the individual’s social status, the higher his/her employment chances. Moreover, the status group a person belongs to indicates his/her occupational status. More than half of the high social status group works in high status positions, i.e. managers and professionals. A plurality of the low social status group (41%) works as unskilled laborers (elementary occupations, sales people, and baby sitters). Nonetheless, the majority of the low and middle status group enjoy mid-level occupations, such as technician, clerk, or skilled agriculture worker.

Note: The variable used to measure occupational status is JOBDESC. Respondents were asked, “Which of the following best describes the job you do?” Suggested answer options included: Manager; Professional; Technician / Associate professional; Clerical support worker; Service / Sales worker; Skilled agricultural / Forestry / Fishery worker; Craft and related trades worker; Plant and machine operator / Assembler; Elementary occupation; and Armed forces occupation. For this blog post, the options “Manager” and “Professional” were combined into the category ‘high’. “Armed forces occupations”, “Plant and machine operators”, “Craft and related trade workers”, “Skilled agricultural workers”, “Clerical support workers”, and “Technicians” were combined into the category ‘middle’, and “Elementary occupations” and “Service/sales workers” were grouped into the category ‘low’.  

Social status is also associated with employment sector and type of work for those who work. People who belong to the high status group rarely own businesses (18%) and are generally either state employees (41%) or employees of private companies (40%). At first glance it may seem paradoxical that those in the lower status group are more likely to own a business (55%), however, taking a closer look at Georgian reality makes it clear that these business owners are mostly self-employed agricultural workers or petty traders. Those in the middle status group are more or less equally distributed between the public, private and self-owned business sectors. As noted, people belonging to the low and middle status groups are more likely to work in agriculture (40% and 19% respectively). Individuals in the high status group are employed by educational institutions (24%) more often than in any other sector.

Importantly, the data shows that the Rose Revolution marked an important threshold for the Georgian labor market. The majority of employed individuals of all status groups started working at their primary workplace after 2004. This year perhaps also marked an important shift in the structure of the economy as 46% of the high and 33% of the middle status groups lost their job after 2004.
Not only are high status individuals more mobile, but so too are their household members who were more than twice as likely to find a new job in the last 12 months compared to the household members of individuals belonging to the low status group (16% vs. 7%). However, exactly the same was true about losing a job in the last 12 months – household members of those in the high status group lost jobs twice as often as those in the low status group.

This blog post has shown that the taxi driver’s tale of frustration has an observable underpinning – social status, operationalized as an individual’s and his/her parents’ education, is associated with an individual’s standing on the labor market. People belonging to the high status group are more likely to be employed, generally have better jobs, and exhibit greater mobility on the labor market. Hence, the preliminary conclusion drawn from this blog post is optimistic for the taxi driver, who perceives his current job as inferior to his status. If he belongs to a high social status group, he is more likely to find a better job. The second blog post in this series will describe how social status is related to household income and spending, as well as an individual’s perceived economic rung.

Monday, January 05, 2015

Voter Participation and Civic Engagement in Georgia and Armenia


How individuals engage with those around them is a crucial part of civic life, and people in all societies practice certain forms of civic engagement. There are various approaches to measure civic engagement. The OECD refers to voter turnout as the “best existing means of measuring civic and political engagement,” because it considers those who vote more likely to participate in the political process in other ways. Thus, voter turnout can serve as a “proxy for civic and political engagement.” This blog post draws upon official electoral statistics and public opinion survey data from the CRRC Caucasus Barometer (CB) survey to analyze expressions of civic engagement in Armenia and Georgia. Specifically, it looks at reported involvement in volunteer activities, attendance at public meetings and religious services, and positive attitudes toward public criticism and protest of government actions in order to look at how closely voter participation corresponds to other measures of civic engagement in these countries. 

Considering that Georgia is a parliamentary republic, and Armenia is a semi-presidential republic, elections for these institutions would expect to attract the highest turnouts. According to the Georgian Central Election Commission, the 2012 Parliamentary elections brought 61.31% of registered voters to the polls, while according to the Central Electoral Commission of Armenia, the 2013 Presidential election saw a 60.05% turnout.  Hence, Georgia and Armenia had nearly identical voter turnout, although irregularities and a lack of transparency in vote counts were reported in Armenia’s 2013 elections, possibly increasing turnout figures. 

How does electoral turnout match up with other forms of civic engagement? In 2013, Armenians (31%) were more likely than Georgians (19%) to report performing “volunteer work without compensation” during the past six months. Notably, participation in volunteer activities represents a form of civic engagement beneficial for the construction of bridging social capital, which helps foster social trust and cooperation. Only 17% of Georgians and 9% of Armenians reported attendance at a public meeting during the past six months. As for frequency of attendance of religious services, Georgians were also slightly more likely to indicate regular attendance: 43% reported attending religious services at least once per month, compared to 32% of Armenians. 


Citizens also engage with society by expressing criticism or protesting the actions of government. In the words of Harrop A. Freeman, protest actions have historically been a “means of effectuating change within the law when law’s normal procedures were inadequate,” and thus represent an active form of engagement. In measuring public attitudes toward – but not necessarily actual participation in —protesting and criticism of government, CB asks respondents, “Which of the following statements do you agree with: ‘People should participate in protest actions against the government, as this shows the government that the people are in charge,’ or ‘People should not participate in protest actions against the government, as it threatens stability in our country?” 71% of Armenians and 52% of Georgians agreed with the first statement. When asked, “How important or unimportant it is for a good citizen to be critical towards the government?” 58% of Georgians and 41% of Armenians reported the belief that it is important for a good citizen.

Georgians and Armenians participate in elections at almost the same rate, but Georgians are more likely to think that a good citizen should be critical towards the government. They are also more likely to have attended a public meeting over the past six months and to have attended religious services at least once per month, important indicators of bridging social capital. Armenians are more likely to express the belief that people should participate in protest actions as well as more likely to have done volunteer work during the past six months. Thus a strong conclusion cannot be drawn from the data at hand as to whether Armenians or Georgians demonstrate more civic engagement overall. 

For more information on civic engagement in Georgia and Armenia please consult the CRRC’s Online Data Analysis tool. For additional analysis of civic engagement, refer to the OECD’s Better Life Index.

Thursday, December 04, 2014

SME Performance in Georgia and Armenia: Part 2

As discussed in the first blog post of this series, the results of the CRRC Caucasus Barometer (CB) survey show that Georgians demonstrate higher levels of interpersonal and institutional trust than Armenians.  These types of trust are important indicators of social capital, which is often taken as a necessary condition for the presence of a robust, productive entrepreneurial class and small and medium enterprise (SME) sector. While Georgians express higher levels of trust in their fellow citizens as well as in formal institutions such as the judiciary and Parliament, economic data shows that the country’s SME sector suffers from a dearth of productivity. This blog post looks at survey data shedding light on economic conditions in Georgia and Armenia as well as policy research on the state of SMEs in each country, finding impediments to rural development and the high cost of financing to be potential causes for the relative lack of productivity by Georgian SMEs.

Productivity of the SME sector (defined as value added per employee) is significantly lower in Georgia when compared to Armenia. Emblematic of the lack of productivity in Georgian SMEs is the preponderance of small-scale agriculture. Many legally designated “small enterprises” are in fact subsistence agriculture proprietorships with little or zero cash turnover, a situation which Rudaz 2012 refers to as “entrepreneurship by default.” A report from the International Fund for Agricultural Development found that as late as 2005, 83% of rural households were dependent entirely on subsistence agriculture and that a “typical” rural household consumed 73% of what it produced. By 2013, however, the CB found that 59% of rural Georgians reported receiving household income from the sale of agricultural products, indicating an existence at least slightly above subsistence level agricultural production.  On the other hand, 27% of Georgia’s rural inhabitants reported no household income from salaries or sales of agricultural products. Rural Armenians are somewhat less likely to sell agricultural products (50% reported household income from this source), but more likely to receive salaries. However, 25% percent of rural Armenians responded “no” to their households having received income from either source. Thus one cannot decisively discern from the data at hand whether rural Armenians are more likely to receive cash income than rural Georgians.

The first blog post of this series determined that available measures of social capital appear to be insufficient to explain differences in SME productivity between the two countries. So, what are possible causes for the lack of productivity gains in Georgia’s SME sector? With regards to agricultural SMEs, a potential culprit mentioned in the previous installment of this series is the fragmentation of agricultural land, with the average private holding in the country being only 1.25 hectares. The consolidation of small plots into larger and more efficient commercial farms has been impeded by an inefficient system of land registration and poorly defined property rights. Restrictions on the purchase of agricultural land by foreigners and foreign-owned businesses have also precluded potentially productive investment in the sector. While the Constitutional Court struck down a law banning land purchases by foreigners in June, 2014, a new draft of the law will allow private foreign persons and foreign companies established in Georgia to purchase plots of up to 100 hectares. Fragmentation is a problem in Georgia, but it also bears mentioning that the average private plot in Armenia consists of 1.3 hectares, scantly larger than in Georgia. Land fragmentation appears to be an obstacle to the growth of Georgia’s SME sector, but it doesn’t appear to be a decisive one. 

As for palpable factors which may explain the lack of growth by both Georgia’s agricultural and non-agricultural SMEs, the difficulty of obtaining financing should not be overlooked. The average interest rate spread in Georgia (the difference between the interest paid on deposits and the interest charged on loans) is 11.3%, the highest spread of the former Soviet republics and significantly higher than the average spread of 7.3% in Armenia. This means that the cost of borrowing outstrips the incentive to save, with the result being that an entrepreneur in need of financing to buy land and equipment or hire employees is faced with very high borrowing costs. In Armenia, this problem occurs but on a smaller scale.

The high cost of financing stems in part from the lack of collateral held by SMEs, which discourages lending. Rudaz also reports the existence of a “law giving tax authorities the right to use the collateral of tax payers who owe money to fiscal authorities,” which allowed the tax authorities to seize the collateral of those owing back taxes. To be more specific, in cases in which a person has outstanding debts to both the tax authorities and a financial institution, the claims of the tax authorities take precedence. This interpretation was corroborated by Eka Gigauri of Transparency International Georgia. As a result, domestic financial institutions face higher financing costs when borrowing from abroad, and banks have become reluctant to accept collateral. There is also a general sentiment of political risk associated with Georgia; the country has a moderate-to-low credit rating of BB-, which hampers the ability of banks to procure external funding. These developments translate into higher borrowing costs for households and businesses.

To summarize, academic studies produced by Knack and Keefer (1997) and Bjornskov and Meon (2010) emphasize the importance of social capital on the success of entrepreneurship, and CB survey data show that Georgians exhibit significantly higher levels of social and institutional trust (which are among important indicators of social capital) than Armenians. Social trust is often taken as a necessary condition for economic growth. However, it is not a sufficient condition, as indicated by measurements of productivity (SME turnover per employee) being much higher in Armenia than in Georgia. This indicates that more palpable factors are inhibiting the growth of Georgia’s SMEs, with agricultural land fragmentation and the difficulty in obtaining financing being possible explanations. However, it must be conceded that none of the factors presented in this study, when viewed in a vacuum, appear sufficient for explaining the divergent performances of SME sectors in Georgia and Armenia. A more comprehensive study is necessary to reach solid conclusions.

For more information about public opinion in the South Caucasus, including data pertaining to social capital and the economic situation, refer to the CRRC online data analysis tool. If you have some criticisms, evidence or insights to add to the discussion, please feel free to contribute comments.

Thursday, November 27, 2014

SME Performance in Georgia and Armenia: Part 1

The CRRC Caucasus Barometer (CB) survey results demonstrate that Georgians exhibit relatively high levels of interpersonal and institutional trust when compared to their Armenian neighbors. Trust is an important component of “social capital,” which is widely perceived to be a necessary condition for a thriving entrepreneurial class and small and medium enterprise (SME) sector. Scholars of social capital such as Francis Fukuyama (1996) and Robert Putnam (1993) have written extensively on the effect of social trust on economic development, of which the growth of SMEs is important, finding a connection between trust toward fellow citizens and formal institutions and successful entrepreneurship. Other scholars such as Knack and Keefer (1997) assert that “if entrepreneurs must devote more time to monitoring possible malfeasance by partners, employees, and suppliers, they have less time to devote to innovation in new products or processes,” while Bjornskov and Meon (2010) express the view that “trust allows entrepreneurs, who move the productive possibility frontier forward through process innovation, to have more impersonal contacts and rely more on the market process.”

This two-part series of blog posts provides a comparative analysis of the productivity of respective SME sectors in Georgia and Armenia in the context of social trust. While Georgians report higher levels of trust in other people and in formal institutions than their Armenian neighbors (possibly indicating higher levels of social capital), the performance of SMEs in Georgia is unproductive in comparison, suggesting that factors other than trust may be more salient to entrepreneurial success. 

Before providing analysis it is important to consider the different official definitions of an SME in each country. According to the Ministry of Finance, the term “SME” in Georgia refers to any firm generating annual turnover of less than GEL 1,500,000 (roughly $850,000 at the time of writing), regardless of the number of employees. By contrast, the Armenian authorities do not take turnover into account and, rather, define SME by number of employees, with different standards by sector: in industry an SME employs up to 100 people, in education and energy up to 50 people, and in services up to 30 people. Despite differences in definition the share of the workforce employed by SMEs in either country is similar; 31% of Georgia’s employed persons work in the SME sector, slightly larger than the 25% figure for Armenia.

While employment levels are similar, value added by SMEs is relatively smaller in Georgia than in Armenia, indicating a comparative lack of productivity in Georgia’s SME sector (productivity is measured as value added per employee). In 2012 value added produced by Georgian SMEs accounted for only 9.6% of the country’s GDP, compared to 27% for Armenia. Measuring the productivity of workers in the SME sector using the equation SME value added/GDP ÷ number of employees in SMEs/number of employees nationwide, we are left with the following coefficients as measurements of productivity: 1.08% for Armenian SMEs and .31% for Georgian SMEs. While the Georgian SME sector employs a slightly larger proportion of the workforce, the relative contribution of each employee to the country’s GDP is only one-third that of the contribution of employees in Armenian SMEs.

Giorgi Tsikolia, director of Georgia’s Entrepreneurship Development Agency, spoke of the poor performance of Georgia’s SME’s: “SMEs demonstrate low productivity and competitiveness as well as low sophistication. In many cases companies have poor management and employees lack knowledge and relevant skills.” In short, Georgia has no shortage of start-ups, but it has a shortage of successful entrepreneurs. The development of the sector has been plagued by persistent problems: proprietorships and small firms lack the capabilities and incentives to grow. Farmers often fail to progress from subsistence activities to producing for exchange, and small proprietorships struggle to achieve the productivity gains needed to become thriving medium-sized enterprises.

Can measures of social trust be useful tools for explaining the relative performance of SMEs in Georgia and Armenia? The CB asks respondents the following question: “Would you say that most people in the country can be trusted, or that you can't be too careful in dealing with people?” While this question doesn’t tell the whole story about interpersonal trust, it is designed to measure bridging social capital, a condition especially important for economic performance. The responses show Georgians to be much more trusting than Armenians, with 29% answering that “most people can be trusted” compared to 15% of Armenians. More importantly, 33% of Georgians responded that “you can’t be too careful,” compared to 53% of Armenians (values were re-coded from a 10-point scale used in the questionnaire to a three-point scale used in this text, with original values 1-4 corresponding with the response “you can’t be too careful,” 5-6 being “neutral,” and 7-10 corresponding with “most people can be trusted”).

Trust in formal government institutions is another measure of social capital. While a comprehensive assessment of the level of institutional trust in either country is not possible here, the observance of select indicators can provide valuable insight. In 2013 CB asked residents of both countries to assess how much they trust or distrust their country’s court system; 22% of Georgians reported to “fully trust” or “somewhat trust” the courts, compared to 15% of Armenians. Furthermore, Armenians were much more likely to express distrust, with 53% responding that they either “fully distrust” or “somewhat distrust” the courts, compared to only 19% of Georgians. This indicator has significant implications for the success of SMEs, as trust in the legal system to protect private property and impartially mediate disputes is an important condition for entrepreneurs to undertake costly investments. CB also asks respondents how much they trust or distrust their country’s Parliament. In 2013, 29% of Georgians responded that they either “fully trust” or “somewhat trust” the national Parliament, while only 11% of Armenians gave the same answer. Georgians were also much less likely to distrust their Parliament, with 19% percent indicating “distrust” or “fully distrust,” compared to a full two-thirds of Armenians.


Looking at social and institutional trust in a vacuum, one would expect Georgia to have a more successful SME sector than Armenia, but the opposite is true. So, it appears that other factors present in Georgia hamper the productivity of SMEs. Academic studies by Rudaz 2012 and Welton 2012 find significant impediments from the difficulty individuals face obtaining financing and the fragmentation of agricultural land, problems determined to be more pervasive in the Georgian case. Given that Georgians report higher levels of interpersonal and institutional trust than Armenians, it appears that tangible factors may have more profound effects on the productivity of small and medium enterprises in Georgia.

While this piece overviews the performance of SMEs in Georgia and Armenia in the context of social capital, the second blog in this series will explore more tangible factors affecting the performance of Georgian and Armenian SMEs, including problems in agriculture and financial markets. For more information about public opinion in Georgia and Armenia, consult CRRC’s online data analysis tool.

Monday, October 13, 2014

Active and Employed

Does having more free time mean that you can do more? According to the 2013 CRRC Caucasus Barometer (CB) survey, the answer is not that simple. Being unemployed may mean that you have more time at your disposal, but it may also mean that you have fewer opportunities to get involved and resources to use for various activities than those who work. This blog looks at activities people get involved in and describes the differences between those who have a job and those who do not.

According to data from CB 2013, 40% of Georgians are either employees (25%) or self-employed (14%). In this survey, those who do not have a job are grouped into the following categories: unemployed (25%), retired (17%), housewives (12%), students (4%) or disabled (2%). One can reasonably expect that people who work are more likely to have less time to participate in different kinds of activities compared to the unemployed. However, CRRC Caucasus Barometer data demonstrates that people who work tend to get involved in different kinds of activities more frequently than those who do not work.

Working people are more likely than the unemployed to participate in activities which involve socializing, meeting new people and helping others. Twenty five percent of those who have a job said that they have volunteered without compensation and 23% have attended a public meeting during the last six months, while only 17% and 13%, respectively, of the unemployed did the same. Also, when asked whether they have done any unpaid or paid work for their family’s business for at least one hour within the past week, more of those who work answered positively compared to the unemployed.


Note: The graph above only gives the percentage of “Yes” responses. It does not give percentages of “No”, “Don’t Know” and “Refuse to Answer”. The chart gives only the answers of respondents who have a job or are unemployed. Housewives, students, retired people, the disabled and others are excluded.

Moreover, when it comes to political participation, working people report higher rates of involvement. Around 90% of both those who have a job and those who do not say they would participate in presidential elections if they were held next Sunday, but when it comes to reality, 90% of working people reported voting in the 2012 parliamentary elections compared to 81% of the unemployed.  Here, it is important to note that according to the Central Election Commission of Georgia, the turnout in this election was only 59.75%. The number of respondents who report that they have or will vote is usually higher than the actual turnout. There are many reasons for this discrepancy; however, this blog does not seek to analyze these reasons.

Those with jobs and without are similar in their frequency of using the internet but differ from each other in respect to their behavior while browsing the internet. As CB 2013 shows, 36% of those who work and 31% of the unemployed say they use the internet every day. The most frequent activities when browsing the internet are similar in both groups, but the frequencies are different between groups. Most of the time, people use the internet to visit social networking sites or to search for information, though those who have a job are less likely to use the internet for social networking sites and are more likely to search for information. They are also more likely to send and receive email, which may be related to their work. 

Note: The graph above only gives the frequency of respondents mentioning these activities. Respondents were asked to list up to three activities and then read from a list of online activities. The chart gives only the answers of respondents who have a job or are unemployed. Housewives, students, retired people, the disabled and others are excluded.

When considering the above-mentioned differences, it is important to note that there are no significant differences in the demographic characteristics of those who work and who are unemployed. They are evenly distributed geographically and by gender. As for the age composition of the two groups, the share of people aged 18 to 35 is higher in the unemployed group (45% compared to 35%). While financial factors are important, alone, they do not explain the differences described in terms of social engagement, especially as activities such as volunteering, attending public meetings and voting do not require significant expenditures.

Thus, people who work are more involved in other social activities than those who do not work. In addition to financial factors, social factors may also be behind these differences. Maybe those who have a job have more opportunities to engage in activities, because they have more connections as they are part of a specific social network due to their work. On the contrary, maybe they have a job, because they already had more social ties before they got a job, and thus are and were actively involved in many different activities. We cannot say for sure, but finding out the answer might be very important as, according to Caucasus Barometer 2013, there are a fair number of unemployed people (25%) in Georgia who may have free time that can be used to serve some good.

In your opinion, why are the unemployed less involved in the social activities discussed in this blog? What is the reason for unemployed people not participating in many social activities? Is it only related to economic factors or are there other factors that could explain these findings?

Share your ideas on the CRRC’s Facebook page.