Showing posts with label Economic condition. Show all posts

Tuesday, March 11, 2025

More than half of all Georgians struggle to put food on the table

Note: This article first appeared on the Caucasus Data Blog, a joint effort of CRRC-Georgia and OC Media. This article was written by Zachary Fabos, a Researcher at CRRC Georgia. The views presented in the article are the author’s alone and do not necessarily represent the views of CRRC Georgia or any related entity.

Although the frequency of food insecurity has steadily decreased since 2015, alarmingly, over half (53%) of Georgians in 2024 still reported either not being able to afford food or needing to borrow money to purchase food at least once in the past 12 months.

Although widespread, food insecurity is especially concentrated among particular demographic groups.

A regression analysis, which combines not being able to afford food in the past 12 months and borrowing money to purchase food in the last six months, to represent food insecurity, demonstrates that those living outside of the capital, ethnic minorities, and those with one or more children are most likely to experience this form of poverty.

For example, ethnic minorities are 17 points more likely than ethnic Georgians to report not being able to afford food or borrowing money to purchase it.

Likewise, those living in rural and urban communities are 19 and 16 percentage points more likely, respectively, to report food insecurity in the past year, compared to inhabitants of Tbilisi, while those with one or more children are 13 percentage points more likely to experience food insecurity, compared to those without a child.

Though still a decrease from 10 years ago, the Caucasus Barometer data demonstrates there remains an alarming rate of food insecurity across all populations of Georgia, especially among ethnic minorities, outside Tbilisi, and in families with children.

Note: The analysis in this article makes use of binomial regression analysis. The analysis included gender (male, female), age group (18-34, 35-54, and 55+), settlement type (capital, urban, rural), ethnicity (Georgian, ethnic minority), and has child(ren) (has a child, does not have a child) as predictor variables.

Tuesday, March 21, 2023

People in Georgia are highly uncertain about their economic future

Note: This article first appeared on the Caucasus Data Blog, a joint effort of CRRC Georgia and OC Media. It was written by Nino Zubashvili, a Researcher at CRRC-Georgia, The views presented in the article are of the author alone, and do not necessarily reflect the views of CRRC-Georgia, or any related entity.

Across various demographic groups, Georgians are uncertain about what their economic futures might hold, with those from lower-income backgrounds more uncertain than those with a higher income.

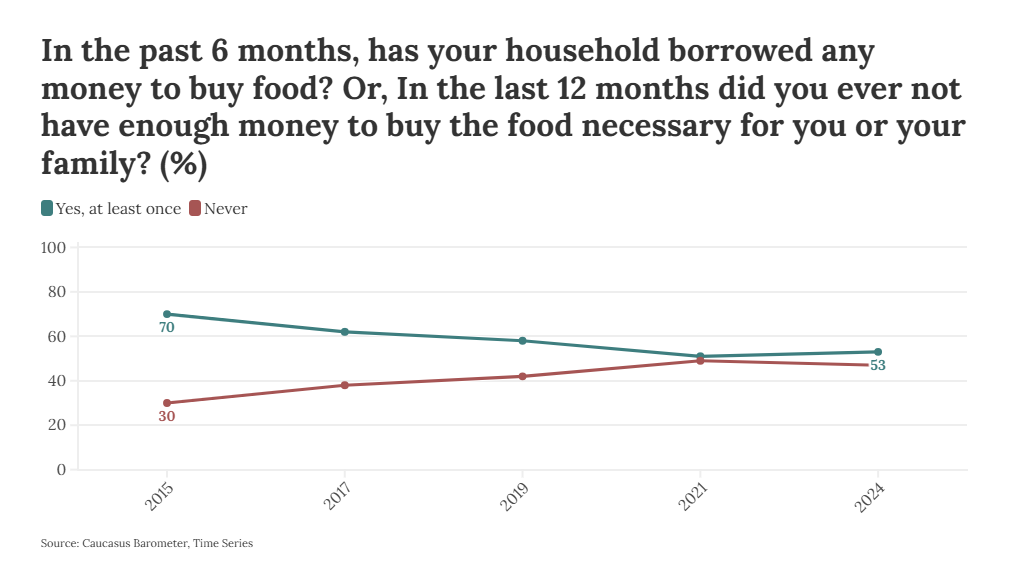
Georgia today faces numerous structural challenges that hinder social and economic development, such as low productivity and low-quality jobs, poor quality of education, poor links between education and employment, high unemployment, and poverty. 

On top of this, high use of the dollar alongside the country’s own currency, and reliance on income from tourism make the country vulnerable to external shocks. 

Despite some positive developments, including becoming an upper middle income country in 2016, a ‘very high’ rating on the Human Development Index, and a low average multidimensional poverty score (37%), public opinion polling has found that the public is highly uncertain about their economic prospects. 

CRRC Georgia’s Caucasus Barometer 2021 data shows that while a plurality of the population feel they are part of the middle class, almost half are uncertain about their households’ future economic well-being. 

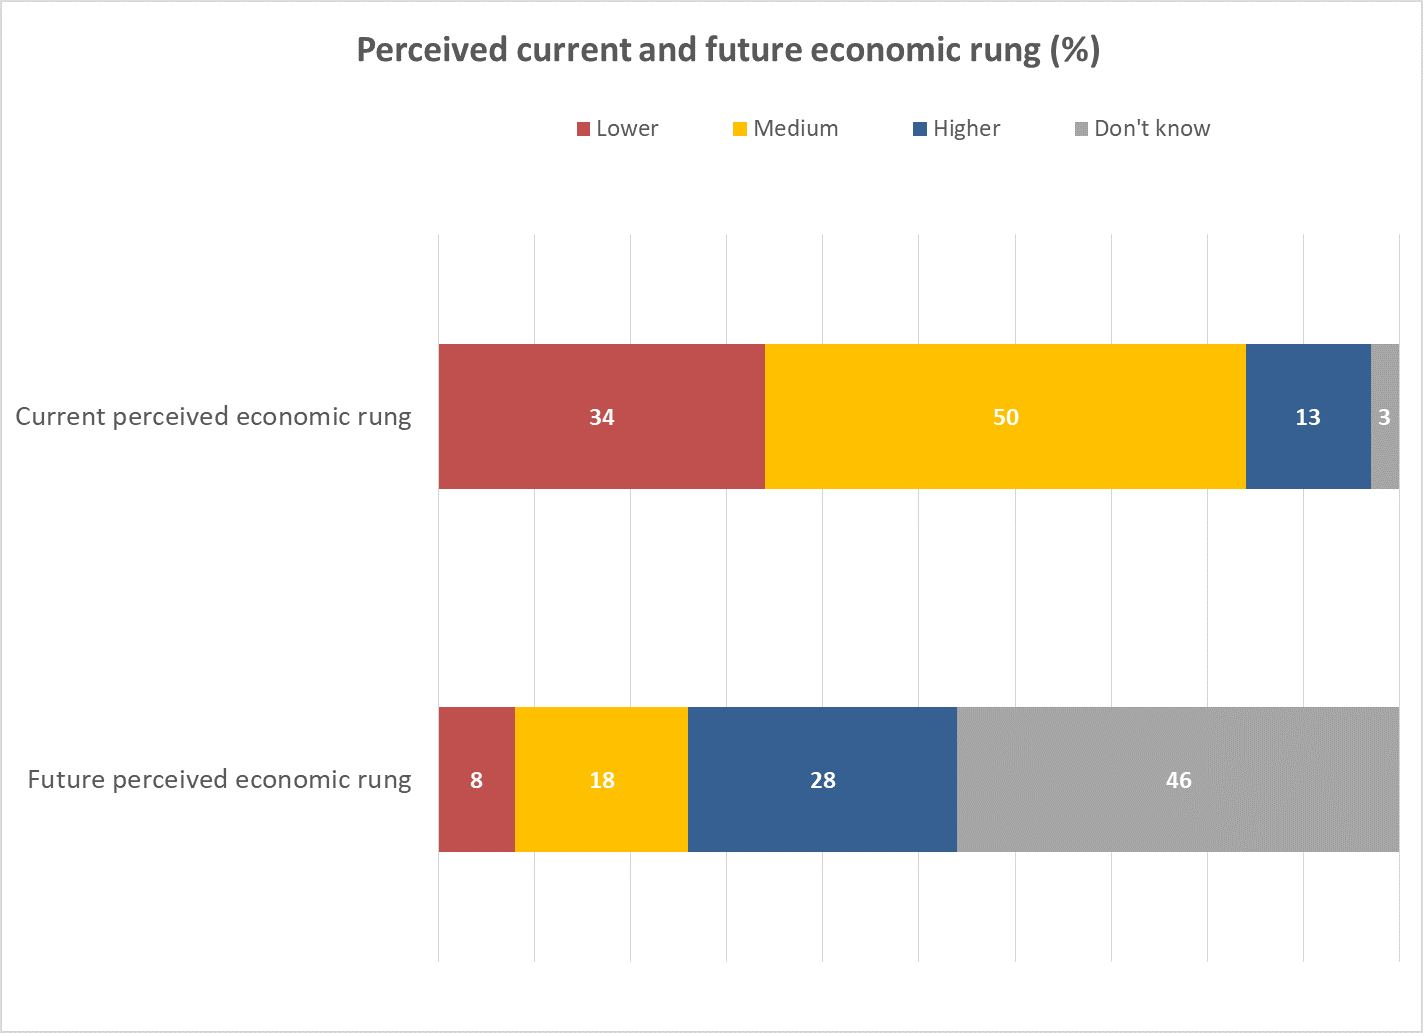
Half (50%) of Georgia’s population perceive their current economic status as in the middle, 34% as poor, and only 13% as high. 

When asked what they expect their economic status to be five years in the future,  8% of the population see themselves on the lower rungs of the economic ladder, with 18% seeing themselves in the middle class. Notably, 28% believe they will be relatively well off, twice as many as currently see themselves in that category.

But uncertainty about the future is substantial. Almost half of the public (46%) answered that they didn’t know what their household’s economic status would be in five years. 

Numerous factors are associated with how people in Georgia perceive their future economic rung. 

More than half of those who perceive themselves to be on the lowest rungs of the economic ladder are uncertain about the future. A fifth on the lower rungs expect to stay there, and around a fifth expect to move to the middle of the ladder. Few on the lowest rungs today expect to move to a relatively well-off rung. 

In contrast, wealthier people, as measured along a wide range of variables, tend to expect a better future for themselves. People who perceive themselves to be relatively well-off have less uncertainty about their economic futures, and expect to continue to be relatively well-off. 

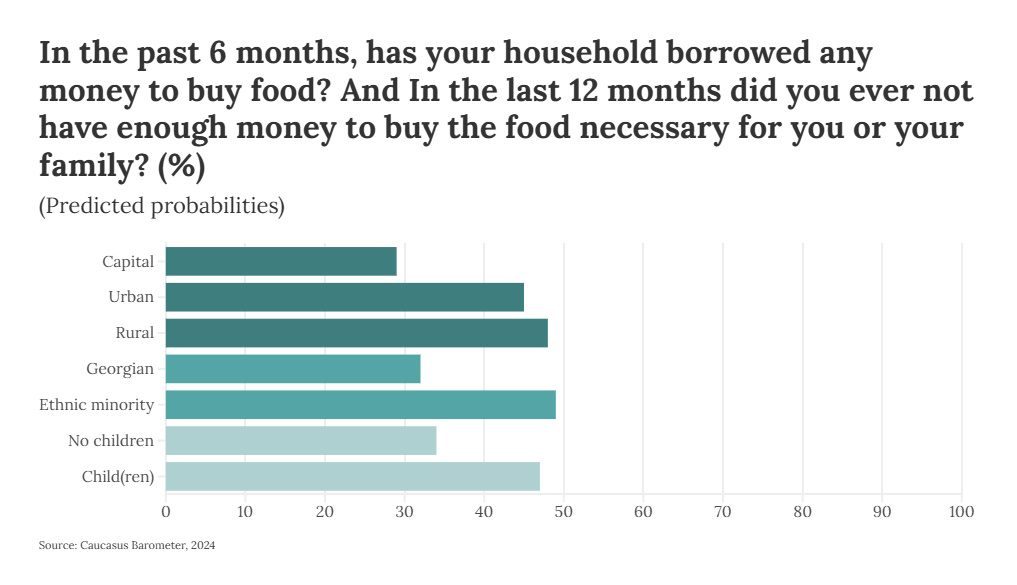
Similar patterns are present for people and households with higher measured incomes, and who do not struggle to buy food.

In terms of age, younger Georgians (aged 18-34) have higher expectations for a better economic future and less uncertainty compared to other age groups. With age, expectations for a better economic future decrease, and uncertainty increases. 

Economic expectations are also notably higher and uncertainty notably lower among those with a higher education, compared to those with a lower level of education.

Personal beliefs and perceptions of the country’s future are also associated with a household’s perceived future economic rung. Those who believe that ‘the situation in Georgia will never improve’ are slightly less likely to expect improvements in the economic situation compared to those who believe that everything will be fine in Georgia. 

Finally, it is perhaps unsurprising that people who are currently more satisfied with life are also more likely to have positive expectations for their economic futures. 

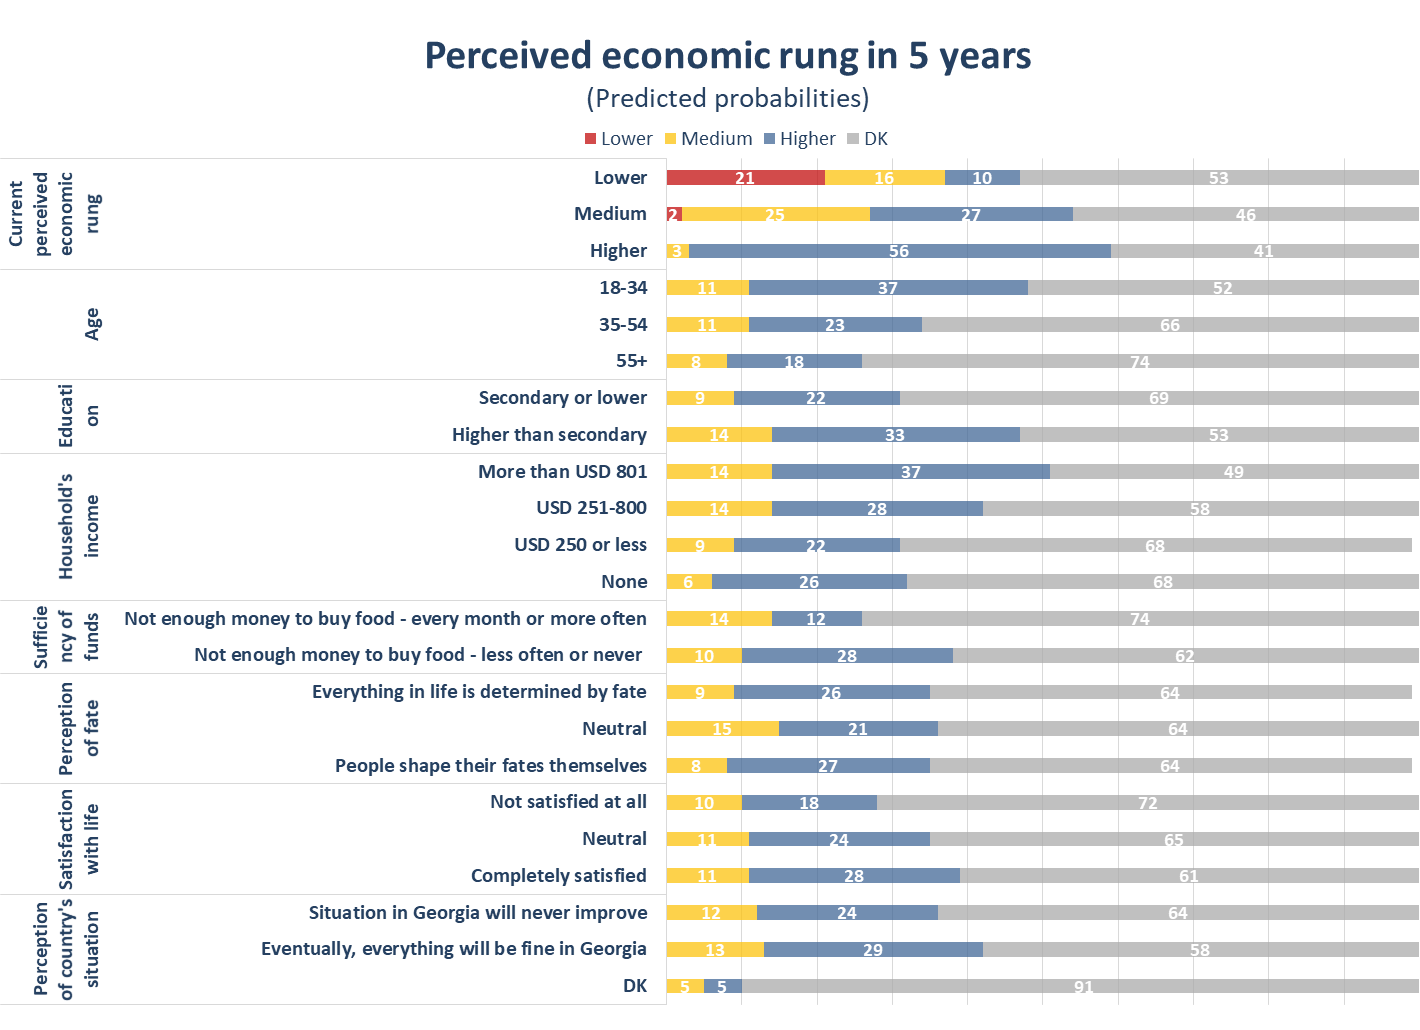
Gender, ethnicity, settlement type, employment, religious denomination, frequency of attendance at religious services, whether or not someone has enough money to buy durable goods or not, ownership of durable goods, party affiliation, whether people think everything in life is determined by fate or not, and generalised trust were not associated with what people think their household’s economic future holds.

The largest share of people in almost every socio-demographic group in Georgia are uncertain about their economic futures, regardless of their level of education, perceptions of fate, or perspective on Georgia’s politics. 

Note: The data used in the article can be found on CRRC’s online data analysis tool.

The analysis was carried out using logistic regression. The regression included the following social and demographic variables in all cases: sex (male or female), age group (18–35, 35–55, 55+), ethnic group (ethnic Georgian or other ethnicity), settlement type (capital, other urban, rural), educational attainment (secondary or lower education, or higher education), employment situation (working or not), party support (GD, opposition, no party, DK/RA), current perceived economic rung (low, medium, high), religious denomination (Orthodox Christian, other, none), frequency of attendance to religious services (frequently, sometimes, rarely, never). Household’s economic well-being measurements included household’s income, household’s purchasing power (Money not enough for durables, money enough for durables and more), sufficiency of household’s income (Not enough money to buy food every month or more often, not enough money to buy food less often or never), ownership of durable goods. Attitudinal variables tested as part of the analysis included, whether or not one believes in fate, generalized trust, satisfaction with life, whether politics in Georgia is going in the right or wrong direction, whether the situation in Georgia will improve. Both attitudinal variables and measures of households’ economic well-being were tested independently in separate regression analyses that controlled for the previously mentioned social and demographic variables.

Monday, September 09, 2019

The Easterlin Paradox and Happiness U-curve in Georgia

Two of the more prominent findings from the study of happiness are that money does not buy it (up to a point) and that young and old people are happier than those in between. That money does not buy happiness is often referred to as the Easterlin Paradox. It highlights that between and within countries happiness increases with wealth, but only up to a certain point, at which increases in wealth are associated with marginal gains in happiness. That the elderly and young are happier is referred to as the happiness U-curve. This finding has been found to hold in the West, but not in the former Soviet space, where the elderly are the least happy. This blog looks at these phenomenon in Georgia.

On the 2018 UN Women and CRRC Georgia survey, respondents were asked to rate their self-reported happiness, from “Extremely unhappy” to “Extremely happy” on an eleven point scale. A plurality of respondents reported being extremely happy (40%). By comparison, only 1% reported being extremely unhappy.


In agreement with previous studies on happiness within the post-Soviet space, increased household economic status was associated with higher levels of happiness. Individuals who were wealthier were more likely report a happier response on the scale. In contrast, those who have relatively few assets reported lower levels of happiness. However, once respondents have three out of the eleven assets asked about or more, reported happiness increases at a marginal rate, as the Easterlin Paradox would predict.


The U-shaped happiness curve does not hold in Georgia, as happiness generally decreases with age. The presence of children, sex, settlement type, household size, whether or not the respondent was displaced by conflict, and education level were not associated with happiness.


The above data suggests that the Easterlin paradox appears to hold in Georgia, with individuals becoming happier with greater wealth, up to a point. As in other post-Soviet countries, older people are generally less happy, again re-affirming the lack of a u-curve in happiness in the region.

Note: The above analysis is based on an ordinary least squares regression, where the dependent variable is the respondent's self-reported happiness level. The independent variables are respondents’ household economic status (measured with an asset index, composed of ownership of 11 assets), age, sex (male, female), education, settlement type, displacement status, household size, and age’s interaction with the presence of children in the home. Replication code for the above analysis can be found here. The data for the above analysis can be found here.


The views presented in the above blog post do not represent the views of UN Women, SDC, or any related entity.

Monday, March 26, 2018

Women Significantly Less Likely to Go Out to Eat in Georgia

[Note: This post was published with OC-Media. The post was written by CRRC-Georgia's President, Koba Turmanidze.]

Busy restaurants and cafes are a common sight in Georgia, and CRRC’s Caucasus Barometer data suggest that restaurants and cafes have become busier over the last five years. While 27% of Georgia’s population reported going to a restaurant in 2012, five years later 50% did. There is an upward trend for both men and women, yet the data also suggests there is a significant gender gap. Taking into account other social and demographic characteristics, women are significantly less likely to go to restaurants than men.


Note: According to the instructions to this question, restaurants included pizzerias, khinkhali houses, McDonald’s, etc.

A number of factors including settlement type, age, social status, economic condition, and gender influence whether an individual goes out to eat. The findings are hardly surprising in many respects: residents of Tbilisi are more likely to go to restaurants compared to the residents of villages. Irrespective of whether a person reports being employed or unemployed, he or she is more likely to go to a restaurant than individuals who are outside the labor force, i.e. those who do not work and are not looking for a job either. Likewise, people living in households with low reported expenditures per month (250 USD or less) are less likely to go to a restaurant. Also unsurprisingly, age is negatively related with eating out: the older a person the less likely is he or she to go out to eat. Actual and perceived social status show the opposite effects of age: the more years a person spent studying in formal educational institutions, the higher are his or her chances to have gone to a restaurant. In the same manner, the higher along a hypothetical ten step ladder representing the society a person places him/herself, the more likely they are to visit restaurants.


Note: The chart displays the effect of each factor on an individual’s probability of reporting they went to a restaurant during the past six months. ‘Diamonds’ are point estimates, whereas lines show 95% confidence intervals. The further the ‘diamond’ is from the red dotted line, the larger the effect. The few ‘diamonds’ right on the red dotted line are reference categories for a variable. Rural settlements, males, individuals who do not belong to the active labor force, and individuals who did not report household spending are reference categories. Every other category should be interpreted in relation to corresponding reference category (e.g. capital residents in relation to rural residents, females in relation to males, etc.)

While all the above factors influence whether a person goes to a restaurant, gender has the largest effect of all: all else equal, women are about 10 percentage points less likely to go to a restaurant than men. Further analysis shows that more educated women are no more or less likely than less educated women to go to restaurants, women from relatively wealthy households are not different from women from poorer households, and so on.

When looking at the impact of other socio-demographic factors across the two gender groups, women are worse off in terms of going to restaurants simply because they are women. The chart below demonstrates that if we pick a male and a female of the same age between the ages of 20 and 78, the male will always have a higher chance to have reported going to a restaurant.

Similarly, if we take two people of a different gender, but identical years of education, the man will still be more likely to have eaten at a restaurant in the last six months than a women. Notably, the significant difference in terms of years of education is maintained in the group who studied for 10 to 16 years, which constitutes 84% of the population according to the 2017 Caucasus Barometer survey.


Employment status and a household’s expenditure do not entirely diminish the impact of gender either: while both males and females are equally likely to go to a restaurant if they do not belong to the active labor force, in the unemployed and employed groups, females are disadvantaged. Moreover, females from households that spent up to USD 400 in the month prior to the survey are also less likely to have eaten in a restaurant in the past six months. Interestingly, there is no gender difference in the group of relatively high spending (more than USD 400) as well as in the group which did not report their household expenditure.


The findings of this analysis suggest that gender is the single most important factor that predicts whether an individual will go to a restaurant in Georgia. Regrettably, females are disadvantaged in this regard compared to males of the same age, education, social-economic standing and settlement type, demonstrating yet another form of gender inequality in Georgia.


To explore the data used in this blog post, visit CRRC’s Online Data Analysis platform. The code used for data analysis is available here.


Koba Turmanidze is CRRC-Georgia’s President.

Monday, October 24, 2016

Trends in the data: Changes in Employment Sector and Type of Employment in Georgia

According to CRRC’s Caucasus Barometer (CB) surveys from 2008 to 2015, the self-reported employment rate is rather stable in Georgia – approximately 35%. This blog post looks at the trends in CB data on primary employment sector and type of primary workplace. Throughout the post, only the answers of those who reported being employed – slightly above a third of the population – are analyzed.

In 2015, as in previous waves of CB, the largest share of those who considered themselves employed – 14% – reported being employed in the agriculture, hunting, or forestry sector. Importantly, however, this share has declined considerably since 2008, when 29% of the employed reported being employed in this sector. Over the same period, the shares of those employed in other major sectors (trade, education, construction) have remained stable.


Note: In addition to actual responses of “Other”, several other options of low frequency are also included in this category on the chart above. That is, category “Other” in this chart includes responses “Healthcare and Social work”, “Financial Intermediation and Banking”, “Hotels, Restaurants, Cafes”, “Manufacturing”, “Transport and Storage”, “Electricity, Gas, and Water Supply” and “Mining and Quarrying”. 

A similar downward trend is observed between 2008 and 2015 in the share of employees who reported “owning a business without employees.” While in 2008, this share was about a third of those who were employed, roughly equal to those employed by state organizations, it decreased to 21% in 2015.

Although these two findings are not necessarily related, they show interesting trends in the employment situation in Georgia. Fewer people report working in the agriculture, hunting, and forestry sector, and fewer people report being sole proprietors than in the past. Both these trends suggest that the composition of the Georgian labor market may be shifting, and both call for further and thorough analysis.

CRRC’s Caucasus Barometer survey data and respective documentation are available at our online data analysis tool.


Monday, November 09, 2015

Household income and consumption patterns in Georgia


After the collapse of the Georgian economy in the 1990s, the country slowly started to recover, and between 2000 and 2014, the gross national income grew from $3.4 billion to $16.7 billion (in current USD). According to the National Statistics Office of Georgia, the official unemployment rate in Georgia was 12.4% in 2014, but according to numerous surveys the rate is much higher. Compounding matters, the low salaries of the majority of those who are employed make it difficult for many families to make ends meet. According to World Bank statistics in 2012, 15% of Georgians still live below the national poverty line, which is slightly under $1.25 a day.

Classic micro-economic theory tells us that consumption depends on income levels, but also on the type of good. Normal goods, a good example of which in Georgia would be an Opel Astra if we are talking about cars, are consumed less when income falls. Inferior goods, on the other hand, are consumed when consumers do not have enough money to buy something better – with cars, one would choose a Zaporozhets instead of an Opel. Or, when a family’s budget is tight, they might buy no-name sports shoes rather than Nikes, or a standard mobile phone rather than a smart phone. Finally, demand for luxury goods (a Land Rover instead of an Opel) increases more than proportionately as incomes increase.

Recently, we saw that most people in Armenia, Azerbaijan, and Georgia cannot afford to buy certain durable goods. But, when income is scarce, it also obviously influences everyday choices, such as what to eat for dinner, when to turn on the heater, and whether to buy your child that chocolate bar she really wants.  

So how does the consumption of everyday goods differ by income level in Georgia? The chart below shows the percentage of households in Georgia which report restricting consumption of certain foods because of their limited income.


Note: The original scale measuring household income was recoded for this chart. GEL was converted into USD. The income groups “USD 401-800”, “USD 801-1200” and “More than USD 1200” were combined into “More than USD 400” and the groups “USD 0”, “Up to USD 50” and “USD 51-100” were combined into  “Up to USD 100”. Only “yes” answers are reported. Error bars indicate a 95% confidence interval.

As expected, the percentages of households limiting consumption differ by income group, with households in the highest income group limiting their consumption the least. Importantly, this trend is obvious in spite of the fact that we did not control for the size of households for this blog posts, i.e. did not take into account per capita income of the household members, or number of children or elderly in the households.

Even in the group with the highest household income, about one in four households limits consumption of beef – and reports doing so solely due to budgetary difficulties. In the $251-400 income group, between 8% (potatoes) and 54% (beef) of Georgians say they restrict consumption of certain goods. In households with an income between $101-250 these shares increase to 14% and 76%. In the poorest households, with less than $100 income per month, four out of five households report limiting consumption of beef and one out of five limits even the consumption of staple foods like potatoes.

In each income group, the highest percentage of households limits consumption of beef and sweets/chocolate, while the smallest percentage limits consumption of potatoes. Milk and vegetables are somewhere in between. In addition to the obvious explanation suggesting that higher shares of households limit consumption of beef and sweets/chocolate simply because these are relatively expensive, this trend might also be explained by what economist call income elasticity of demand. The concept is a measure of how sensitive consumption is to changes in income. Among food products, beef and sweets are probably seen more as luxury rather than absolute necessities, because of comparatively high prices and potential substitutes.

Hence, how Georgians limit their food consumption differs by both income group and type of food. Yet, looking at this issue only from the monetary income perspective does not take into account cases when, in rural settlements, families produce their food themselves.

Interested in this or a similar topic? Browse the Caucasus Barometer and other CRRC survey data here.

Monday, August 31, 2015

Home appliances in the South Caucasus: Purchasing trends, 2000-2013


A fair share of the Armenian, Azerbaijani and Georgian population still lives in poverty and cannot afford to buy certain durable goods. According to CRRC’s 2013 Caucasus Barometer survey (CB), in Georgia, 28% of the population reported they did not have enough money for food; 33% had enough money for food, but not for clothes, and for 31% there was enough money for food and clothes, but not for durables. Only 7% of the population reported they could afford to buy durables, and a further 2% said they had enough money to buy anything they needed. The situation is similar in Armenia, but slightly different in Azerbaijan where less people report not having enough money for food (22%).

Using data from CB 2013, this blog post looks at ownership of washing machines, refrigerators and air conditioners in Armenia, Azerbaijan and Georgia, and, if the respective item was purchased in 2000 or later, when it was purchased.

Of the three durables we discuss in this blog post, refrigerators are the most widely owned (by 94% of households in Azerbaijan, 79% in Armenia and 78% in Georgia). Approximately half of the households have at least one automatic washing machine in Azerbaijan and Georgia, while the respective share is a bit higher in Armenia. Only a small share of households in Armenia and Georgia has at least one air conditioner, while the respective share is reported to be much higher in Azerbaijan (29%). Unsurprisingly, in all countries, the ownership of these appliances is higher in the capitals compared to other settlements.


Analysis of the time of purchase of these household appliances in Georgia shows growth in purchases from 2000 until 2008, followed by a decline that may be connected to the 2008 world economic crisis. In 2010, the purchases increased and then dropped again in 2011. In 2012, air conditioner purchases increased, while washing machine purchases dropped and refrigerator purchases remained stable. Less air conditioners and automatic washing machines were purchased in 2013.

Importantly, as shown in the chart below, the changes in the shares of the households purchasing these appliances coincided to a certain extent with the dynamics of GDP per capita, with the exception of 2013, when GDP per capita increased slightly compared with the previous year, while purchases of washing machines and air conditioners dropped.


Note: In 2001 and 2002, approximately the same shares of households purchased refrigerators, washing machines and air conditioners in Georgia.

In Armenia, the purchasing patterns of these appliances follow a trend similar to Georgia, with one exception: purchases of air conditioners increased in 2013.


Azerbaijan was also affected by the world economic crisis. However, GDP per capita continued to increase after 2009, while purchases of household appliances decreased. A possible explanation here might be that the GDP growth in Azerbaijan is connected to natural gas and oil sales. Hence it most likely reaches economic elites and less so the general population and its purchasing power.


To sum up, there are still many households in the region who do not own certain household appliances e.g., automatic washing machines and air conditioners. Residents of the capitals are better equipped with these appliances than people living outside the capitals.

To explore this topic more, have a look at the Caucasus Barometer data, here.

Thursday, December 04, 2014

SME Performance in Georgia and Armenia: Part 2

As discussed in the first blog post of this series, the results of the CRRC Caucasus Barometer (CB) survey show that Georgians demonstrate higher levels of interpersonal and institutional trust than Armenians.  These types of trust are important indicators of social capital, which is often taken as a necessary condition for the presence of a robust, productive entrepreneurial class and small and medium enterprise (SME) sector. While Georgians express higher levels of trust in their fellow citizens as well as in formal institutions such as the judiciary and Parliament, economic data shows that the country’s SME sector suffers from a dearth of productivity. This blog post looks at survey data shedding light on economic conditions in Georgia and Armenia as well as policy research on the state of SMEs in each country, finding impediments to rural development and the high cost of financing to be potential causes for the relative lack of productivity by Georgian SMEs.

Productivity of the SME sector (defined as value added per employee) is significantly lower in Georgia when compared to Armenia. Emblematic of the lack of productivity in Georgian SMEs is the preponderance of small-scale agriculture. Many legally designated “small enterprises” are in fact subsistence agriculture proprietorships with little or zero cash turnover, a situation which Rudaz 2012 refers to as “entrepreneurship by default.” A report from the International Fund for Agricultural Development found that as late as 2005, 83% of rural households were dependent entirely on subsistence agriculture and that a “typical” rural household consumed 73% of what it produced. By 2013, however, the CB found that 59% of rural Georgians reported receiving household income from the sale of agricultural products, indicating an existence at least slightly above subsistence level agricultural production.  On the other hand, 27% of Georgia’s rural inhabitants reported no household income from salaries or sales of agricultural products. Rural Armenians are somewhat less likely to sell agricultural products (50% reported household income from this source), but more likely to receive salaries. However, 25% percent of rural Armenians responded “no” to their households having received income from either source. Thus one cannot decisively discern from the data at hand whether rural Armenians are more likely to receive cash income than rural Georgians.

The first blog post of this series determined that available measures of social capital appear to be insufficient to explain differences in SME productivity between the two countries. So, what are possible causes for the lack of productivity gains in Georgia’s SME sector? With regards to agricultural SMEs, a potential culprit mentioned in the previous installment of this series is the fragmentation of agricultural land, with the average private holding in the country being only 1.25 hectares. The consolidation of small plots into larger and more efficient commercial farms has been impeded by an inefficient system of land registration and poorly defined property rights. Restrictions on the purchase of agricultural land by foreigners and foreign-owned businesses have also precluded potentially productive investment in the sector. While the Constitutional Court struck down a law banning land purchases by foreigners in June, 2014, a new draft of the law will allow private foreign persons and foreign companies established in Georgia to purchase plots of up to 100 hectares. Fragmentation is a problem in Georgia, but it also bears mentioning that the average private plot in Armenia consists of 1.3 hectares, scantly larger than in Georgia. Land fragmentation appears to be an obstacle to the growth of Georgia’s SME sector, but it doesn’t appear to be a decisive one. 

As for palpable factors which may explain the lack of growth by both Georgia’s agricultural and non-agricultural SMEs, the difficulty of obtaining financing should not be overlooked. The average interest rate spread in Georgia (the difference between the interest paid on deposits and the interest charged on loans) is 11.3%, the highest spread of the former Soviet republics and significantly higher than the average spread of 7.3% in Armenia. This means that the cost of borrowing outstrips the incentive to save, with the result being that an entrepreneur in need of financing to buy land and equipment or hire employees is faced with very high borrowing costs. In Armenia, this problem occurs but on a smaller scale.

The high cost of financing stems in part from the lack of collateral held by SMEs, which discourages lending. Rudaz also reports the existence of a “law giving tax authorities the right to use the collateral of tax payers who owe money to fiscal authorities,” which allowed the tax authorities to seize the collateral of those owing back taxes. To be more specific, in cases in which a person has outstanding debts to both the tax authorities and a financial institution, the claims of the tax authorities take precedence. This interpretation was corroborated by Eka Gigauri of Transparency International Georgia. As a result, domestic financial institutions face higher financing costs when borrowing from abroad, and banks have become reluctant to accept collateral. There is also a general sentiment of political risk associated with Georgia; the country has a moderate-to-low credit rating of BB-, which hampers the ability of banks to procure external funding. These developments translate into higher borrowing costs for households and businesses.

To summarize, academic studies produced by Knack and Keefer (1997) and Bjornskov and Meon (2010) emphasize the importance of social capital on the success of entrepreneurship, and CB survey data show that Georgians exhibit significantly higher levels of social and institutional trust (which are among important indicators of social capital) than Armenians. Social trust is often taken as a necessary condition for economic growth. However, it is not a sufficient condition, as indicated by measurements of productivity (SME turnover per employee) being much higher in Armenia than in Georgia. This indicates that more palpable factors are inhibiting the growth of Georgia’s SMEs, with agricultural land fragmentation and the difficulty in obtaining financing being possible explanations. However, it must be conceded that none of the factors presented in this study, when viewed in a vacuum, appear sufficient for explaining the divergent performances of SME sectors in Georgia and Armenia. A more comprehensive study is necessary to reach solid conclusions.

For more information about public opinion in the South Caucasus, including data pertaining to social capital and the economic situation, refer to the CRRC online data analysis tool. If you have some criticisms, evidence or insights to add to the discussion, please feel free to contribute comments.

Monday, September 15, 2014

Living day-to-day: How are fatalism and economic prosperity interrelated in Georgia?


Authors Rahmato and Kidanu (1999) use the phrase “We live only for today” to describe a feeling whereby a person gives up on life and does not know or does not want to think about what will happen the next day. This phrase describes a state wherein people live day-to-day without hope for the future. This sense of helplessness or hopelessness with regard to the future is known as fatalism. According to Oxford dictionary, fatalism is a “belief that all events are predetermined and therefore inevitable.” What can the study of fatalism tell us?  Research by Straughan & Seow (1998), Stephen & Shapiro (2010), and Ruiu (2014), has revealed that fatalism can play a large role in determining a wide range of behaviors such as financial savings decisions, occupational choices, health behaviors, and even natural disaster preparedness. This blog analyzes fatalistic beliefs in Georgia, and explores associations between fatalism, economic status and education.

The CRRC’s Caucasus Barometer 2013 data shows that just over a quarter of Georgians (28%) express fatalistic views by agreeing with the statement that, “Everything in life is determined by fate”. 39% hold the opposite view and 29% are neutral.

Note: This question was re-coded from a 10-point scale to a 3-point scale. The options 1, 2, 3, 4 were grouped into “Everything in life is determined by fate”. Options 5 and 6 were grouped into “Neutral”, and options 7, 8, 9 and 10 were grouped into “People shape their fate themselves”.

What are some potential consequences of being fatalistic? From an economic perspective, as Bernard, Dercon, and Taffesse (2012) claim in their paper, fatalism is equivalent to not making necessary “investments” to improve one’s well-being. Thus, a fatalistic person might refrain from making investments that would improve their well-being, because they believe such investments might not lead to significant changes. CB data shows that fatalism and a person’s economic situation are interrelated in Georgia; 35% of the population who describe their economic situation as “bad” also think that “Everything in life is determined by fate”. Only 19% of Georgians who describe their economic situation as “good” share the same belief.


Note:  Original answer options, “Money is not enough for food” and “Money is enough for food only, but not for clothes” were grouped to create the “Bad” economic condition category. The option “Money is enough for food and clothes, but not enough for expensive durables like a refrigerator or washing machine” was  renamed as “Middle” economic condition. Finally, the original answer options “Can afford to buy some expensive durables like a refrigerator or washing machine” and ”Can afford to buy anything they need” were grouped into the “Good” economic condition.

Bernard, Dercon and Taffesse describe this relationship between fatalism and a person’s economic situation as a vicious circle, whereby a person who believes they are unable to change their life might lack motivation to explore different paths towards a better life (and thus be unlikely to invest necessary resources in achieving a better life). As a consequence, a set of beliefs about the inability to make a positive change would be perpetuated.

What role does education play in this context? Education not only provides access to information, but also, according to Ruiu (2012), improves skills and can enable people to realize their abilities. According to Ruiu, education thus makes individuals less fatalistic, and based on his research, there is a strong negative association between fatalism and education. The CB also shows a negative association between education and fatalism in Georgia. 41% of Georgians who say they have achieved a primary education agree with the statement, “Everything in life is determined by fate”, whereas 22% of Georgians who have completed higher education share the same view.

Note: The following original answer options were grouped into “Primary”: no primary education, primary education, and incomplete secondary education. Secondary education and incomplete higher education were grouped into “Secondary”. Completed higher education and a post-graduate degree were grouped into “Higher”.

To conclude, fatalistic views are associated to an individual’s economic situation and education level, but of course, correlation cannot confirm causation. On one hand, CB survey data shows that fatalistic views tend to decrease as education increases in Georgia. On the other hand, Georgians who share fatalistic views are more likely to describe their economic situation as bad, compared to those who believe that people shape their fate themselves.

By: Tamuna Chkaidze

Monday, May 19, 2014

Paternalism in Georgia

According to the Stanford Encyclopedia of Philosophy, paternalism is “the interference of a state or an individual with another person against their will motivated by a claim that the person interfered with will be better off or protected from harm” (from the Latin pater for father). Simply put, paternalism refers to treating people as if they were children. The Caucasus Barometer (CB) assesses attitudes toward governance among Georgians. Who thinks citizens should be treated like children by the government (i.e. the paternalistic view) rather than as employers? Using data from the CB 2013, this blog post focuses on the following qualities of citizens: education level, economic condition and source of household income in order to better understand this paternalistic view in Georgia.

According to the data, from 2009 to 2012 a plurality of Georgian citizens reported that people are like children and the government should take care of them like a parent. This trend changed in 2013 when slightly more Georgians felt that the government should behave like an employee (53%) rather than a parent (47%) – although this difference is just outside of the margin of error.


What role does education play in these attitudes? In Georgia, the negative connection between education and the paternalistic view is well evidenced; 58% of people with a secondary education or below say that the government should be like a parent, whereas 37% of Georgians with more than a secondary education share the same view.


The economic conditions of Georgians also plays a role. 53% of Georgians who say they do “not [have] enough money for food” think the government should be like a parent. A much smaller fraction (23%) of Georgians who say they have “enough money for everything needed” share the same belief. 


Additionally, there is an interesting link between a paternalistic attitude toward the role of government and the source of household monetary income in the last 12 months. A paternalistic attitude is less common (41%) when a salary is mentioned as a source of income for a household. The distribution of paternalistic and non-paternalistic attitudes splits into two equal parts if the household had monetary income from pensions and government benefits in the last 12 months.


This blog examines qualities related to support for the Georgian government behaving as a parent or as an employee. According to data from the CB 2013, education level, economic condition and sources of monetary income for a household are related to approval for a paternalistic view of government in Georgia.

More information about Georgian citizens’ paternalistic attitudes toward government can be found by reading this blog post or by exploring our data here.  


By Tamuna Chkhaidze