Showing posts with label Voting. Show all posts

Wednesday, January 10, 2024

Can political parties in Georgia survive abandonment by their leaders?

Note: This article first appeared on the Caucasus Data Blog, a joint effort of CRRC-Georgia and OC Media. It was written by Givi Silagadze, a Researcher at CRRC-Georgia. The study was financially supported by the National Endowment for Democracy (NED). The views presented in the article are the author’s alone and do not necessarily represent the views of NED, CRRC-Georgia, Caucasian House, or any related entity.

A year before Georgia’s general elections, a CRRC survey found that less than half of surveyed Georgian partisans would remain loyal to their favoured party if its leader were to establish a new party, with supporters of the ruling party more likely to stick with their party than supporters of the opposition. 

In recent years, political experts and analysts have argued that parties in Georgia function more on the basis of their political leaders’ popularity, rather than as genuine political organisations. 

This would suggest that if political leaders left their party and established a new one, a substantial portion of their voters would go with them. 

To test this hypothesis, CRRC Georgia conducted a public opinion poll in October 2023, a year before Georgia’s next general elections. 

The data suggests that only four out of ten partisans would stay with their party if its leader leftHowever, supporters of the ruling Georgian Dream party are more likely to stay with their party, while opposition supporters more likely to be unsure or follow their party’s leader.

Respondents were asked to identify the political party with which they identified most closely. 

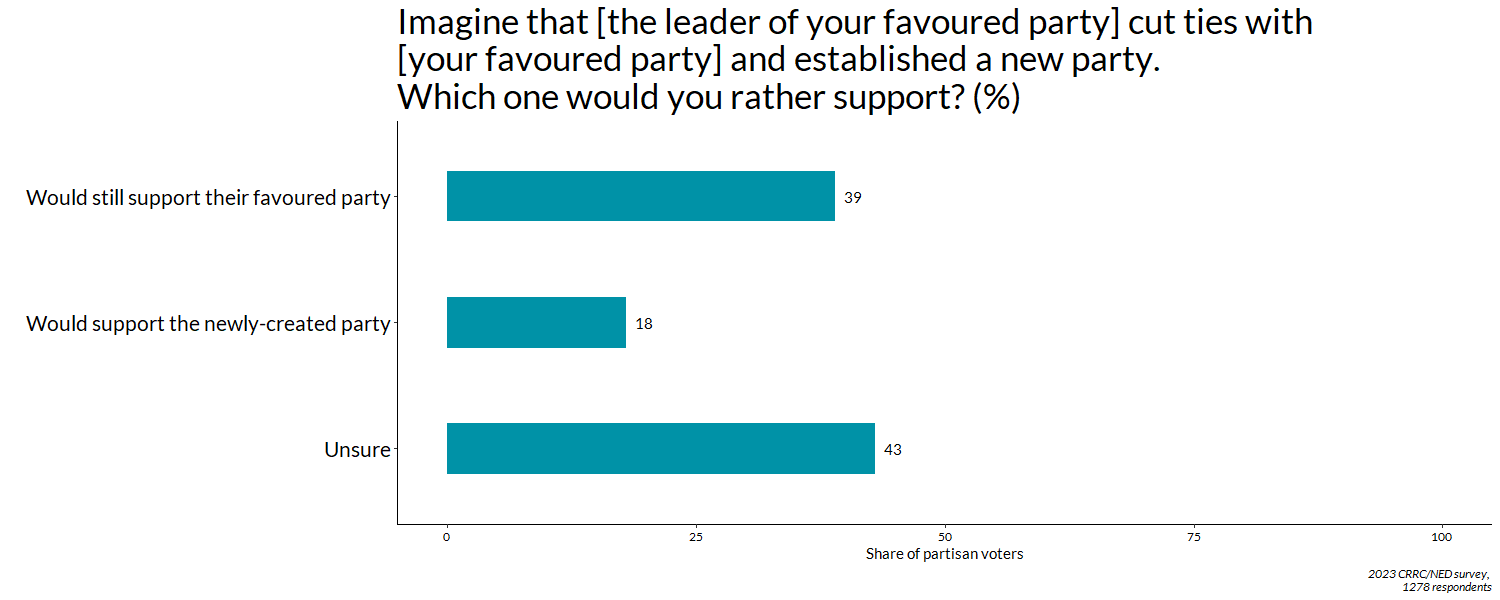
Those respondents who named a political party (35% of respondents to the survey) were then asked to imagine a scenario in which a leader of their favoured party decided to cut ties with the party and establish a new party. Respondents were then asked to report how they would vote—would they still vote for their favoured party, or for the one that had been newly established?

LeaderParty
Bidzina IvanishviliGeorgian Dream
Mikheil SaakashviliUnited National Movement
Giorgi GakhariaFor Georgia
Zurab Girchi JaparidzeGirchi More Freedom
Mamuka KhazaradzeLelo
Irma InashviliAlliance of Patriots
Shalva NatelashviliLabour Party
Zurab MakharadzeConservative Movement - Alt Info 
Giorgi VashadzeStrategy Aghmashenebeli
Giga BokeriaEuropean Georgia
Aleko ElisashviliCitizens
Elene KhoshtariaDroa
Iago KhvichiaGirchi
Anna DolidzeFor the People
Nino BurjanadzeDemocratic Movement
Zviad DzidziguriConservative Party
Fridon InjiaEuropean Socialists
Levan VasadzeERI

Four out of ten partisans (39%) said they would still vote for their favoured party. Approximately every fifth partisan voter (18%) said they would change their partisan preference and would vote for the new party. A plurality of partisans (43%) said they did not know which party they would vote for or refused to answer.    

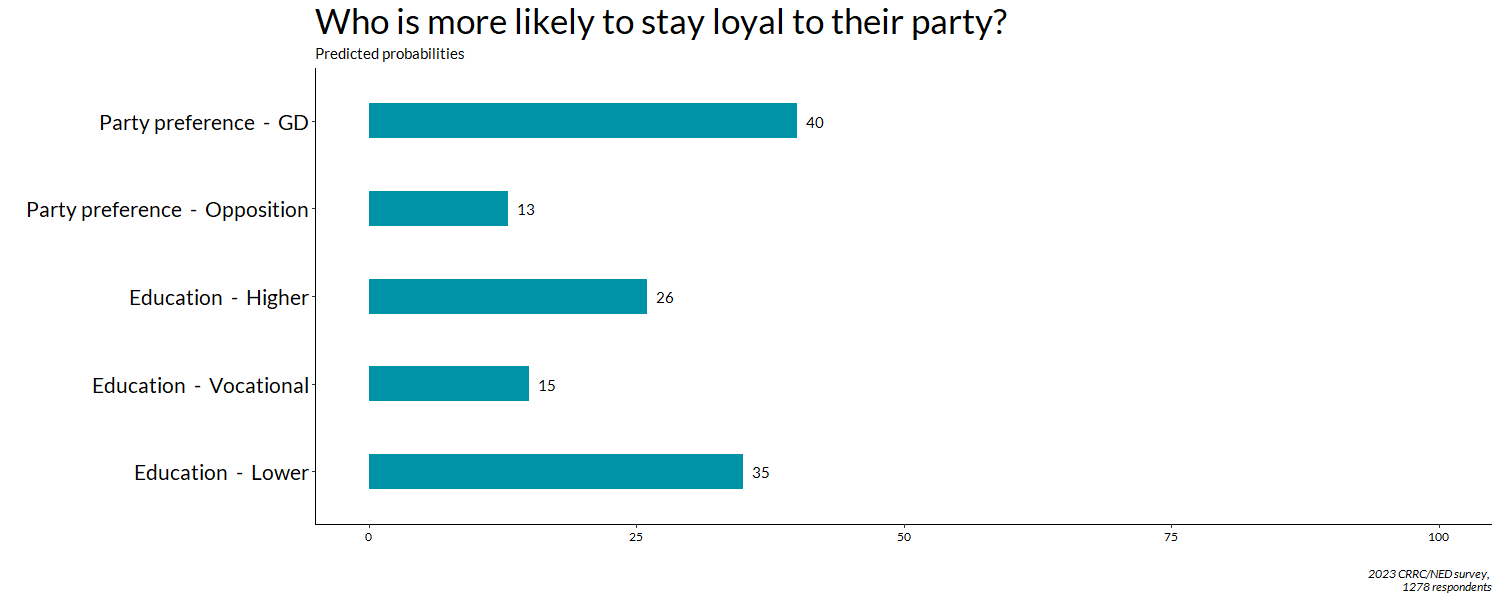
Further statistical analysis shows that some groups are more likely to stick with their favoured party even when its leader launches a new political venture. People with vocational education are less likely to stick with their favoured party than people who have a lower or higher level of formal education.

Party affiliation is also associated with whether or not voters are willing to stick with their current preferred party. Supporters of the ruling party are 27 percentage points more likely to say they would still vote for Georgian Dream if the party’s founder, Bidzina Ivanishvili, established a new party than opposition supporters when asked the same question regarding their parties’ leaders.

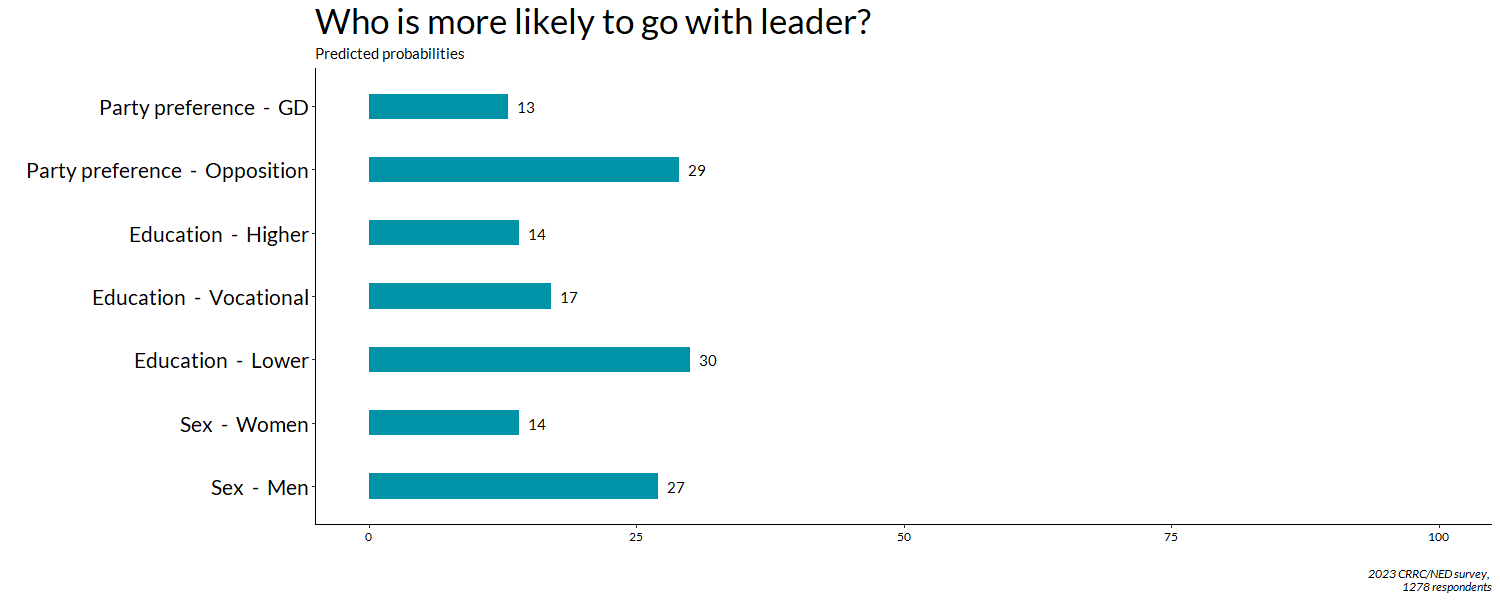
Regarding whether voters are willing to follow their party’s leaders, similar trends emerge. 

Opposition supporters were 16 percentage points more likely to report they would vote for a party newly founded by their party’s leaders than Georgian Dream supporters.

People with lower levels of formal education were more likely to follow their party’s leader than people with higher levels of formal education. 

Men were also more likely to follow a leader to a new party than women.

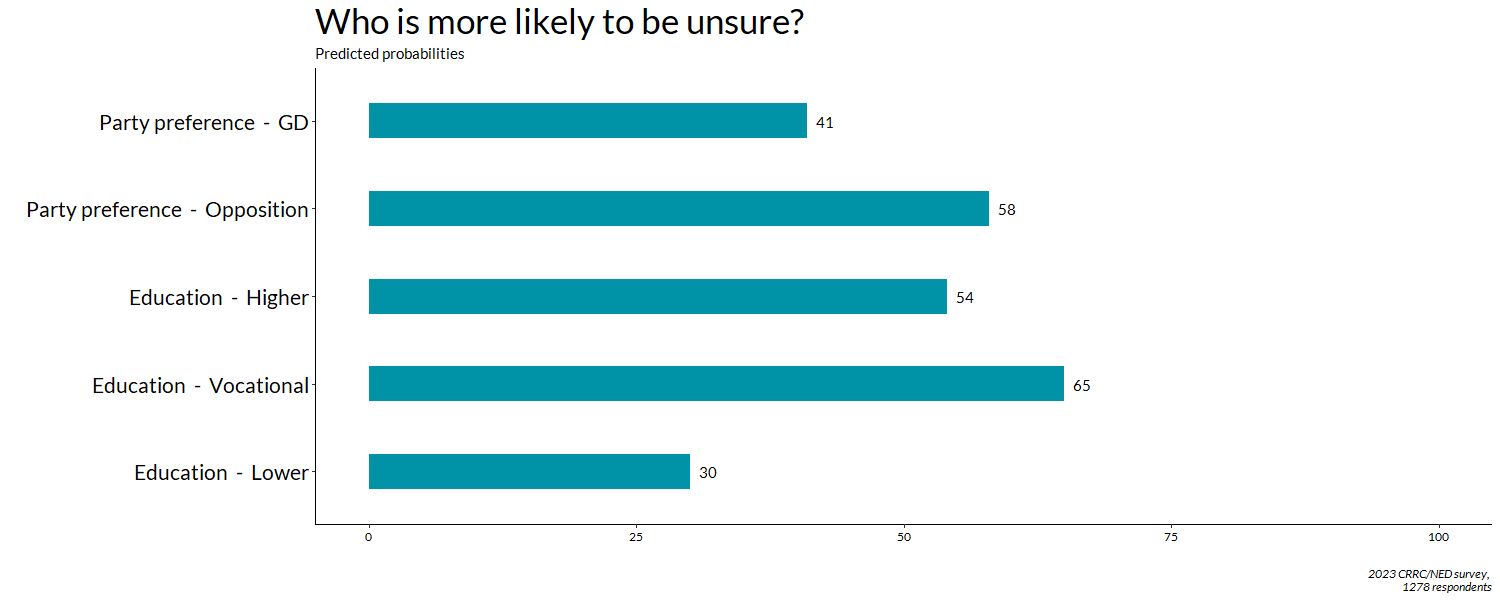
However, opposition supporters were also 17 percentage points more likely to be unsure of how they would vote if the leader of their favoured party established a new party compared with ruling party supporters.

People with higher education and vocational education are more likely to be unsure than people with lower levels of formal education. 

The above data supports the idea that Georgian political parties are at least partially driven by their leaders, with only four out of ten partisans reporting they would stick with their favoured party if its leader launched a new political venture. Moreover, one in eight ruling party supporters and one in three opposition supporters reported they would follow their leader to a new party. 

However, multiple other possible explanations for the data likely explain the differences between ruling party and opposition supporters. 

First, the line between the ruling party and the state is often blurred, meaning that Georgian Dream’s supporters might continue to support the party on the basis of it remaining in power. Second, at the time of the survey, Bidzina Ivanishvili had formally distanced himself from politics. As a result, some Georgian Dream supporters might have supported other leaders within the party and the party’s policies, rather than its founder. Finally, many of the opposition parties which the public reported supporting were founded by former members of the UNM who left or are otherwise dominated by a single personality. In turn, many of their voters are likely already voting for the party based on its leader.

Despite the above, ties appear to be stronger to the party itself for Georgian Dream supporters than for opposition supporters.  

Note: The above data analysis is based on logistic regression models, which included the following variables: age group (18-34, 35-54, 55+), sex (male or female), education (completed secondary/lower, vocational, higher), settlement type (capital, urban, rural), employment status (not working, working in the private sector, working in the public sector), religious attendance (regularly, on special occasions, rarely or never), and party identification (Georgian Dream, Opposition). 

Tuesday, February 22, 2022

How many votes were bought in Georgia’s local elections?

Note: This article first appeared on the Caucasus Data Blog, a joint effort of CRRC Georgia and OC Media. It was written by Dustin Gilbreath, Deputy Research Director at CRRC Georgia, and Givi Silagadze, a Researcher at CRRC Georgia. The views presented in this article are the views of the authors’ alone and do not represent the views of the National Endowment for Democracy, CRRC Georgia, or any related entity.

According to research carried out by CRRC Georgia, 20% of Tbilisi’s population appeared to be willing to sell their vote prior to elections. However, this research also discovered that the popularisation of certain messages may also discourage vote-buying among the population. 

Recent elections in Georgia have featured widespread allegations of electoral fraud. Indeed, the OSCE’s ODIHR, the main election watchdog internationally, said that ‘contestants were able to campaign freely in a competitive environment that was, however, marred by wide-spread and consistent allegations of intimidation, vote-buying, pressure on candidates and voters, and an unlevel playing field.” 

Knowing this type of problem could arise, given that past elections had featured similar allegations, CRRC Georgia attempted to measure and discourage vote-buying in the 2021 municipal elections. To do so, the organisation:

  • Conducted a pre-electoral experiment testing what messages might discourage vote-buying in Tbilisi prior to the elections; 
  • Delivered the most effective message identified in the pre-electoral experiment on posters to 18,000 households, prior to the elections as part of a randomized control trial and; 
  • Measured how effective the messages were at discouraging vote-buying. 

The results point in a positive direction, but are less than conclusive, requiring further research in future elections.

Measuring vote-buying 

Imagine that a stranger came to your home or called you on the phone, and asked you if you use illegal drugs. It is easy to imagine that few people would give an honest response.

To estimate the prevalence of illicit activities, researchers use a method called a list experiment. In list experiments, respondents are shown a list of different activities and asked how many they intend on doing or have done in the past. Half of the respondents are shown a list without a sensitive item and half are shown the same list plus the sensitive activity. By asking respondents how many activities they have engaged in, respondents do not have to tell the interviewer that they have engaged in an illicit activity. 

Researchers can then estimate how many people have engaged in an illicit activity by comparing the average number of activities that the people in the short list group reported versus the number of activities reported by the long list group. 

Willingness to sell a vote

In the lead up to the elections, approximately 3000 Tbilisi residents participated in a survey with the above-described type of experiment. The results suggest that approximately 20% of Tbilisi’s population was willing to sell their vote prior to the election, defined as voting, ‘for a certain candidate in exchange for a gift or money’.

While measuring vote buying can have important implications, discouraging it is arguably better. Indeed, ideally, there would be no vote-buying. In support of this goal, the pre-electoral survey also contained a randomised messaging experiment testing which of five different messages might discourage people from selling their vote most effectively.

The first message attempted to induce embarrassment about Georgia’s declining electoral integrity by comparing the country to positive examples internationally. The second message worked on the same premise, but placed Georgia alongside other countries doing poorly internationally. The third message highlighted the threat that vote-buying presents to Georgia’s western integration prospects. The fourth message reminded the public of the much-maligned ‘dark’ 1990s, which included widespread electoral fraud. The fifth message highlighted the incompatibility of vote-buying with democratic norms. 

The results suggest that the most effective message was the negative international embarrassment message. However, the other messages were also effective, with the exception of the message on democracy. The chart below shows the marginal effect of each message on people’s intentions to sell their votes right after hearing the messages.

Aside from discouraging people from selling their votes, the above messages also changed people’s responses to a set of six questions on attitudes towards vote-buying. The chart below shows the magnitude of the change on a scale varying from 0 to 18 points, with 0 meaning no acceptance of vote-buying and 18 meaning full acceptance of vote-buying. Again, the most effective message on this scale was the message that aimed to embarrass respondents about Georgia’s declining electoral quality, placing it in the ranks of countries that have recently had issues with electoral integrity.

Did the messages work in the real world?

Based on the above results, CRRC conducted a cluster randomized control trial in Tbilisi to test the efficacy of the negative international embarrassment message in the real world. To do so, the organisation designed the poster below, printed 18,000 copies, and delivered these to households that would be interviewed following elections.


After the first round of elections, over 1,200 interviews were conducted with households that did and did not get a copy of the above poster. 

Analyzing these interviews points in a positive direction for the posters, but is far from conclusive. The results point in the direction of vote-buying taking place, and also towards a decline in vote-buying as a result of the posters. However, the results are not definitive, failing to meet standards for statistical significance.

With regard to attitudes, the data indicates some minimal impacts on a few of the survey questions about attitudes towards vote-buying. However, there is no evidence that the poster uniformly shifted attitudes towards less tolerance of vote-buying on the attitude index depicted above. 

What does all of this mean?

The results of the experiment CRRC Georgia conducted are promising, but also definitively inconclusive. They point towards the existence of vote-buying, and they point towards the anti-vote-buying message being effective, but they do not demonstrate this beyond a shadow of a reasonable doubt. 

This conclusion calls for future research. Notably, the pre-electoral survey found statistically and substantively significant effects. However, this survey measured results immediately after respondents heard the message. In contrast, the posters were placed on people’s doorsteps in the weeks leading up to the elections. It is plausible that the effect of the message dissipated over time. In this regard, future research should consider attempts to deliver the message in multiple mediums, multiple times.

The data from the pre-electoral survey also clearly shows that multiple messages were effective, even though the negative international embarrassment message was most effective. In this regard, future research should test out whether delivery of multiple messages and combinations of the above, as well as different messages, is effective at sustaining anti-vote buying attitudes.

Above all, one would hope that this research would be unnecessary in the first place. That it was even conducted points towards a need for the authorities to ensure that vote-buying does not take place.


Wednesday, September 15, 2021

Support for gender equality in parliament is rising in Georgia

This article first appeared on the Caucasus Data Blog, a joint production of CRRC Georgia and OC Media. It was written by Eto Gagunashvili, a researcher at CRRC Georgia. The views presented in this article do not represent the views of the National Democratic Institute, CRRC Georgia, or any related entity. 

Despite the introduction of gender quotas, Georgia’s parliament remains an unequal place in terms of gender. However, the data suggests support for more women in politics is rising.

Women have been and are underrepresented in Georgia’s parliament, with only 17% of seats held by women as of March 2021. This is despite the passage of gender quotas in 2020, according to which parties must nominate at least one woman for every four candidates. 

The discrepancy stems from a mixture of the mixed electoral system and a lack of requirement to name female candidates for the first past the post or majoritarian component of the elections. The legislation passed in 2020 will slowly increase gender quotas, and assuming parliamentary elections become fully proportional, will increase the requirements to one in three candidates being of the opposite gender by 2028. 

In line with legislative changes, CRRC Georgia and NDI’s data suggests that the public has become increasingly supportive of equal representation in parliament for women and men. Notably, support does not vary significantly by partisanship.

From 2014, the CRRC/NDI surveys asked about the best proportion of men and women in parliament. The data show that the share of Georgians who support an equal share of women and men has increased from 32% in 2014 to 49% in February 2021. 

Further analyses suggests women, younger people, and those with a higher education were more likely to support an equal number of men and women in parliament, while older people and men are less likely to do so. 

Women supported equal representation 18 percentage points more often than men, on average, controlling for other factors. 

Young people were 9 and 13 percentage points more likely to do so than people 35–54 and 55+, respectively. 

People with a higher education were 6 percentage points more likely than people with lower levels of education to support an equal parliament. 

Notably, the type of settlement and partisanship were not associated with support for an equal share of men and women in parliament. 

While support for women’s equal participation in politics is on the rise in Georgia, men are less supportive of equality than women, as are older people and those without higher education. 

The data does not suggest differences between supporters of different parties, meaning that support for equality is not a partisan issue for most citizens.

Note: The above analysis is based on a logistic regression, where the dependent variable is equal support for male and female members of parliament. The independent variables include gender, age, settlement type, education, and partisanship. 

Wednesday, December 23, 2020

Political campaigning in Georgia: informing or mobilising?

Note: This article first appeared on the Caucasus Data Blog, a joint production of CRRC Georgia and OC Media. It was written by Dustin Gilbreath, Deputy Research Director at CRRC Georgia. The views expressed in this article do not represent the views of CRRC Georgia, NDI, or any related entity.

Political campaigning takes a wide range of forms, from digital advertising to door knocking. Generally, campaigning is believed to both mobilise voters to actually go out to vote as well as win over voters, but which is most relevant in Georgia? 

Data from the August CRRC Georgia and NDI public opinion poll indicate that people who wanted to be contacted by campaigners also appeared more partisan than others. This may suggest that campaigning in Georgia will be more effective at turning out partisans than persuading the undecided. 

The data also indicates that despite the pandemic, most of the voters that wanted to be contacted wanted that contact to be in person.

Respondents on the August 2020 survey were asked what the best way would be for parties to get in touch with them. The most common responses were contact through small scale public meetings close to home and large scale meetings. Approximately a third of the public (31%) did not want to be contacted.

Who wants contact?

If voters want to be contacted, they may reasonably want more information about their different choices at the ballot box. Alternatively, they may want the parties to excite them (and others) to go to the polls. The data indicates that turning out supporters is likely easier in Georgian elections than winning over undecided voters, because the less partisan voters were, the less likely they were to want contact.

On the survey, 62% of respondents said they would like to be contacted in at least one form, and 31% reported they did not want to be contacted. The remaining respondents were unsure or refused to answer the question (7%).

A regression model suggests people in urban areas outside Tbilisi were eight percentage points more likely to be interested in being contacted. Men and women, people in wealthier and poorer households, those in different age groups, and those working and not did not report significantly different rates at which they would like to be contacted.

Regressions using political preferences suggest that partisans and those actively engaged in politics wanted to be contacted at greater rates than less engaged individuals. 

With regard to party, the data indicate that UNM and Georgian Dream supporters were more likely to want to be contacted than supporters of other parties and those that support no party in particular. 

Decided voters were more likely to want to be contacted than undecided voters. 

Likely voters were substantially (31 percentage points) more likely to want to be contacted than those who did not intend to vote. 


What type of contact?

In August, the COVID-19 case count was rising, though extensive restrictions on activity were not in place. Despite the rising case count, among those that wanted to be contacted, most wanted some form of in-person contact.

Overall, 76% of those that wanted to be contacted named only in-person forms of contact, 16% only distance-based forms of contact, and 8% a mix of the two. In sum, 84% of the public that wanted politicians to reach out to them, wanted it to at least be partially in person.

A regression model suggests that people in rural areas were 18 percentage points more likely to want an in-person contact than those in urban areas including the capital. Younger people (aged 18–35) were 11 percentage points more likely to report wanting in-person contact than others, all else equal.

Demographics aside, people who supported an opposition party aside from the UNM were less likely to report they wanted to be contacted in person. Likely and unlikely voters did not vary significantly on whether they wanted in-person contact or not. Similarly undecided and decided voters had similar views, controlling for other factors.

The above data suggests that during political campaigns in Georgia, people prefer in-person contact, even in the face of the pandemic. 

The people who wanted to be contacted during political campaigns were more likely to be political partisans and engaged in politics. In turn, this suggests that campaigns likely have an easier time turning out supporters than creating them.

The data used in this article is available here.

The results of models looking at how people want to be contacted are multinomial regression models. The first contains demographic variables only. The remaining models included one of the following variables: party support, decided voter or not, and likely voter or not.

The results of models looking at who wants to be contacted are logistic regressions. The first contains demographic variables only. The remaining models included one of the following variables: party support, decided voter or not, and likely voter or not.

Friday, November 03, 2017

Taking partly free voters seriously: autocratic response to voter preferences in Armenia and Georgia

Do voters in less than democratic contexts matter or are elections simply facades used to create a veneer of democratic accountability for domestic and international actors? Within the Autocratic Response to Voter Preferences in Armenia and Georgia project, funded by Academic Swiss Caucasus Net, CRRC-Georgia and CRRC-Armenia aimed to help answer this question, at least for Georgia and Armenia. On October 27, Caucasus Survey published the results of the project in a special issue, available here.

In the introduction of the issue, Koba Turmanidze and Matteo Fummagali ask do voters matter in competitive authoritarian regimes and, if so, how? Do their preferences make any difference in the way in which the regime conceives of policies and goes about policy-making? In their article, they argue that they do, and that incumbents take voters seriously. Crucially, the way the regimes respond to policy demand determines their durability in office. The article explains why, despite strong similarities, the political regime ruling Armenia remained stable over the years (from the mid-1990s), whereas the one in Georgia has been unseated on two occasions (2003–2004 and 2012–2013). Evidence confirms that policy-making and voters’ perceptions thereof also play an important role in determining whether a regime collapses or survives. The incumbents collect information on voter preferences, and devise policies in response to them. Policy-making thus matters and is extremely consequential. Paradoxically, however, policy-making makes a difference in counter-intuitive ways. The article concludes that a regime which refrains from making grand promises, or blatantly contradictory or unrealistic ones, has greater chances of surviving than those that set out to transform society, like Saakashvili’s Georgia. Ultimately, such policies backfire on those who launched them.

In the second article in the issue, Dustin Gilbreath and Koba Turmanidze highlight how state capacity volatility and growth affects political survival. Political science has dedicated extensive attention to the determinants of regime change as well as its relation to state capacity. Less work has focused on incumbent political survival and state capacity. Building on selectorate theory (Bueno De Mesquita et al., 2005), the article suggests that the chance of the party of the incumbent remaining in office is partially a function of the capacity of the state they hold power over. However, the authors also hypothesize that state capacity volatility decreases an incumbent’s chances of winning elections. To empirically test these hypotheses, the article uses a cross country statistical analysis complemented by illustrative case studies of policy making from Armenia and Georgia. The analyses support the above two hypotheses, showing that if the incumbent increases state capacity, it increases their chances of staying in office. However, capacity volatility decreases their chances of survival. While Georgian state capacity developed in fits, jumps, and starts, in Armenia state capacity developed at a slow and steady pace for most of its independence. As the aphorism goes, slow and steady wins the race with politicians being thrown out of office in Georgia and the incumbent in Armenia maintaining its power. Based on the analyses presented in the analyses, the authors suggest that a self-defeating game is at work for reformers.

In the third article in the issue, Dustin Gilbreath and Sona Balasanyan take a historic look at election fraud in Armenia and Georgia. In the article they note that elections on unfair playing fields are common, yet election day fraud can result in authoritarians losing office. The freer the environment, the more an authoritarian must rely on means other than election day fraud to retain office, because they are less capable of coercing the population without facing repercussions. Among those other means is cooptation through public policy. A common theme in the special issue is that public policy has been of greater import in Georgia than Armenia. The article makes a contribution to explaining the phenomenon using comparative case studies of election day fraud in Armenia and Georgia over time. To do so, the article uses methods from the field of election forensics to provide a quantitative comparison of the scale of election day fraud in each country’s elections since 2007 using precinct level election results for parliamentary and presidential elections. The test results suggest, as has been widely believed, that Georgia’s elections have had less election day fraud than Armenia’s during this period. This finding provides a theoretical basis to explain why public policy has been a greater concern in Georgia than Armenia.

In the fourth article in the issue, Giorgi Babunashvili argues that while voters are often assumed to be of tertiary importance in less than democratic contexts – the regime can manipulate, buy, or outright steal their votes goes the predominant logic – in reality, voters not only matter but engage in retrospective voting in Georgia, a country with imperfect political competition. Analysis of two waves of nationally representative survey data from 2012 to 2015 supports the retrospective voting theory, with a positive relationship between voter support for the incumbent party and positive assessments of government policies related to socio-economic, democratization, and security issues. Citizens who assess government policies negatively are more prone to voting for opposition candidates or not voting at all compared to those who are more satisfied with the government's performance in Georgia. Notably, these findings are very similar for two governments led by two very different parties in Georgia: the United National Movement (2008–2012) and Georgian Dream – Democratic Georgia (since 2012). Hence, the author concludes that disregarding voters’ preferences has negative consequences for the legitimation and survival of the incumbent.

In the fifth article in this issue, Koba Turmanidze asks: Lie a little or promise a lot? This is a question many politicians face when campaigning before elections. The paper examines whether voters support ambiguous pre-election promises in Armenia and Georgia using an experimental design and if so, what it tells us about accountability mechanisms and a potential accountability trap. The accountability trap emerges when voters cannot hold their elected officials accountable for their promises due to their ambiguity and become disillusioned with political participation. The paper looks at how voters’ expected political behaviour changes in response to randomly assigned types of electoral promises from a hypothetical party. The paper shows a positive effect of ambiguity: if a party makes an ambiguous promise, it will do significantly better in Georgia and at least not worse in Armenia than a party promising a specific policy option. The effect of ambiguity partially explains why parties have been poor at putting forward coherent electoral programs in Armenia and Georgia. More broadly, the findings contribute to understanding the problem of accountability in hybrid regimes, which may lead to representation crises.

In the sixth article in the issue, Rati Shubladze and Tsisana Khundadze point out that voters care about policy, and this is true for democracies as well as hybrid regimes. To show how incumbents’ policy choice influences political continuity and change they look at public policies in Armenia and Georgia from 2004 to 2013. The paper is grounded in Gerschewski’s theoretical framework that views legitimation, repression, and co-optation as the three strategies or pillars of stability in less than democratic regimes. The authors describe each pillar as a set of specific policies designed by ruling parties to gain legitimacy in the eyes of voters, as well as policies aimed at co-optation and/or repression of political opponents. Hence, they demonstrate that the key to the incumbent’s electoral survival is the stabilization process between pillars, i.e. complementary application of policies based on available resources. However, the application of different stabilization strategies is not enough and timing, organization, and balance between pillars are also crucial for maintaining voters’ support for the incumbent. Based on secondary statistical evidence and primary qualitative data analysis, they show how the Armenian government managed to balance the pillars of stability by the effective and well-timed application of different policies, while the government of Georgia failed to use relevant pillars of stabilization when one of the pillars did not work to the incumbent’s advantage.

Overall, the issue makes the case that voters - even in less than democratic contexts - matter.  To view the articles, click on the links above or here for the entire issue.


Sunday, February 26, 2017

Are there ways to encourage young people to vote?


During the 2016 parliamentary election campaign in Georgia a political party released a commercial encouraging young people to participate in the upcoming elections. As the commercial claimed, in order to change the current political situation, where political parties use populist promises in an attempt to attract older, politically more active voters, younger voters need to turn up at the voting booth and have their say. However, as in 2012, a relatively small share of younger voters participated in the 2016 elections.

According to the results of the CRRC/NDI post-electoral November 2016 survey, there is a generational gap between voters in Georgia. During both the October 8 parliamentary elections and the October 30 run offs in 2016, people who were between 18 and 35 years old reported voting less than older people.


Note: In almost all countries, there is a considerable difference between self-reported voter turnout as seen in survey findings and official turnout. The most widespread explanation for this fact is social desirability bias i.e., when respondents who did not vote are embarrassed to admit it. Thus, they report that they voted. The same difference is observed in surveys conducted in Georgia, including the CRRC/NDI post-electoral survey. 

A number of surveys suggest that young people in Georgia are indifferent towards politics. For instance, those who are younger report discussing politics and current events with friends and close relatives less frequently compared to those who are older. As the chart below shows, though, the reported lack of interest in politics was not the most frequently named reason why people of any age group did not vote. Notably, voters under the age of 56 frequently reported that they were registered to vote in a different settlement than the one they live in, and could not go to their precinct on election day.


Note: The question was asked to the 23% of respondents who reported they did not vote in the October 8th parliamentary elections and the October 30th runoff. Answer options "I wasn’t registered", "I didn’t know where my polling station was", and "I couldn’t decide how to vote" were combined in the category “Other”. 

A lack of interest in politics and low levels of political participation among young people is common not only in Georgia, but in many countries. A number of complex issues are believed to explain this phenomenon e.g., not having much of a stake in society or preferring other types of activities to express their political and social views. Still, the reported reasons for not voting are very similar in Georgia for young people and those who are 36 to 55 years old. Certain practical steps could help increase turnout in these age groups e.g., absentee ballots or the introduction of online voting. Importantly, as the Minister of Justice of Georgia has already noted, the country has the technical capacity to launch an online voting system. This could encourage more people to vote, and potentially not only the young ones.

What else might encourage young people to vote? Join the discussion on our Facebook or Twitter. To explore the CRRC/NDI November 2016 survey findings, visit CRRC’s Online Data Analysis portal.

Monday, November 07, 2016

Who watches foreign television news in Georgia?

Foreign influence in Georgia's media is a popular topic of discussion for the press, academic researchers, politicians, and press freedom watchdog groups alike. However, they focus mainly on media sources’ countries of origin, content of news reporting, and the effect(s) on public opinion in Georgia. Missing from the conversation is an understanding of who actually consumes foreign media in Georgia. This is an important piece of the puzzle. A link between foreign media consumption and voting behavior in Georgia is a popular supposition, but is impossible to test without an understanding of who foreign media’s audience is. The June 2016 CRRC-NDI survey Public Attitudes in Georgia provides interesting information about some characteristics of foreign language TV viewers in Georgia. Notably, the survey results show that while more viewers of news programs on foreign language TV channels reported that they would vote if elections were held tomorrow, there are not large differences in support for the four major political parties in Georgia between those who watch news on foreign TV and those who only watch Georgian-language news programs.

TV is the main source of information about politics and current events for a majority of Georgia's population—77% pick TV as their primary source, and an additional 12% choose it as their secondary source. However, only 23% of the population of Georgia, irrespective of whether they name TV as their primary or secondary source of information, reports watching programs on politics and current events on foreign TV channels. Four out of the five most frequently mentioned foreign language TV channels watched by these 23% broadcast in the Russian language (Russia Channel One, RTR, Russia 1 and Russia 24), while the fifth (Euronews) broadcasts in both English and Russian.

How does the 23% of Georgia’s population that watches programs on politics and current events on foreign TV channels compare demographically and politically to the rest, who report only watching news on Georgian-language channels? Some characteristics of the former group are intuitive. For example, about half of the population of ethnic minority settlements (52%) report watching the news on foreign language TV channels. In contrast, only a quarter of the population in urban settlements outside of Tbilisi report watching the news on foreign language TV channels, while those living in Georgia’s rural non-ethnic minority settlements report the lowest viewership (14%).


A larger share of viewers 36 and older tend to watch foreign (especially Russian-language) TV channels for information on politics and current events than younger viewers. This likely reflects the patterns of knowledge of the Russian language in Georgia. According to the CRRC’s 2015 Caucasus Barometer survey, 40% of Georgia’s population 35 and younger report either not having any knowledge, or a beginner’s level of knowledge of the Russian language, compared to only 19% of the population between 36 and 55, and 27% of the population who are 56 and older.

On the other hand, some characteristics of foreign news program audiences in Georgia are not as obvious. For example, a slightly higher share (25%) of those who reported that they would vote in parliamentary elections if they were held tomorrow watch foreign language news programs than likely abstainers (19%). Twenty-eight percent of decided voters also reported that they follow programs on politics and current events on foreign channels, compared to 20% of undecided voters.


Note: A 10-point scale was used to record the answers to the question, “If parliamentary elections were held tomorrow, would you vote or not?”, where option 1 corresponded to the answer “Certainly will not vote”, and option 10 corresponded to the answer “Will certainly vote”. For this blog post, the original scale was recoded, so that those choosing option 10 were coded as “Likely voters” (67%), while all those choosing options were grouped into “Likely abstainers” (33%).

If viewers of foreign TV news report slightly more often that they are likely to vote, and that they have made a decision regarding who to vote for, the question emerges – are their political affiliations any different from their counterparts who only watch domestic TV news? Interestingly, the party preferences of the two audiences show no statistically significant differences between them. Even when the data are separated further to distinguish between viewers of Russian-language TV and other foreign language TV, there is no difference in reported party preferences between the groups.

Hence, watching programs on politics and current events on foreign TV channels does not appear to tilt voters towards particular parties. Deciding which political party to vote for in Georgia is a complex process. Understandably, voters take into account a large number of individual, social, and political factors when making decisions at the voting booth. While viewers of foreign TV news may be slightly more willing to vote, and surer of their voting choices, the choices they make are similar to those who watch domestic TV channels.

To explore the data in more depth, try CRRC's Online Data Analysis tool. If you are interested in the landscape of popular media in Georgia, check out CRRC's earlier blog posts on the role of the Georgian Public Broadcaster, Georgia's press freedom ranking, and Russia's influence on Georgia's media.

Monday, August 22, 2016

Making Votes Count: Logical Inconsistencies in Voting Records

In order to help monitor the fidelity of the October 2016 parliamentary election results, CRRC-Georgia will carry out quantitative analysis of election-related statistics using methods from the field of election forensics within the auspices of the Detecting Election Fraud through Data Analysis (DEFDA) project. The Project is funded by the Embassy of the United States of America in Georgia, however, none of the views expressed in the following blog posts represent the views of the US Embassy in Georgia or any related US Government entity.

On Friday, August 19th, CRRC-Georgia presented and published a pre-analysis report for the project, which contained analysis of the new electoral boundaries set up following the 2015 constitutional court ruling that the previous boundaries were unconstitutional. The report also demonstrated how the methods of statistical analysis that CRRC-Georgia will use to monitor the 2016 elections work in practice. To do so, we used precinct level data from the 2012 party list elections. Specifically, CRRC-Georgia carried out two types of statistical analyses:

  • Logical checks of official election returns, which test whether there were data entry errors when the vote was being recorded and collated; 
  • Tests for statistical anomalies in the official electoral returns, which may suggest electoral malfeasance. 
While today’s blog shows the logical checks that CRRC will apply to the final CEC vote records, tomorrow we will discuss the tests used to identify statistical anomalies in vote counts.

Logical inconsistencies in voting records
For the 2016 elections we will carry out two types of checks of the logical consistency of votes. Specifically, we will check:
  • Whether there are more or less votes and invalid ballots than signatures recorded on voter rolls;
  • Whether turnout increases over the course of the day.
Voter signatures - Votes recorded - invalid ballots ≠ 0
Taken together, the number of signatures recorded for ballots minus the number of votes recorded minus the number of invalid ballots should equal zero. However, in the 2012 parliamentary proportional list elections this was not the case in approximately 25% of precincts. From the 3,680 precincts which had ten votes or more:
  • 936 precincts had more or less signatures than votes and invalid ballots (25% of all precincts); 
  • Of these, 918 had more signatures registered than votes recorded for a party or ballots registered as invalid combined; 
  • 18 precincts had fewer signatures than votes registered for a party and invalid ballots combined.
These phenomena likely have numerous causes. While some are problematic, others are benign.

To start with the 918 cases of fewer votes registered for a party or invalid ballots than signatures recorded, the severity of the issue varies widely. In order to provide some sense of the gravity of the issue, we have grouped precincts by the number of extra signatures into three categories: unlikely to be problematic (1-9 extra signatures), potentially problematic (10-49 extra signatures), and suspicious (50 or more extra signatures). Table 1 presents the number of precincts that fall into each category:


Unlikely to be problematic Potentially Problematic Suspicious
# of Precincts 816 (89%) 56 (6%) 46 (5%)
Count foreign 0 4 42

Notably, of the 46 suspicious cases, 42 are in foreign precincts. With foreign precincts, we strongly suspect that there was a data entry error as discussed in more depth in our report. Among domestic precincts, there are four suspicious precincts with more than 50 extra signatures. In Marneuli’s 22nd precinct, there were 51 extra signatures. In Khashuri’s 32nd precinct, there were 63 extra signatures. In Gori’s 63rd precinct, there were 71 extra signatures, and in Bolnisi’s 62nd precinct, there were 87 extra signatures.

Potential causes for this situation include voters coming to polling stations, and:
  • Signing the voter list and leaving without voting;
  • Voting only in the majoritarian race rather than in both the proportional and majoritarian races;
  • Additionally, Precinct Electoral Commissions may have inaccurately recorded votes, invalid ballots, and/or signature counts.
In 18 cases, there were less signatures on voter rolls than ballots declared invalid and votes recorded. In 17 of the 18 cases there were 10 votes or less that were without a signature. However, in Gori there were 196. This may stem from a recording error, since there was a very high number of invalid ballots (221), or this may stem from another issue. Generally however, the causes of there being more votes and invalid ballots than signature recorded, the causes are less benign. They include:

  • Precinct electoral commissions may have incorrectly counted or reported vote statistics;
  • Voters were allowed to vote without signing the voter list;
  • Ballot box stuffing occurred.

Declining turnout
Another clear logical inconsistency in the official statistics on the 2012 elections is that the number of votes in several precincts declined between 12PM and 5PM, as well as in one district between 5PM and 8PM. That is to say, according to the official record, fewer people had voted at 5PM, in total, compared to five hours earlier at 12PM in these districts.

District
Saburtalo Nadzaladevi Dmanisi Dmanisi Akhalkalaki Mestia Kobuleti
Precinct 63 44 23 30 48 25 14
Votes between 12PM and 5PM -1 -159 -19 -58 -40 -43 -210

This is likely to be caused by a reporting error, with precinct officials recording the number of votes between these hours rather than the total number of votes at 5PM.

Conclusions
While each of the above logical inconsistencies in recording the vote is clearly an issue, which could imply malfeasance, we strongly suspect that the vast majority of cases described above stem from recording and data entry errors. While, we do not suspect malfeasance in any particular case, and do not believe that recording issues affected the outcome of the 2012 elections, the illogical recording of the vote is a serious issue.

In Georgia, elections and the outcomes of elections are regularly contested, with accusations of all sorts following the results. If Georgian voters see that the voting records have logical inconsistencies in them, this could undermine citizens’ confidence in the accuracy of the vote, and thus the legitimacy of election results.

Based on this, we recommend that the Central Election Commission, District Election Commissions, and Precinct Election Commissions check for logical inconsistencies in election protocols on election day and explain logical inconsistencies in a public and transparent manner if they do occur. Particular emphasis in trainings should be placed on how to fill out voter protocols.

In Thursday’s blog, we show how we will carry out tests for electoral malfeasance in the 2016 elections using tests from the field of election forensics. In the meantime, check out our full report or this visualization of the issues which Jumpstart Georgia created.