Monday, February 06, 2017

The state procurement system in Georgia: Companies’ views (Part 2)

The first part of this blog post presented findings about Georgian companies’ participation in the state procurement system. This post provides an overview of companies representatives’ assessments of the state procurement system and how these assessments differ depending upon the company’s participation or non-participation in the state procurement process.

Company representatives report that their main sources of information about state procurement include the websites of procuring state entities (17%) and the State Procurement Agency’s Unified Electronic System (16%). However, representatives of companies that do not participate in state procurement report that they do not or cannot get information about the state entities’ procurement tenders.


Note: The number of answer options was not limited during the interviews.

Most companies (60%) report trusting the State Procurement Agency, with only a small share (8%) saying they do not trust it. At the same time, almost a third of companies (30%) say they don’t know whether they trust the Agency or not. Notably, representatives of companies which have never bid on state procurement tenders answer “don’t know” more frequently than representatives of companies that have. Moreover, representatives of the companies which have participated in the state procurement process at least once report trusting the Agency more often than the non-participating companies. This result likely indicates that the participating companies’ experiences working with the State Procurement Agency were positive.


Responses to the question, “How much do you agree or disagree that companies which have connections with the government win tenders?” also vary based on whether companies have experience participating in the state procurement system. Representatives of companies that have such experience disagree with this statement more often. Moreover, representatives of companies which have not participated in the state procurement system respond “don’t know” twice as often as participating companies.


Around one third (36%) of the companies that have participated in state procurement think that tenders are often “tailored” to one specific company and the goal is to ensure that this particular company wins. However, almost half (48%) of the participating companies do not agree with this statement. While 27% of the companies which have participated in the state procurement system agree with the statement that tenders may be repeatedly rejected by the procuring side with the aim of awarding the contract to a particular company through simplified tender, almost half disagree with this statement.


Note: This question was asked to the representatives of the 17% of companies that have participated in the state procurement system.  

As the findings presented in this blog post show, representatives of companies that have participated in the state procurement system at least once assess the State Procurement Agency’s work more positively. Most of them trust the Agency and believe that there is no need to have connections with the government to win tenders. Most representatives of companies that have not participated in the state procurement system have difficulty stating their opinion on these issues. The findings presented in this blog post indicate that the State Procurement Agency should do more to raise awareness among companies about the state procurement system.

To explore this topic more, take a look at CRRC-Georgia’s report Survey of companies on state procurement. 


Friday, January 27, 2017

The state procurement system in Georgia: Companies’ views (Part 1)

The Unified Electronic System for State Procurement was introduced in Georgia in 2010. The system aimed to simplify the state procurement process and make it transparent. According to the State Procurement Agency, “Every year, the state spends hundreds of millions of lari on procurement of different kinds of goods, services and construction. … Accordingly, private companies ought to be interested in state procurement as an important potential source of increasing their incomes.” However, according to the findings of a Survey of companies on the state procurement system conducted by CRRC-Georgia for Deloitte Consulting LLP and USAID in August 2016, a majority of companies do not actively participate in the state procurement process. Based on CRRC-Georgia’s report on the subject, this blog post discusses problems with the system in the companies’ views.

According to the State Procurement Agency’s 2015 annual report, 15.6% of active companies have bid on state procurement tenders (pg.17). On CRRC-Georgia’s survey 17% of companies report taking part in the state procurement process, and approximately half of these companies report doing so only sometimes or rarely. Seventy-three percent of companies report not being registered in the Unified Electronic System for State Procurement (UES), which is a requirement for bidding on state procurement tenders.


Note: 2% of companies, whose representatives answered “Don’t know” to the question: “Is your company registered in Unified Electronic System for State Procurement?” were excluded from the analysis. 

The results of the survey provide some insight about why companies do not participate in state procurement. Most frequently (56%), a lack of interest in participating in the state procurement process was mentioned as the main reason for not participating. We do not, however, have any information about why there is a lack of interest. The second most common reason company representatives mentioned for not participating was that the tenders announced are not applicable to the company’s field of activity (27%).

Note: Only answers of the representatives of companies that are not registered in the Unified Electronic System for State Procurement (73%) are presented in the chart above. 

A majority of companies (64%) report having no information about the announcement of state procurement tenders. Given this general lack of information, it is not surprising that their representatives found it difficult to assess how fairly different types of tenders are conducted. Notably, representatives of 76% of the companies report they have not heard about seminars which the State Procurement Agency conducts with the aim of increasing the knowledge of business people about the state procurement system.


Note: The chart shows distribution of answers of the 83% of companies that have not participated in state procurement system. Companies whose representatives answered “Refuse to answer” to the question are excluded from analysis. There are five types of state procurement tenders in Georgia: simplified procurement, simplified electronic tender, electronic tender, consolidated tender and contest. Definitions of each type of tender are available here.

It is possible that the lack of information is an obstacle to greater participation in state procurement processes. Thus, the State Procurement Agency should better inform companies about its activities.

The second part of this blog post, which will be published next Monday, shows how representatives of companies assess the state procurement system based on whether they have or have not participated in the state procurement system.

Tuesday, January 24, 2017

Developing the “culture of polling” in Georgia (Part 2): The misinterpretation and misuse of survey data

[Note: This is the second part of a guest blog post from Natia Mestvirishvili, a Researcher at International Centre for Migration Policy Development (ICMPD) and a former Senior Researcher at CRRC-Georgia. The first part of this blog post is available here. This post was co-published with the Clarion]

The misinterpretation of survey findings is a rather widespread problem in Georgia. Unfortunately, it often leads to the misuse of data, which not only diminishes the importance of survey research, but also leads to more serious consequences for the country.

To illustrate how one might misinterpret survey data, the following example from CRRC’s 2015 Caucasus Barometer survey can be used. When asked, “What do you think is the most important issue facing Georgia at the moment?”, only 3% of the population mentioned low pensions, 2% the unaffordability of healthcare, and 2% the low quality of education. A number of issues including the violation of human rights, unfairness of courts, corruption, unfairness of elections, unaffordability of professional or higher education, the violation of property rights, gender inequality, religious intolerance and emigration were grouped into the category “Other”, because, in total, only 7% of the population mentioned these issues.

Based on these findings, one might think that these issues are unimportant in Georgia. However, this would be a misinterpretation, which happens for a number of reasons. Here, I focus on two. The first is:

1. Not paying attention to the exact formulation (wording) of the survey question, answer options, and instructions 

One reason a large share of the population did not mention the violation of human rights, gender inequality and religious intolerance as important issues is because each respondent could name only one issue. The options they chose (unemployment and poverty were named most often) were more important to them than human rights, gender inequality, and religious intolerance.

If a different question – “How important is the issue of human rights [or gender inequality, or religious intolerance] for Georgia?” – had been asked, the share of people who would answer that these issues are important would very likely be much higher than one or two percent. This wording would make people judge the issue not in relative, but absolute terms.

While working with survey findings, the exact wording of question(s) should always be taken into account. When the question is interpreted or reworded, it will almost inevitably lead to some degree of misinterpretation. More often than not, fieldwork instructions should also be taken into account. For example, was a show card used for the question? Was the number of answer options a respondent could choose limited or not?

Thus, it is crucial that survey results are understood and reported, keeping in mind the exact wording of the question(s), answer options provided, and any instruction(s) that had to be followed during the interviews. This will help minimize the risk of misinterpretation.

A second common cause of misinterpretation of public opinion polls in Georgia is:

2. Interpreting public opinion survey results as ‘reality’ rather than perceptions 

Even if the question discussed above had been asked so that the absolute rather than relative importance of the issues was measured and the survey findings still suggested that people thought the violation of human rights, gender inequality and religious intolerance were not important issues for the country, the findings should not be interpreted as a direct reflection of ‘reality.’ As discussed in the first part of this blog post, public perceptions are not ‘reality’.

Interpreting public perceptions as objective ‘reality’ is incorrect, because both perceptions and misperceptions, information and misinformation shape public opinion. It is equally important to remember that, sometimes, ‘reality’ simply does not exist. Moreover, as a number of studies have shown, it is often the case that people are simply wrong about a wide variety of things.

None of the above, however, diminishes the role and importance of public opinion polls. In fact, the misperceptions that survey findings can uncover are often among the most important outcomes for policymakers. Instead of putting an equal sign between public perceptions and ‘reality,’ data analysts and policymakers should critically analyze and address gaps between the two.

Going back to the above example, an accurate interpretation would consider the findings in the context of other studies that are specifically focused on human rights (or gender equality or religious tolerance). Indeed, numerous studies indicate that Georgia has serious problems with all three issues i.e., the population does not have much respect for human rights, gender equality, or people of other religions. Only looking at the latest Human Rights Watch report on Georgia makes this quite clear.

Looking at inconsistencies between people’s answers to different questions, or between survey findings and other types of data when available and relevant, is a good way to uncover misperceptions. For example, a 2014 CRRC/NDI survey found that roughly every fourth person reports there is gender equality in Georgia. However, about half of those who think so also think that taking care of the home and family makes women as satisfied as having a paid job, and that in order to preserve the family, the wife should endure a lot from her spouse.

The answers to these three questions should be presented and discussed not separately, as independent findings, but rather as interrelated findings that, taken together, give a better understanding of the assessments of and attitudes towards gender equality in Georgia. In this context, the question that needs to be raised and answered is why and how this inconsistency between answers occurs.

The misuse of survey findings happens when findings are presented and used in a way that reinforces people’s misperceptions and prejudices. The misinterpretation of findings often leads to their misuse, and eventually, can lead to serious issues.

Again, going back to the most important issue example, it would be a misuse of survey findings to conclude that since the violation of human rights, religious intolerance or gender inequality seem to not be perceived as important issues in Georgia, no policy is needed to address them. As demonstrated above, alternative sources show that these issues need to be addressed, and, at the very least, awareness of them needs to increase. Thus, policy intervention is needed.

What the survey findings tell us in this case is that people underestimate the importance of these issues. In turn, this contributes to the worsening of the problems. If you believe gender inequality or religious intolerance are not important, you probably would not care about these issues either. Thus, the larger is the gap between public perceptions and reality, the more important it is for policy makers to address the issue.

Public opinion should not be used as a directive for policy making without careful analysis of misperceptions and alternative sources of information.

Unfortunately, in Georgia sometimes it’s exactly the misperceptions that drive policy. Speaking of recent developments, misperceptions about homosexuality have lead politicians to talk more about the prohibition of same-sex marriage, something that has never been allowed in Georgia in the first place, than about human rights issues. Misperceptions about gender roles led politicians to reject a proposal that would define femicide as a premeditated murder of a woman based on her gender. Looking forward, the country cannot allow the misperception that the EU threatens Georgia’s traditions to drive the country’s foreign policy.

Now more than ever, when Georgia is still attempting to transition into a stable, democratic country, the country needs policymakers and researchers who have the knowledge and skills to critically analyze survey findings and use their potential for the development of the country.


Monday, January 16, 2017

Developing the “culture of polling” in Georgia (Part 1): Survey criticism in Georgia

[Note: This is a guest post from Natia Mestvirishvili, a Researcher at International Centre for Migration Policy Development (ICMPD) and former Senior Researcher at CRRC-Georgia. This post was co-published with the Clarion.]

Intense public debate usually accompanies the publication of survey findings in Georgia, especially when the findings are about politics. The discussions are often extremely critical or even call for the rejection of the results.

Normally criticism of surveys would focus on the shortcomings of the research process and help guide researchers towards better practices to make surveys a better tool to understand society. In Georgia most of the current criticism of surveys is, unfortunately, counterproductive and mainly driven by an unwillingness to accept the findings, because the critics do not like them. This blog post outlines some features of survey criticism in Georgia and highlights the need for constructive criticism aimed at the improvement of research practice, because constructive criticism is extremely important and useful for the development of the “culture of polling” in Georgia.

Often, discrepancies between the findings and the critics’ opinion about public opinion cause criticism of surveys in Georgia. Hence, the survey critics claim that the findings do not correspond to ‘reality’. Or rather, their reality.

But, are surveys meant to measure ‘reality’? For the most part, no. Rather, public opinion polls measure and report public opinion which is shaped not only by perceptions, but also by misperceptions i.e., the views and opinions that people have. There is no ‘right’ or ‘wrong’ opinion. It is equally important that these are opinions that people feel comfortable sharing during interviews –while talking to complete strangers. Consequently, and leaving aside deeply philosophical discussions about what reality is and whether it exists at all, public opinion surveys measure perceptions, not reality.

Among the many assumptions that may underlie criticism of surveys in Georgia, critics often suggest that:

  1. They know best what people around them think;
  2. What people around them think represents the opinions of the country’s entire population. 

However, both of these assumptions are wrong, because, in fact:

  1. Although people in general believe that they know others well, they don’t. Extensive psychological research shows that there are common illusions which make us think we know and understand other people better than we actually do – even when it comes to our partners and close friends;
  2. Not only does everyone have a limited choice of opinions and points of view in their immediate surroundings compared to the ‘entire’ society, but it has also been shown that people are attracted to similarity. As a result, primary social groups are composed of people who are alike. Thus, people tend to be exposed to the opinions of their peers, people who think alike. There are many points of view in other social groups that a person may never come across, not to mention understand or hold; 
  3. Even if a person has contacts with a wide diversity of people, these will never be enough to be representative of the entire society. Even if it were, individuals lack the ability to judge how opinions are distributed within a society.


To make an analogy, assuming the opinions we hear around us can be generalized to the entire society is very similar to zooming in on a particularly large country, like Canada, on a map of a global freedom index, and assuming that since Canada is green, i.e. rated as “Free”, the same is true for the rest of the world. In fact, if we zoom out, we will be able to see that the whole world is all but green. Rather, it is very colorful, with most of the countries being of different colors than green, and “big” Canada is no indication of the state of the rest of the world.


Source: www.freedomhouse.org

People who think that what people around them think (or, to be even more precise – who think that what they think that people around them think) can be generalized to the whole country make a similar mistake.

Instead of objective and constructive criticism based on unbiased and informed opinions and professional knowledge, public opinion polls in Georgia are mostly discussed based on emotions and personal preferences. Professional expertise is almost entirely lacking in those discussions.
Politicians citing questions from the same survey in either a negative or positive context, depending on whether they like the results or not, is a good illustration of the above claim. For example, positive evaluations of a policy or development by the public is often proudly cited by political actors without doubting the quality of the survey. At the same time, low and/or decreasing public support for a particular party according to the findings of the same survey is “explained away” by the same actors as poor data quality. Subsequently, politicians may express their distrust in the research institution which has conducted the survey.

In Georgia and elsewhere, survey criticism should be focused on the process of research and should be aimed at its improvement rather than the rejection of the role and importance of polling. It is the duty of journalists, researchers and policymakers to foster healthy public debate on survey research. Instead of emotional messages aimed at demolishing trust in public opinion polls and pollsters in general, rationally and carefully discussing the research process and its limitations, research findings and their meaning/significance and, where possible, pointing to possible improvements of survey practice is needed.

Criticism focused on “unclear” or “incorrect” methodology should be further elaborated by professionally specifying the aspects that are unclear or problematic. Research organizations in Georgia will highly appreciate criticism that asks specific questions aimed at improving the survey process. For example, does the sample design allow for the generalization of the survey results to the entire population? How were misleading questions avoided? How have the interviewers been trained and monitored to minimize bias and maximize the quality of the interviews?

This blog post argued that survey criticism in Georgia is often based on inaccurate assumptions and conveys messages that are not helpful for research organizations from the point of view of improving their practice. These messages are also often dangerous as they encourage uninformed skepticism towards survey research in general. Rather than these unhelpful messages, I call on actors to engage in constructive criticism which will contribute to the improvement of the quality of surveys in Georgia, which in turn will allow people’s voices to be brought to policymakers and their decisions to be informed by objective data.

The second part of this blog post, to be published on January 23, continues the topic, focusing on examples of misinterpretation and misuse of survey data in Georgia.

Tuesday, January 10, 2017

Sex selective abortion is likely less common in Georgia than previously thought

[This blog post was co-published with EurasianetThe views presented in this article do not necessarily reflect the views of CRRC-Georgia.]

Sex-selective abortion in Georgia is a topic that has caught international attention. From an Economist article published in September 2013 to a 2015 UN report, Georgia tends to be portrayed as having one of the worst sex-selective abortion problems in the world. Closer inspection of the data, however, suggests the issue may be blown out of proportion.

The first study to draw attention to the sex-selective abortion issue in Georgia was published in 2013 in the journal International Perspectives on Sexual and Reproductive Health, and relied on statistics compiled by the World Health Organization. The authors found a sex-at-birth ratio of 121 boys for every 100 girls born in Georgia from 2005-2009. That number suggested there was a problem: one of the most common estimates of the natural sex-at-birth ratio is 105 boys for every 100 girls, or 95.2 girls for every 100 boys. Any difference between the natural and observed ratios in favor of boys is generally thought to be an proxy for sex selective abortion.

The study suggested that Georgia had one of the largest sex selective abortion problems in the world.

However, a missing data issue, a rounding error, and an anomalous sex at birth ratio in 2008, in the original study drove up the reported sex at birth ratio in Georgia. In the article, the sex at birth ratio between 2005 and 2009 is actually the average of the ratios in 2005 and 2008.  Martin McKee, one of the co-authors of the study stated, "The figure of 121 boys to 100 girls in 2005-2009 was calculated on the basis of the data submitted to the WHO at the time, from which several years were missing."

The missing data had a very large effect on the results of the study. In 2008, the ratio of boys to girls born in Georgia was exceptionally high at 128 boys born for every 100 girls. In 2005, 113 boys were born for every 100 girls, another high year for Georgia. Using these two years leads to an average of 120 boys born for every 100 girls between 2005 and 2009.

Notably, when asked about the discrepancy between the article reported 121 boys and the 120 boys to 100 girls ratio in the data, McKee acknowledged, “A very small rounding error crept in.”

With the full data between 2005 and 2009, however, the average sex at birth ratio drops to 113 boys for every 100 girls, rather than 120 – about half the reported deviation from the natural rate.


On top of the missing data, the fact that 2008’s sex at birth ratio is an outlier further exaggerates the reported magnitude of sex selective abortion in Georgia. If between 2005 and 2009, the average ratio was 113 boys for every 100 girls, the average ratio for the same period excluding 2008 is 110 boys for every 100 girls. That is to say, by excluding 2008, there were 5 excess boys born for every 100 girls rather than 8.

To flip the statistic around by looking at the ratio of girls born for every 100 boys, the average between 2005 and 2009 was 88 including 2008 and 91 when excluding it.  Translating this into the number of missing girls by subtracting the number of girls expected from the number born according to official data, suggests 6.74 missing girls for every 100 boys born when including the 2008 data. Without 2008, this drops to 4.20.


The exact causes of the situation recorded in 2008 are unknown. Although a higher than natural sex at birth ratio favoring boys is often explained by sex selective abortions and infanticide, comparing an estimate of the number of missing girls to the number of abortions over time suggests that some other factor may be at work.

Dividing the number of missing girls by the number of abortions in a year provides an estimate of the share of abortions that would need to be sex selective for it to explain the sex at birth imbalance. These calculations would suggest that sex selective abortion increased from 6% of all registered abortions in 2007 to 24% in 2008.

The calculations suggest one of three things: there was a dramatic increase in sex selective abortions in 2008, the number of unregistered abortions dramatically increased and they were also predominantly sex selective, or something else was driving the anomalous sex at birth ratio.

In the other category, many possible explanations exist. Notably, given the often poor state of data collection at the municipal level in Georgia, where births are recorded, recording error could explain the discrepancy.

The data alone cannot tell us whether 2008 saw a dramatic increase in the number of sex selective abortions or something else drove the anomalous sex at birth ratio. What is clear is that Georgia’s problem with sex-selective abortion is smaller than often portrayed.

That isn’t to say it is not a problem. In 2015, there were still about 4 missing girls for every 100 boys born.

Understanding the magnitude of the problem though is a first step towards addressing it.

Dustin Gilbreath is a Policy Analyst at CRRC-Georgia. He co-edits the organization’s blog Social Science in the Caucasus

To view the data used to calculate the figures used in this article, click here.

Monday, January 02, 2017

Three months before the 2016 Parliamentary elections: Trust in the Central Election Commission and election observers in Georgia


The June 2016 CRRC/NDI Public attitudes in Georgia survey, conducted three months before the Parliamentary elections, provides interesting information about trust in the Central Election Commission (CEC) and election observers, both local and international.

The CEC’s role in conducting elections in Georgia has been subject to contentious political debates about the organization’s impartiality. The survey data demonstrates the public’s lack of trust in the institution. In June, only 29% of the population of Georgia believed that the CEC would conduct parliamentary elections “well” or “very well”. In contrast to this general opinion, a majority (60%) of likely voters for the incumbent Georgian Dream party believed the same, while less than a third of likely voters for the two other parties that won seats in parliament (the United National Movement and Alliance of Patriots of Georgia) believed that the CEC would conduct the elections “well” or “very well”.


Note: The shares of those reporting they would vote for either Movement State for People or Alliance of Patriots of Georgia was very small (respectively, 4% and 3%), and the results for the supporters of these two parties are only indicative. 

Unsurprisingly, trust towards Georgian and international observers also differs. Overall, the population of Georgia tends to trust international observers more than Georgian observers. Forty eight percent report either “fully trusting” or “trusting” international observers, compared to 34% who report trust in Georgian observers. There are even wider gaps in trust in these two groups of observers depending on party support: while 63% of United National Movement supporters report either “fully trusting” or “trusting” international observers, only 29% “fully trust” or “trust” Georgian observers.


Note: The shares of those reporting they would vote for either Movement State for People or Alliance of Patriots of Georgia was very small (respectively, 4% and 3%), and the results for the supporters of these two parties are only indicative.

To explore the CRRC/NDI June 2016 survey findings, visit CRRC’s Online Data Analysis portal. On the topic of anomalies in the voting process, CRRC-Georgia recently conducted the Detecting Election Fraud through Data Analysis (DEFDA) project regarding the 2016 parliamentary elections. Preliminary findings can be found here. CRRC-Georgia has also previously published blog posts on the electoral process in Georgia, including on government spending before elections and public opinion shifts before and after elections.


Thursday, December 29, 2016

New Year’s twice, even if you don’t believe in Santa

[This piece originally appeared in Georgian on Liberali, here]

December. Cold. Christmas decorations in the streets. New Year. Champagne. Satsivi and Gozinaki. Presents. Santa Claus. December 25. Or January 6? Then New Year’s once again, but the old one. 2017 resolutions and the wish on New Year’s Eve that is bound to come true.

What are the population of Georgia’s New Year’s plans? CRRC-Georgia asked on December 1-13 in a phone survey of adults in Georgia. Unsurprisingly, people in Georgia follow established traditions. A large majority (73%) plan to ring in the New Year at home. Nine per cent more will meet it in a friend’s or relative’s home. Meeting the New Year outside in the street or in a restaurant and café is not yet common, and only one per cent of Georgians plan to. Another 15% had not decided in the first half of December where they would celebrate the New Year.


Since a large majority of people celebrate New Year’s at home, holiday decorations are important. Only 4% of the population does not plan to have a Christmas tree. A large majority (76%) will have an artificial tree and about one tenth (13%) a natural tree. Meanwhile, 59% of people also plan to have Chichilaki at home.

Traditionally, one of the main components of New Year’s celebrations is the New Year’s feast. Of the dishes from the New Year’s table, over one third (38%) of Georgia’s adult population singles out Satsivi, about a fourth (24%) Gozinaki and about one tenth (9%) fried suckling pig as their favorite.


For many, New Year’s is associated with presents. About two thirds of Georgia’s population (62%) plan to buy presents for family members. Some people used to believe or still believe that presents come from Santa (Tovlis Babu). It appears that about one third of Georgia’s adult population believed in Santa through the age of 10. However, almost one fourth (24%) never believed in Santa. Despite this, the magic of New Year’s Eve is not lost on the majority. Two thirds of the Georgian population (66%) have made a wish on New Year’s.

New Year’s, with its feast, Christmas tree and fireworks, is celebrated twice in Georgia. An absolute majority of people (88%) say they celebrate the Old New Year as well as well as the new one. People also seem to be interested in the Chinese calendar and closely follow which animal is the symbol of the coming year. A majority of Georgians (68%) plan to or already have bought a rooster souvenir for 2017, the year of the rooster.

Just as New Year’s has two days, so too does Christmas – the latter is celebrated on different dates by different Christian churches. About two thirds of the Georgian population (64%) believes Christmas should be celebrated on January 7. However, about one tenth of people (12%) say Christmas in Georgia should be celebrated on December 25. At the same time, not so small a share of the Georgian population (18%) reports that Christmas, like New Year’s, should be celebrated on both days.


Having holidays twice is not so uncommon in Georgia after all.

Thursday, December 22, 2016

Electoral forensics on the 2016 parliamentary elections

In order to help monitor the fidelity of the October 2016 parliamentary election results, CRRC-Georgia has carried out quantitative analysis of election-related statistics within the auspices of the Detecting Election Fraud through Data Analysis (DEFDA) project. Within the project we used methods from the field of election forensics. Election forensics is a field in political science that attempts to identify election day issues through looking at statistical patterns in election returns. This blog post reports the results of our analysis of the 2016 proportional election results. The full report of the analysis is available here.

Our analysis suggests that the results of the 2016 elections were roughly equivalent to the 2012 proportional list elections.

Before going further into the results, two caveats and a note on methods are needed. To start with the two caveats:

  • Results are probabilistic. A test may return a statistically anomalous result, and this suggests that a given result is highly unlikely to have occurred by chance alone. The way in which we calculate the test statistics is likely to provide 1 false positive for every 100 tests performed.
  • If a test does suggest a statistical anomaly, it does not necessarily mean that election-related malfeasance caused the result, but that it may have. Statistical anomalies can be caused by benign activities such as strategic voting or divergent voting patterns within a region. Electoral malfeasance does often cause a positive test result, however. Hence, substantive knowledge and judgment of each positive test are required to determine whether malfeasance actually did occur.

When it comes to methods, to be frank, they are relatively complex. Rather than dive into the details here, we recommend that interested readers see Hicken and Mebane, 2015, here. Below we present the results of the following election forensics tests:

  • Mean of second digit in turnout;
  • Skew of turnout;
  • Kurtosis of turnout;
  • Means of the final digit in turnout;
  • Frequency of zeros and fives in the final digit in turnout;
  • Unimodality test of turnout distribution.

Results

In 2016, three of the six tests were set off:


By comparison, in 2012 two of six tests were also set off. However, one test – of the second digit mean – was exceptionally close to being set off. Due to the nature of the method – bootstrapping uses resampling with replacement – this test just as well could have been set off if run again.


Given the borderline nature of the 2012 tests, providing a conclusive comparison of the two elections is somewhat difficult. However, since the test results are roughly equivalent, the tests are indicative rather than definitive, and the elections by most accounts have been considered broadly free and fair, despite having clear issues, and the 2012 elections were considered to be broadly free and fair, despite also having clear issues, we consider the 2016 election results to also be broadly free and fair.
For more on the subject, take a look at our final report for the DEFDA project, available here.

Note: The DEFDA project is funded by the Embassy of the United States of America in Georgia, however, none of the views expressed in the above blog post represent the views of the US Embassy in Georgia or any related US Government entity.

Monday, December 19, 2016

Number of logical inconsistencies in 2016 election protocols decline

Following the 2016 parliamentary elections, a number of politicians questioned the results based on logical inconsistencies on election protocols. Some of the election protocols, which summarize election results for individual voting stations, reported that more voters had come to the polls than actually cast ballots while others reported that more votes had been cast than voters came to the polling station.  While both did happen, the Central Election Commission has made dramatic improvements compared to Georgia’s 2012 parliamentary elections.

In the 2012 parliamentary elections, according to an analysis of data the Central Election Commission provided, in the proportional list elections alone there were over 30,000 more voters that came to the polls than cast ballots. In 2016, there were less than 3000 such voters – a clear improvement.

Not only were there more voters than votes in many precincts – there were more votes cast than voters that came to the polls, again according to the official record. In the 2012 parliamentary elections, there were 696 more votes than signatures for those votes. By comparison, in 2016 there were 76 – again a clear improvement.

A third logical inconsistency present in the data is declining turnout. In the 2012 elections, in 8 precincts, there were more votes at 12PM than at 5PM. That is to say that the precincts recorded declining turnout. In 2016, by contrast, only one precinct reported declining turnout, again, a clear improvement.


While the CEC has clearly improved its recording of the vote in 2016, and small mismatches are bound to happen, any voter may reasonably ask themselves – if the CEC cannot make election protocols add up, how do I know my vote counted? Thus, we strongly recommend that the CEC make efforts to minimize the number of logical inconsistencies in future elections. Some recommendations on how the CEC might do so are available in our report on the 2016 elections.

Note: The DEFDA project is funded by the Embassy of the United States of America in Georgia, however, none of the views expressed in the above blog post represent the views of the US Embassy in Georgia or any related US Government entity.


Thursday, December 08, 2016

Georgians and other ethnic groups: understanding (in)tolerance (Part 3)


As the first blog post in this series highlighted, approval by Georgians for doing business with members of other ethnic groups is, overall, declining. When it comes to Georgian women marrying men of other ethnicities, Georgians are even less approving. These latter attitudes vary by settlement type, age, and level of education. As in the previous blog posts in this series, only the answers of ethnic Georgians are presented in this blog post.

Georgians living in the capital report the highest approval of Georgian women marrying men of other ethnicities. On average, there is a 14 percentage point difference between the population of the capital and rural settlements. The biggest gap is with Americans (19%): 54% of Georgians in Tbilisi approve of Georgian women marrying Americans, while only 35% of the rural population say the same. The gap is smallest with Russians: 55% in the capital and 45% in rural settlements approve of Georgian women marrying Russians.


Note: Only shares of those answering “Approve” are presented on the charts in this blog post. 

Differences between the answers of people of different ages are also noteworthy, though the gaps are smaller. Overall, younger people show greater approval of Georgian women marrying foreigners. The biggest gap is observed in respect to marrying Americans (14%): while 50% of young people 18 to 35 approve of Georgian women marrying Americans, only 36% of older people (56+) say the same.


Differences by education level are also informative. The higher a person’s level of education, the more s/he tends to approve of Georgian women marrying men of other ethnicities. On average, there is a ten percentage point gap between people with secondary or lower education and those with tertiary education. As with settlement types and age groups, the largest gap is observed in relation to Americans. Only 37% of people with secondary or lower education approve of Georgian women marrying Americans, while 51% of people with tertiary education report the same.


Approval by Georgians of Georgian women marrying men of other ethnicities varies by settlement type, education, and, to a lesser extent, by age. Interestingly, the gaps between the groups are consistently greatest when it comes to (dis)approval of Georgian women marrying Americans.

To take a deeper look at the data used in this blog post, try out our online data analysis tool.

Monday, December 05, 2016

Georgians and other ethnic groups: understanding (in)tolerance (Part 2)

In the previous blog post, we saw that Georgians report approval of doing business with representatives of other ethnic groups less than in the past. Based on CRRC’s 2015 Caucasus Barometer data, this blog post looks at how (dis)approval differs for Georgians of different ages, and living in different settlement types. 

People living in rural settlements report disapproval of business relations with representatives of the other ethnic groups asked about more often than residents of the capital and other urban settlements. On average, 56% of rural residents report approval of doing business with the 11 other ethnicities asked about over time, while the average for Tbilisi residents is 78%. 


Note: Only the answers of those answering “Approve” are shown on the charts in this blog post. 

The highest reported levels of approval of doing business with foreigners in rural settlements was with Russians and Ukrainians, both at 69%. By comparison, in the capital, 83% and 89% approved of doing business with Russians and Ukrainians, respectively. The largest differences between the attitudes of the population of rural settlements and the capital are when it comes to Jews and Kurds/Yezidis, with approximately 30 percentage point gaps. 

Differences in the attitudes by age are also noteworthy, though the gaps are not as large as in the case of settlement types. On average, there is a 10 percentage point difference between the youngest (18-35) and the oldest group (56+). Georgians who are 56 and older show less approval of doing business with non-Georgians asked about, with the largest difference in the case of Americans: 79% of 18 to 35 year olds approve of doing business with them, while only 61% of people older than 56 say the same. The gap is almost the same in the case of Ukrainians. 


Young Georgians and those living in the capital and other urban settlements approve of doing business with people of other ethnicities more than older Georgians and those living in rural settlements. In the next blog post in this series, we present findings on who approves of Georgian women marrying men of other ethnicities. 

Explore more about attitudes towards non-Georgians in Georgia here.

Monday, November 28, 2016

Georgians and other ethnic groups: understanding (in)tolerance (Part 1)

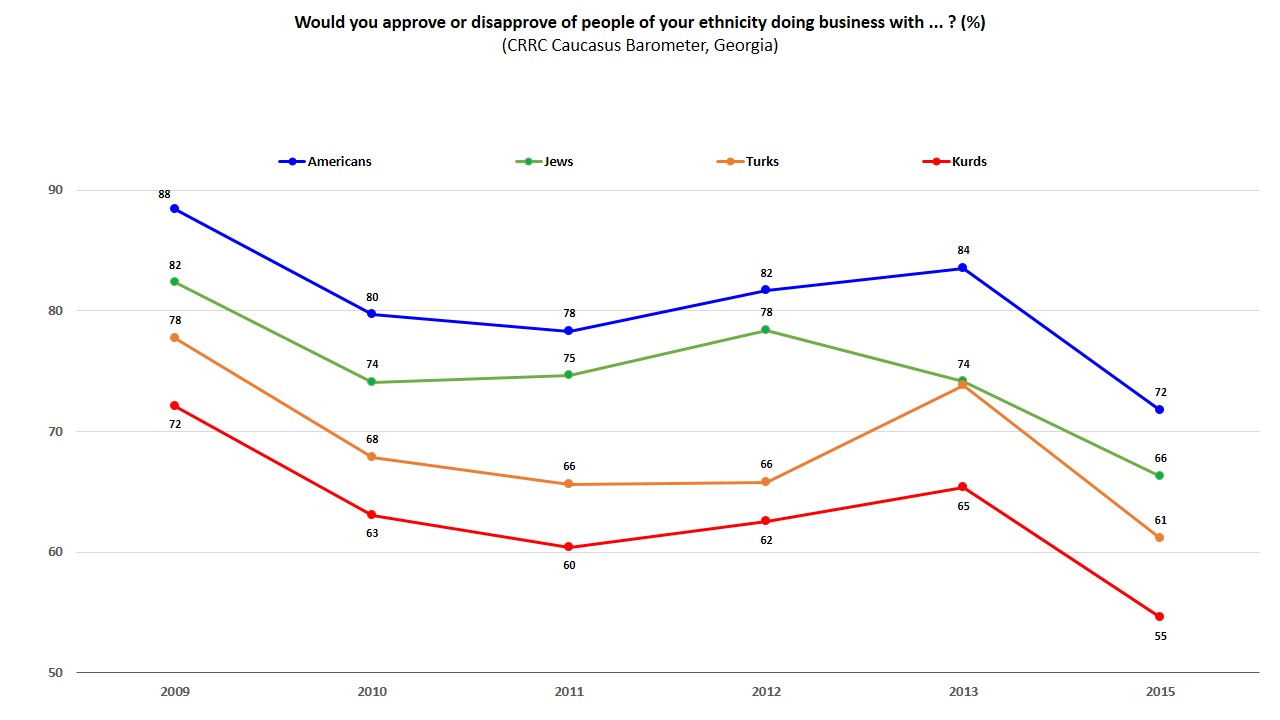
Overall, the population of Georgia reports supporting inter-ethnic business relations. Yet, CRRC’s Caucasus Barometer (CB) longitudinal data show this support is declining. In 2015, Georgians were less likely to report approval of doing business with representatives of all ethnicities asked about than they were in 2009. Interestingly, only (dis)approval of doing business with Russians did not change. These trends are presented in this blog post.

While there is a general downward trend in approval of doing business with non-Georgians between 2009 and 2015, the largest drops were observed between 2009 and 2010 and then between 2013 and 2015. In 2015, the highest level of approval was for doing business with Russians (76%, discussed below separately) and Americans (72%). The lowest reported level of approval was for doing business with Kurds (55%). The relative positions of different ethnicities have been largely stable over time.


Note: Only the shares of ethnic Georgians answering “Approve” are shown on this chart. CB was not conducted in 2014.

CB survey results show that Georgians’ support for doing business with other Caucasians is also declining. In 2015, the highest reported level of approval of doing business with other Caucasian groups was with Abkhazians (69%), while the lowest was with Armenians (60%). Both of these levels of approval are much lower than in 2009. The biggest drops between 2009 and 2015 are in approval of doing business with Azerbaijanis and Armenians, which declined by 15 and 17 percentage points, respectively.


Note: Only the shares of ethnic Georgians answering “Approve” are shown in this chart. CB was not conducted in 2014. 

At the same time, clearly stated disapproval of doing business with all the above ethnicities is increasing. In other words, an active substitution of disapproval for approval is observed.

Of the ethnicities CB asked about, only (dis)approval of doing business with Russians has been steady between 2009 and 2015, exhibiting only minor fluctuations.


The decrease in approval and increase in disapproval of Georgians doing business with other ethnicities over the past six years is considerable. Except Russians, approval of doing business with even the most liked ethnicities CB asked about is declining. In addition, data measuring (dis)approval of doing business with Greeks, Italians, and Iranians, which only exists for some years, also shows a decline in approval over time. Importantly, the rates of approval for doing business with non-Georgians are already systematically higher than rates of approval for Georgian women marrying non-Georgians.

Explore more about attitudes towards non-Georgians in Georgia here.

Georgians and other ethnic groups: understanding (in)tolerance

From the events of May 17th, 2013 when Orthodox priests and their supporters attacked demonstrators at an International Day Against Homophobia rally, to more recently when “sausage-wielding nationalists” attacked a vegan café in Tbilisi, various forms of intolerance have put Georgia into headlines internationally in recent years.

The coming posts on Social Science in the Caucasus will use CRRC’s Caucasus Barometer data (CB) to explore indicators of ethnic (in)tolerance in Georgia. Specifically, we use two questions:

  • Can you please tell me whether you approve or disapprove of people of your ethnicity doing business with an [ethnic group]?
  • Would you approve or disapprove of women of your ethnicity marrying an [ethnic group]?

The blog posts in this series only report the answers of ethnic Georgians.

The data reveals a number of interesting trends and patterns. Today’s post looks at which ethnicities Georgians approve of doing business with and how (dis)approval has changed over time. Diving further into this issue, the second post looks at how (dis)approval of doing business with other ethnicities differs by age and settlement type. The third post mirrors the second, looking at (dis)approval of Georgian women marrying non-Georgians by age, settlement type, and education level.

Part 1 of this series is available here.
Part 2 of this series is available here.
Part 3 of this series is available here.

Monday, November 21, 2016

Georgian parliamentary elections 2016 - Gender and ethnic minority representation on party lists

[This post was co-published with our partner, civil.ge]

The results of the 2016 Parliamentary elections in Georgia reveal some interesting patterns about the representation of women and ethnic minorities in Georgian politics. In the run-up to the election, lawmakers considered instituting gender quotas to come closer to the United Nations’ target of 30% of seats in parliament filled by women. Civil society organizations also lamented low ethnic minority participation in elections in Georgia. In this election cycle, women won 24 out of 150 seats (16.0%) in the upcoming parliament, and ethnic minority candidates won 11 seats (7.3%). While these figures still fall well short of international recommendations, Georgia’s next parliament will have the highest share of women and ethnic minorities that it ever has.

However, substantial roadblocks to the inclusion of women and ethnic minorities in electoral politics still exist. After the 2012 elections, the European Center for Minority Issues assessed party list composition as one of the major factors preventing women and representatives of ethnic minorities from being represented fairly in the parliament of Georgia. The infographic below shows the top six vote-getting parties in the 2016 election, ranked by shares of women and representatives of ethnic minorities on their party lists.


Not surprisingly, in the two parties that are led by women (Nino Burjanadze - Democratic Movement and the Alliance of Patriots of Georgia, chaired by Irma Inashvili), women tend to be better represented throughout the entire list, in spite of the fact that these two parties are generally seen as conservative by international observers. Importantly, the party that won a constitutional majority, the Georgian Dream (GD), had the lowest share of women on its party list (11.6%) of the top six parties. However, female candidates’ average number on the GD party list was 14 positions higher than that of male candidates (respectively, 65.7 and 79.7).

In terms of ethnic minorities, the upcoming parliament will include representatives of several ethnic groups, including Armenians, Azerbaijanis, Ossetians, Abkhaz, and Yezidis. Of the top six parties, the United National Movement (UNM) had the most ethnic minorities on its list, including Samira Ismailova, the first Azerbaijani female majoritarian candidate in Georgia’s history. Election results show that GD and UNM are still dominant in districts heavily populated by ethnic minorities, although a few other parties have made efforts to include similar or even greater shares of ethnic minority candidates on their party lists.

To explore this subject further, take a look at our Online Data Analysis platform, which has a number of surveys which asked about attitudes towards ethnic minority and gender representation in parliament. Also, take a look at CRRC blog posts on the representation of women in Georgia’s parliament compared to Armenia and Azerbaijan and public opinion about women in parliament in Georgia.

Monday, November 14, 2016

Books in Georgia


Monday, November 07, 2016

Who watches foreign television news in Georgia?

Foreign influence in Georgia's media is a popular topic of discussion for the press, academic researchers, politicians, and press freedom watchdog groups alike. However, they focus mainly on media sources’ countries of origin, content of news reporting, and the effect(s) on public opinion in Georgia. Missing from the conversation is an understanding of who actually consumes foreign media in Georgia. This is an important piece of the puzzle. A link between foreign media consumption and voting behavior in Georgia is a popular supposition, but is impossible to test without an understanding of who foreign media’s audience is. The June 2016 CRRC-NDI survey Public Attitudes in Georgia provides interesting information about some characteristics of foreign language TV viewers in Georgia. Notably, the survey results show that while more viewers of news programs on foreign language TV channels reported that they would vote if elections were held tomorrow, there are not large differences in support for the four major political parties in Georgia between those who watch news on foreign TV and those who only watch Georgian-language news programs.

TV is the main source of information about politics and current events for a majority of Georgia's population—77% pick TV as their primary source, and an additional 12% choose it as their secondary source. However, only 23% of the population of Georgia, irrespective of whether they name TV as their primary or secondary source of information, reports watching programs on politics and current events on foreign TV channels. Four out of the five most frequently mentioned foreign language TV channels watched by these 23% broadcast in the Russian language (Russia Channel One, RTR, Russia 1 and Russia 24), while the fifth (Euronews) broadcasts in both English and Russian.

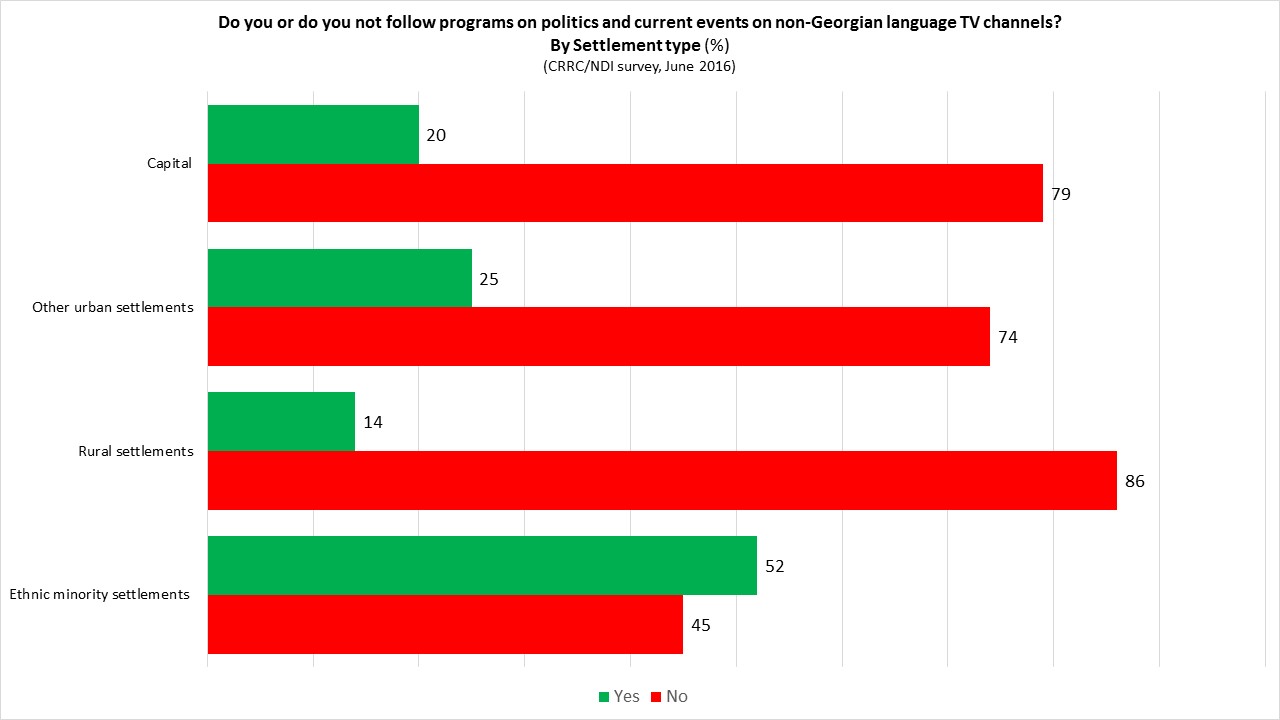
How does the 23% of Georgia’s population that watches programs on politics and current events on foreign TV channels compare demographically and politically to the rest, who report only watching news on Georgian-language channels? Some characteristics of the former group are intuitive. For example, about half of the population of ethnic minority settlements (52%) report watching the news on foreign language TV channels. In contrast, only a quarter of the population in urban settlements outside of Tbilisi report watching the news on foreign language TV channels, while those living in Georgia’s rural non-ethnic minority settlements report the lowest viewership (14%).


A larger share of viewers 36 and older tend to watch foreign (especially Russian-language) TV channels for information on politics and current events than younger viewers. This likely reflects the patterns of knowledge of the Russian language in Georgia. According to the CRRC’s 2015 Caucasus Barometer survey, 40% of Georgia’s population 35 and younger report either not having any knowledge, or a beginner’s level of knowledge of the Russian language, compared to only 19% of the population between 36 and 55, and 27% of the population who are 56 and older.

On the other hand, some characteristics of foreign news program audiences in Georgia are not as obvious. For example, a slightly higher share (25%) of those who reported that they would vote in parliamentary elections if they were held tomorrow watch foreign language news programs than likely abstainers (19%). Twenty-eight percent of decided voters also reported that they follow programs on politics and current events on foreign channels, compared to 20% of undecided voters.


Note: A 10-point scale was used to record the answers to the question, “If parliamentary elections were held tomorrow, would you vote or not?”, where option 1 corresponded to the answer “Certainly will not vote”, and option 10 corresponded to the answer “Will certainly vote”. For this blog post, the original scale was recoded, so that those choosing option 10 were coded as “Likely voters” (67%), while all those choosing options were grouped into “Likely abstainers” (33%).

If viewers of foreign TV news report slightly more often that they are likely to vote, and that they have made a decision regarding who to vote for, the question emerges – are their political affiliations any different from their counterparts who only watch domestic TV news? Interestingly, the party preferences of the two audiences show no statistically significant differences between them. Even when the data are separated further to distinguish between viewers of Russian-language TV and other foreign language TV, there is no difference in reported party preferences between the groups.

Hence, watching programs on politics and current events on foreign TV channels does not appear to tilt voters towards particular parties. Deciding which political party to vote for in Georgia is a complex process. Understandably, voters take into account a large number of individual, social, and political factors when making decisions at the voting booth. While viewers of foreign TV news may be slightly more willing to vote, and surer of their voting choices, the choices they make are similar to those who watch domestic TV channels.

To explore the data in more depth, try CRRC's Online Data Analysis tool. If you are interested in the landscape of popular media in Georgia, check out CRRC's earlier blog posts on the role of the Georgian Public Broadcaster, Georgia's press freedom ranking, and Russia's influence on Georgia's media.

Thursday, October 27, 2016

Perceptions of closeness: Opinions about which regions’ traditions and modern culture are closest to Armenian’s and Georgian’s

CRRC’s 2015 Caucasus Barometer (CB) survey asked the populations of Georgia and Armenia to identify the regions in the world whose traditions and modern culture are, in their opinion, closest to Armenia’s and Georgia’s. While most people in both countries feel closest to neighboring countries, many found it difficult to answer the questions. While there are many commonalities in responses to these questions in Armenia and Georgia, there are also minor differences.

Two questions were asked in CB. One focused on traditions and the other on modern culture. In both cases, the same show card was offered to the respondents. When it comes to traditions, the populations of both countries named most often “neighboring countries in the South Caucasus”, but this answer was more common in Armenia (36%) than in Georgia (27%). Interestingly, in both countries people found it similarly difficult to answer this question. Roughly one third of Armenians (30%) and Georgians (36%) could not or refused to answer the question.

Besides similarities, there are also differences. The “European part of Russia” was the second most common answer in Georgia (15%), and the third most common in Armenia (8%). In Armenia, “Neighboring countries in Asia” was the second most common answer, although the difference in frequencies of naming these regions in Armenia is within the margin of error. It is clear though that the population of Georgia generally does not consider the traditions of “Neighboring countries in Asia” to be close to Georgian traditions.  


The responses did not change much when people were asked which region’s modern culture they considered closest to their own. Slightly more Armenians (30%) named neighboring countries in the South Caucasus than did Georgians (23%), and the “European part of Russia” was, again, the second most common response in Georgia (13%) and third in Armenia (8%), with even higher shares of those answering “Don’t know”. Importantly, comparison of the answers to these two questions suggests that the populations of these countries do not see important differences between the traditions, on the one hand, and modern cultures, on the other hand, of the regions worldwide. 


Interestingly, in both countries, responses are quite similar in different settlement types (Georgia, Armenia), age groups (Georgia, Armenia), and by gender (Georgia, Armenia).

Despite minor differences, the populations of Armenia and Georgia have similar views about their cultures’ propinquity to other cultures in the world. Yet, in both countries a large share of the population find it difficult to answer the respective questions.

The datasets used in this blog post and related documentation are available at CRRC’s online data analysis platform. 

Monday, October 24, 2016

Trends in the data: Changes in Employment Sector and Type of Employment in Georgia

According to CRRC’s Caucasus Barometer (CB) surveys from 2008 to 2015, the self-reported employment rate is rather stable in Georgia – approximately 35%. This blog post looks at the trends in CB data on primary employment sector and type of primary workplace. Throughout the post, only the answers of those who reported being employed – slightly above a third of the population – are analyzed.

In 2015, as in previous waves of CB, the largest share of those who considered themselves employed – 14% – reported being employed in the agriculture, hunting, or forestry sector. Importantly, however, this share has declined considerably since 2008, when 29% of the employed reported being employed in this sector. Over the same period, the shares of those employed in other major sectors (trade, education, construction) have remained stable.


Note: In addition to actual responses of “Other”, several other options of low frequency are also included in this category on the chart above. That is, category “Other” in this chart includes responses “Healthcare and Social work”, “Financial Intermediation and Banking”, “Hotels, Restaurants, Cafes”, “Manufacturing”, “Transport and Storage”, “Electricity, Gas, and Water Supply” and “Mining and Quarrying”. 

A similar downward trend is observed between 2008 and 2015 in the share of employees who reported “owning a business without employees.” While in 2008, this share was about a third of those who were employed, roughly equal to those employed by state organizations, it decreased to 21% in 2015.

Although these two findings are not necessarily related, they show interesting trends in the employment situation in Georgia. Fewer people report working in the agriculture, hunting, and forestry sector, and fewer people report being sole proprietors than in the past. Both these trends suggest that the composition of the Georgian labor market may be shifting, and both call for further and thorough analysis.

CRRC’s Caucasus Barometer survey data and respective documentation are available at our online data analysis tool.