Showing posts with label Elections. Show all posts

Wednesday, January 10, 2024

Can political parties in Georgia survive abandonment by their leaders?

Note: This article first appeared on the Caucasus Data Blog, a joint effort of CRRC-Georgia and OC Media. It was written by Givi Silagadze, a Researcher at CRRC-Georgia. The study was financially supported by the National Endowment for Democracy (NED). The views presented in the article are the author’s alone and do not necessarily represent the views of NED, CRRC-Georgia, Caucasian House, or any related entity.

A year before Georgia’s general elections, a CRRC survey found that less than half of surveyed Georgian partisans would remain loyal to their favoured party if its leader were to establish a new party, with supporters of the ruling party more likely to stick with their party than supporters of the opposition. 

In recent years, political experts and analysts have argued that parties in Georgia function more on the basis of their political leaders’ popularity, rather than as genuine political organisations. 

This would suggest that if political leaders left their party and established a new one, a substantial portion of their voters would go with them. 

To test this hypothesis, CRRC Georgia conducted a public opinion poll in October 2023, a year before Georgia’s next general elections. 

The data suggests that only four out of ten partisans would stay with their party if its leader leftHowever, supporters of the ruling Georgian Dream party are more likely to stay with their party, while opposition supporters more likely to be unsure or follow their party’s leader.

Respondents were asked to identify the political party with which they identified most closely. 

Those respondents who named a political party (35% of respondents to the survey) were then asked to imagine a scenario in which a leader of their favoured party decided to cut ties with the party and establish a new party. Respondents were then asked to report how they would vote—would they still vote for their favoured party, or for the one that had been newly established?

LeaderParty
Bidzina IvanishviliGeorgian Dream
Mikheil SaakashviliUnited National Movement
Giorgi GakhariaFor Georgia
Zurab Girchi JaparidzeGirchi More Freedom
Mamuka KhazaradzeLelo
Irma InashviliAlliance of Patriots
Shalva NatelashviliLabour Party
Zurab MakharadzeConservative Movement - Alt Info 
Giorgi VashadzeStrategy Aghmashenebeli
Giga BokeriaEuropean Georgia
Aleko ElisashviliCitizens
Elene KhoshtariaDroa
Iago KhvichiaGirchi
Anna DolidzeFor the People
Nino BurjanadzeDemocratic Movement
Zviad DzidziguriConservative Party
Fridon InjiaEuropean Socialists
Levan VasadzeERI

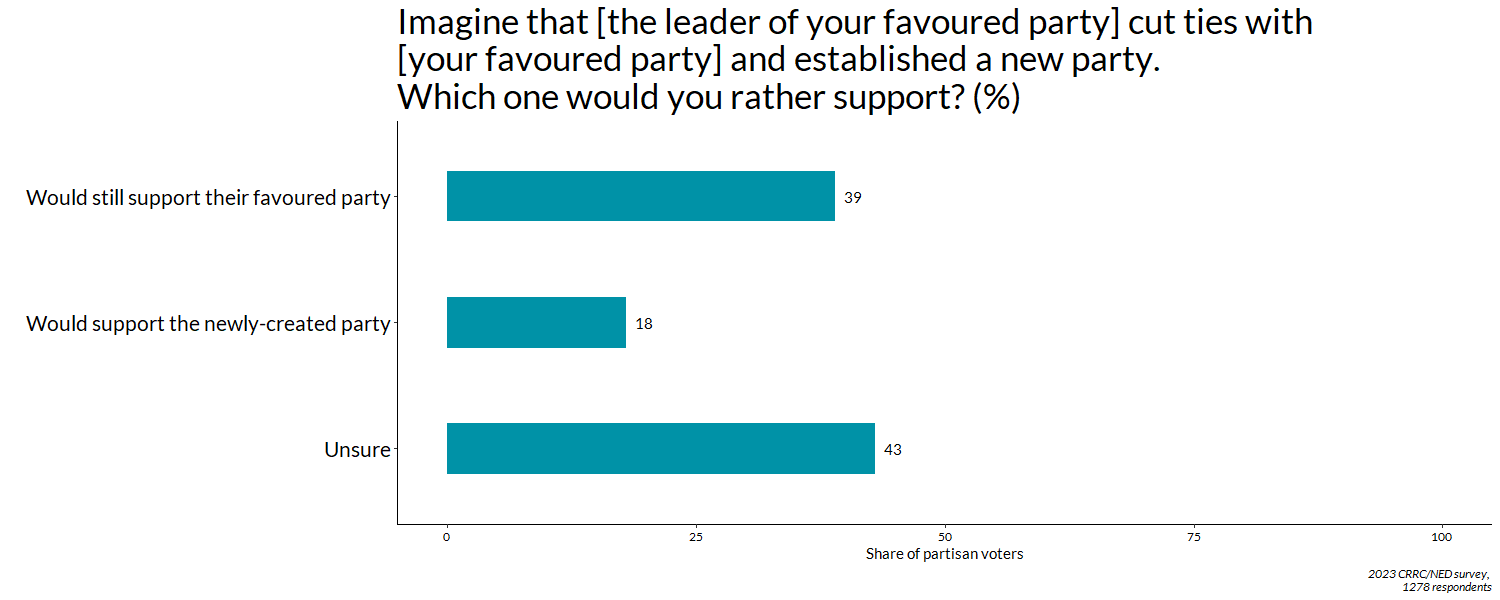
Four out of ten partisans (39%) said they would still vote for their favoured party. Approximately every fifth partisan voter (18%) said they would change their partisan preference and would vote for the new party. A plurality of partisans (43%) said they did not know which party they would vote for or refused to answer.    
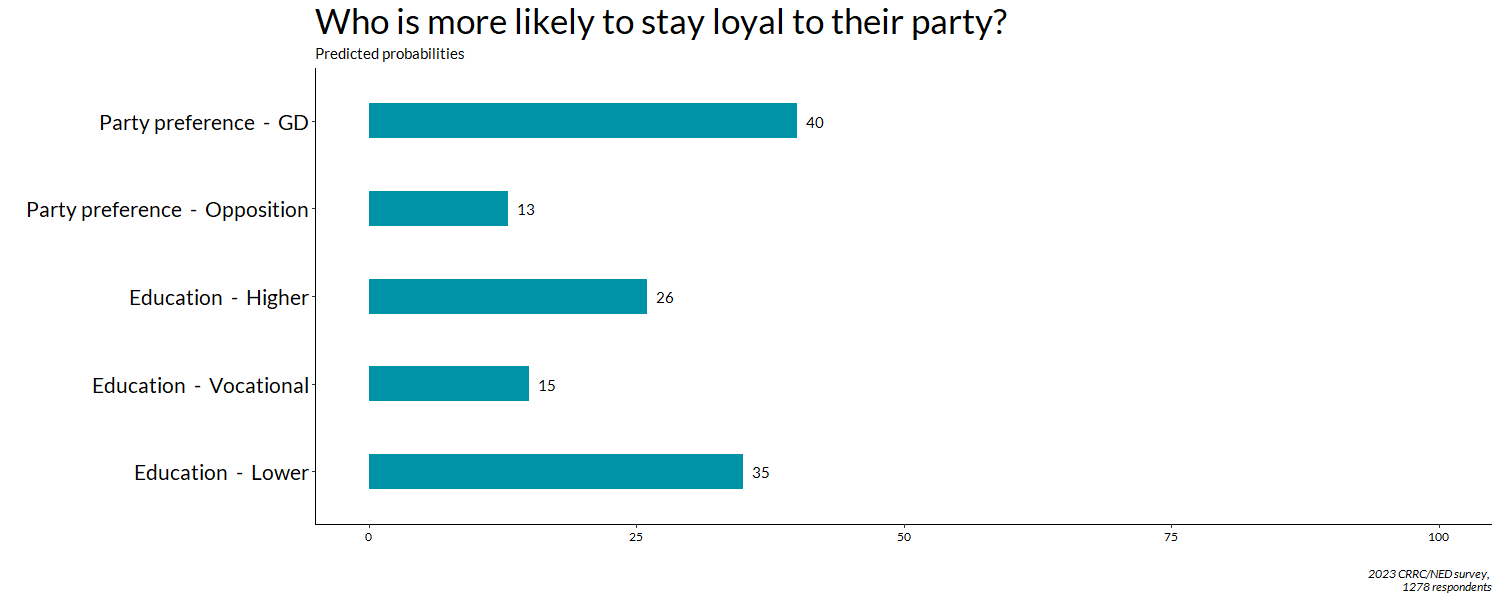
Further statistical analysis shows that some groups are more likely to stick with their favoured party even when its leader launches a new political venture. People with vocational education are less likely to stick with their favoured party than people who have a lower or higher level of formal education.

Party affiliation is also associated with whether or not voters are willing to stick with their current preferred party. Supporters of the ruling party are 27 percentage points more likely to say they would still vote for Georgian Dream if the party’s founder, Bidzina Ivanishvili, established a new party than opposition supporters when asked the same question regarding their parties’ leaders.
Regarding whether voters are willing to follow their party’s leaders, similar trends emerge. 

Opposition supporters were 16 percentage points more likely to report they would vote for a party newly founded by their party’s leaders than Georgian Dream supporters.

People with lower levels of formal education were more likely to follow their party’s leader than people with higher levels of formal education. 

Men were also more likely to follow a leader to a new party than women.
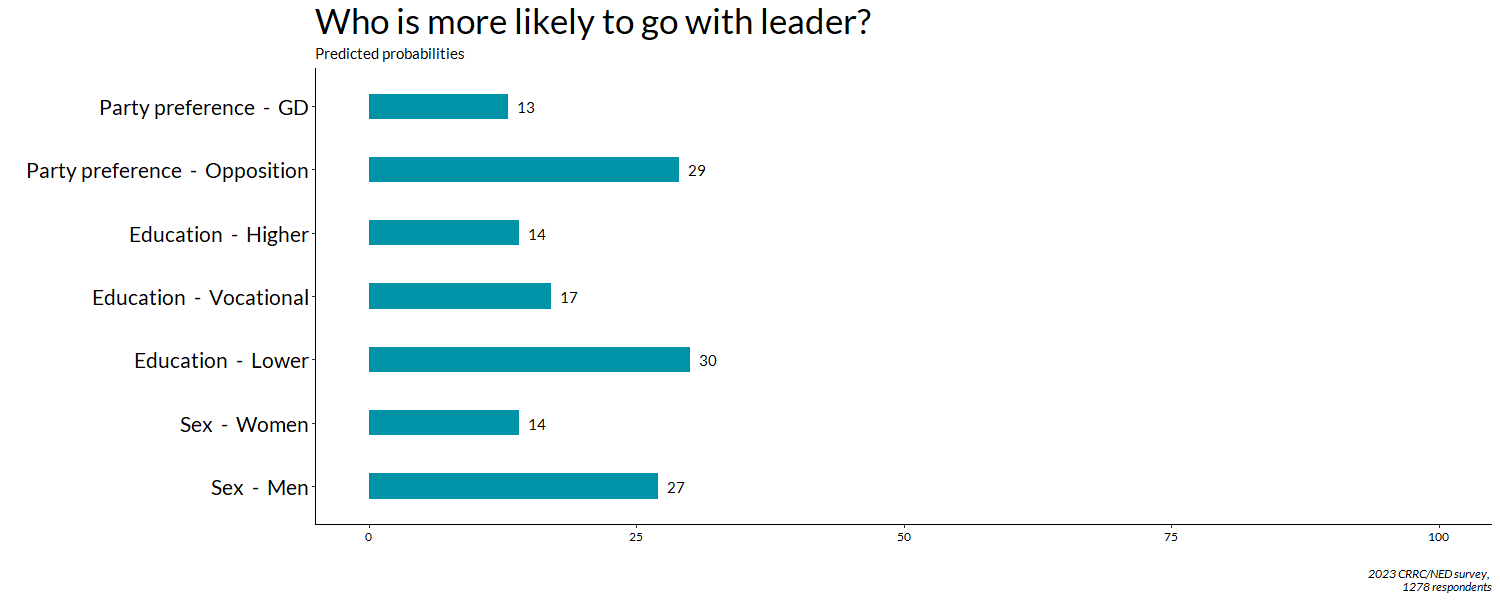
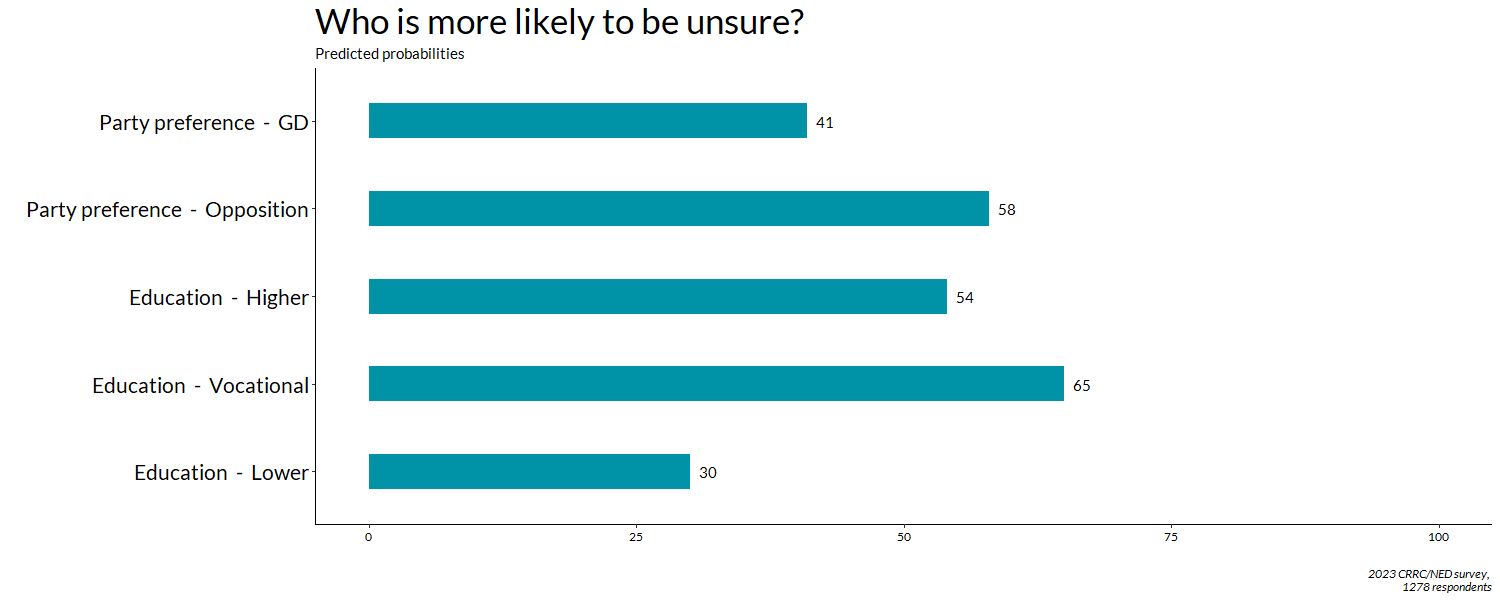
However, opposition supporters were also 17 percentage points more likely to be unsure of how they would vote if the leader of their favoured party established a new party compared with ruling party supporters.

People with higher education and vocational education are more likely to be unsure than people with lower levels of formal education. 
The above data supports the idea that Georgian political parties are at least partially driven by their leaders, with only four out of ten partisans reporting they would stick with their favoured party if its leader launched a new political venture. Moreover, one in eight ruling party supporters and one in three opposition supporters reported they would follow their leader to a new party. 

However, multiple other possible explanations for the data likely explain the differences between ruling party and opposition supporters. 

First, the line between the ruling party and the state is often blurred, meaning that Georgian Dream’s supporters might continue to support the party on the basis of it remaining in power. Second, at the time of the survey, Bidzina Ivanishvili had formally distanced himself from politics. As a result, some Georgian Dream supporters might have supported other leaders within the party and the party’s policies, rather than its founder. Finally, many of the opposition parties which the public reported supporting were founded by former members of the UNM who left or are otherwise dominated by a single personality. In turn, many of their voters are likely already voting for the party based on its leader.

Despite the above, ties appear to be stronger to the party itself for Georgian Dream supporters than for opposition supporters.  

Note: The above data analysis is based on logistic regression models, which included the following variables: age group (18-34, 35-54, 55+), sex (male or female), education (completed secondary/lower, vocational, higher), settlement type (capital, urban, rural), employment status (not working, working in the private sector, working in the public sector), religious attendance (regularly, on special occasions, rarely or never), and party identification (Georgian Dream, Opposition). 

Tuesday, February 28, 2023

Democratic hypocrisy in Tbilisi

Note: This article first appeared on the Caucasus Data Blog, a joint effort of CRRC-Georgia and OC Media. This article was written by Dustin Gilbreath, a Non-resident Senior Fellow at CRRC-Georgia and Givi Siligadze, a Researcher at CRRC-Georgia. The views presented in the article are the authors’ alone, and do not necessarily reflect the views of CRRC-Georgia, the National Endowment of Democracy, or any related entity.

A CRRC Georgia survey found that people living in Tbilisi were more willing to accept democracy-eroding policies if they believed that their preferred party was in power. 

New data released in a CRRC-Georgia policy brief today suggests that a substantial portion of voters in Georgia’s capital tend to be hypocritical in their attitudes towards democracy-eroding policies, being more likely to support them if the party they prefer controls government. However, most do not support anti-democratic policies at all.

Following the first round of municipal elections in October 2021, CRRC-Georgia conducted a representative survey of Tbilisi, in which 1254 randomly sampled individuals took part. Half of the respondents were asked to imagine that their preferred party had won the next parliamentary elections while the other half were asked to imagine their preferred party had lost. 

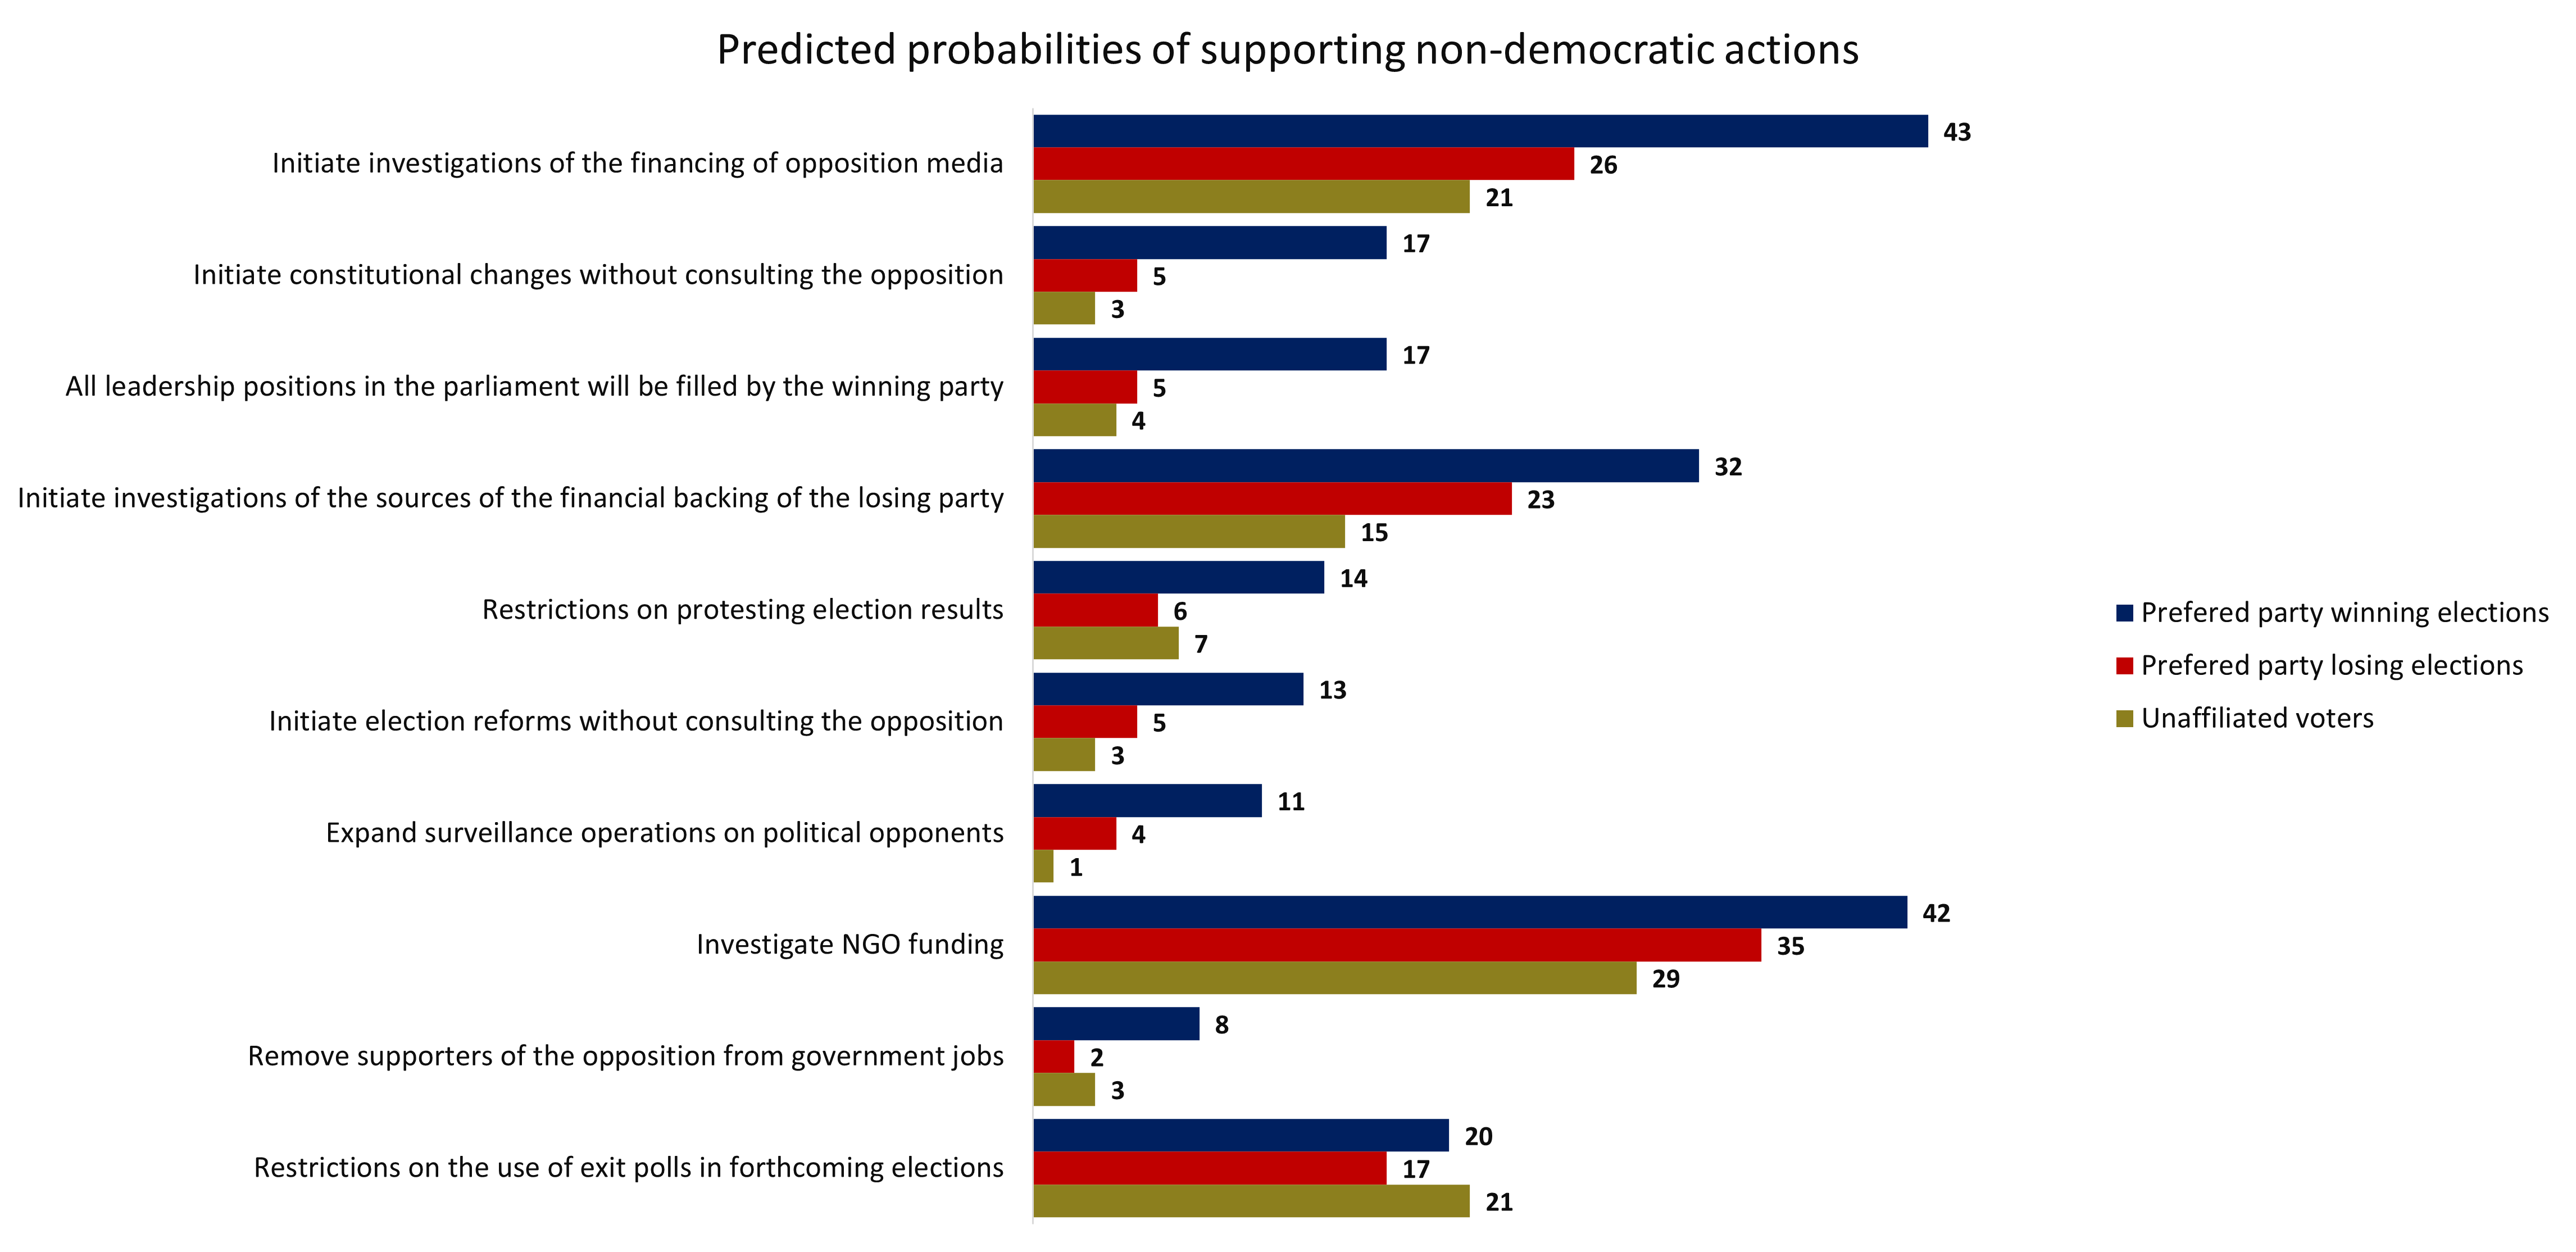
Afterwards, respondents were asked whether they would support ten different policies, as shown in the chart below. 

Support for each policy varied from 30% (investigation of NGO funding) to 4% (removing supporters of the losing party from government jobs). Support for most policies was low overall, with investigation of NGO funding (30%), initiating investigations of opposition media (25%), investigating the financial backing of the losing party (20%), and restricting the use of election polls (17%) the most supported. 

Other policies such as putting restrictions on protesting election results, giving all leadership positions in parliament to the winning party, initiating constitutional changes without consulting the losing party, initiating electoral reforms without consulting the new opposition, and expanding surveillance operations against political opponents were supported by less than 10% of the Tbilisi public.

However, views on the above propositions varied significantly based on whether or not respondents imagined that their preferred party had won the election. 

The share supporting initiating investigations of the financing of opposition media increased by 12 percentage points if they imagined that their preferred party had won compared to when their preferred party had lost the election.

Support for excluding opposition supporters from leadership positions in parliament and initiating electoral reform without consulting the opposition both increased by 10 points in response to imagining one’s preferred party had won.

The share supporting initiating constitutional changes without consulting the opposition increased by nine points, and the share supporting investigations of the sources of the losing party’s financial backing increased by eight points in response to imagining that a preferred party had won.

Support for restricting protests of election results doubled in response to imagining a preferred party had won, as did support for expanding surveillance of political opponents.

Overall, the data showed that knowing that their preferred political party had won elections increased a person’s tolerance for democracy-eroding policies for one question on average, meaning that the support of voters living in Georgia’s capital for democracy-eroding policies is heavily conditional on the party in power. 

The above pattern is not unique to Georgia, and has been similarly documented in established democracies. However, it does call for reflection among partisans in Georgia. 

Indeed, an alternative framing of the analysis is that imagining your party has lost elections gives one greater support for democracy. Whether partisans in Georgia are willing to pursue that perspective is, however, another matter.

Read in Russian on Jnews.

Thursday, June 02, 2022

Georgians are split on election quality

Note: This article first appeared on the Caucasus Data Blog, a joint effort of CRRC Georgia and OC Media. It was written by Milord Shengelia, a junior fellow at CRRC-Georgia, and Makhare Atchaidze, a researcher at CRRC-Georgia. The views presented in the article are of the authors alone, and do not necessarily reflect the views of CRRC Georgia, or any related entity.

Data CRRC Georgia collected before the 2021 municipal elections for ISFED and after the elections for NDI shows that supporters of the ruling party and opposition were and are divided over the quality of elections in Georgia.

Views prior to the elections

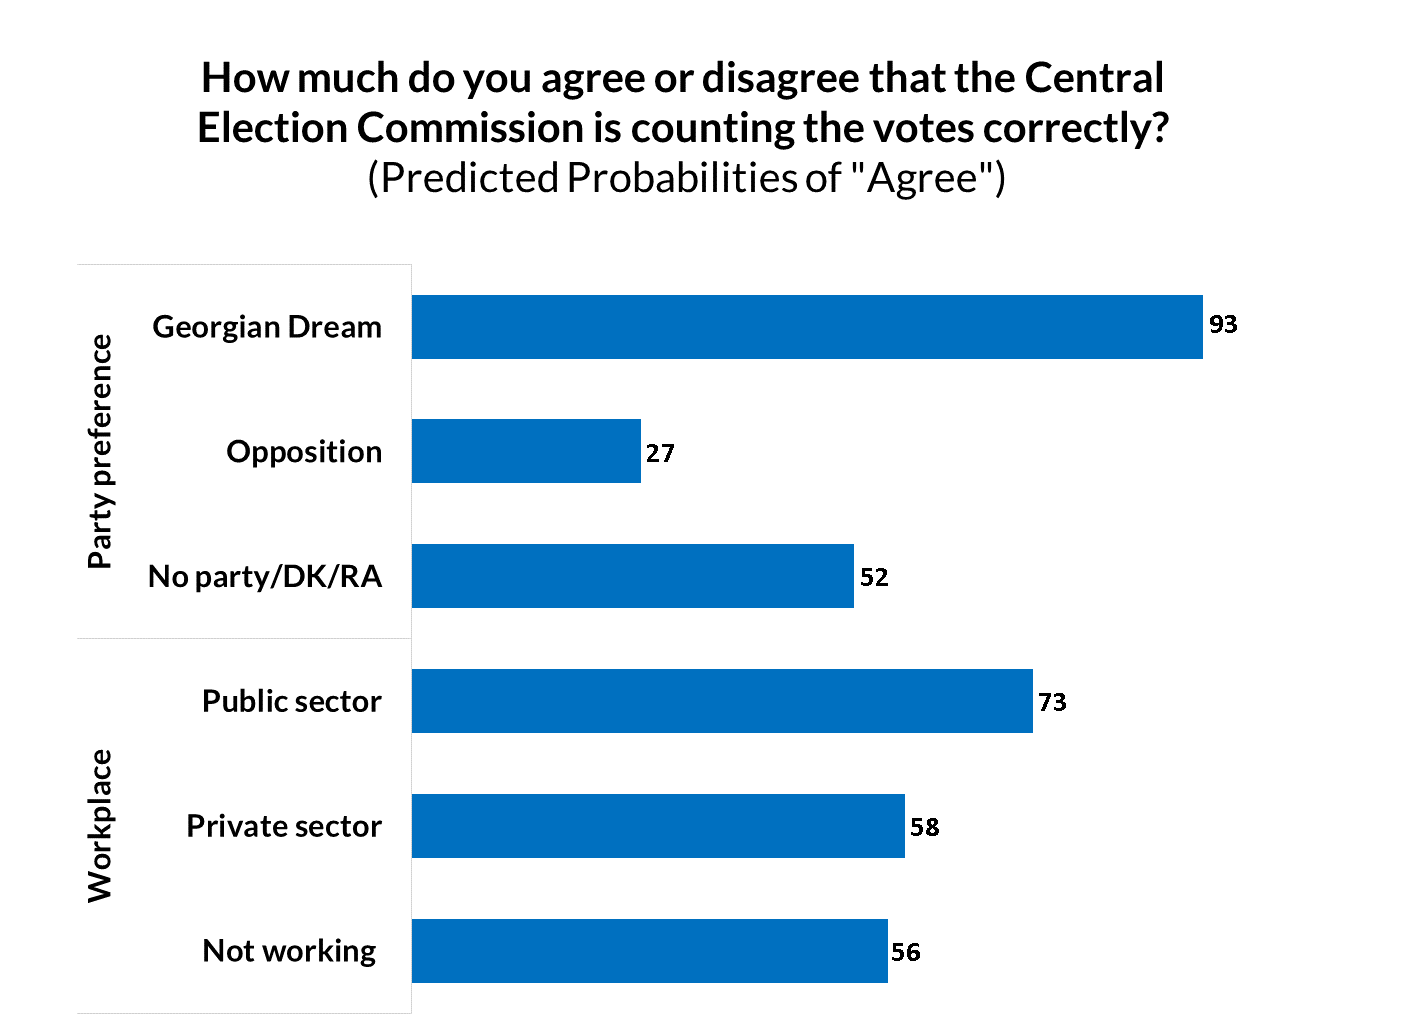
Prior to the elections, roughly half the public (46%) thought that the Central Election Commission (CEC) counted votes correctly. A regression analysis suggests that people who support the Georgian Dream were 66 percentage points more likely than opposition supporters to report thinking so, controlling for other factors. 

People who report that no party is closest to them, don’t know, or refuse to answer, had a 52% chance of saying that the CEC was counting votes correctly, which is more than the opposition, but far less than the corresponding share among Georgian Dream supporters.  

Aside from partisanship, where one works is also associated with trust in the CEC. People who work in public service were 17 points more likely to positively evaluate the vote count than people not working and people working in the private sector.

Another indicator of the quality of elections is faith in the secrecy of the ballot. 

Prior to the elections, 44% of the public said that the secrecy of the ballot could be violated in Georgia, again with a strong partisan divide in terms of views. A regression model suggests that perceptions about voting privacy are also associated with party preference. 

Opposition supporters were 36 percentage points more likely to report that it was possible for someone in Georgia to know who another person voted for than Georgian Dream supporters. 

People who did not report a party preference held views in between. 

Aside from party support, young people were less likely to think voting secrecy was protected in Georgia. 

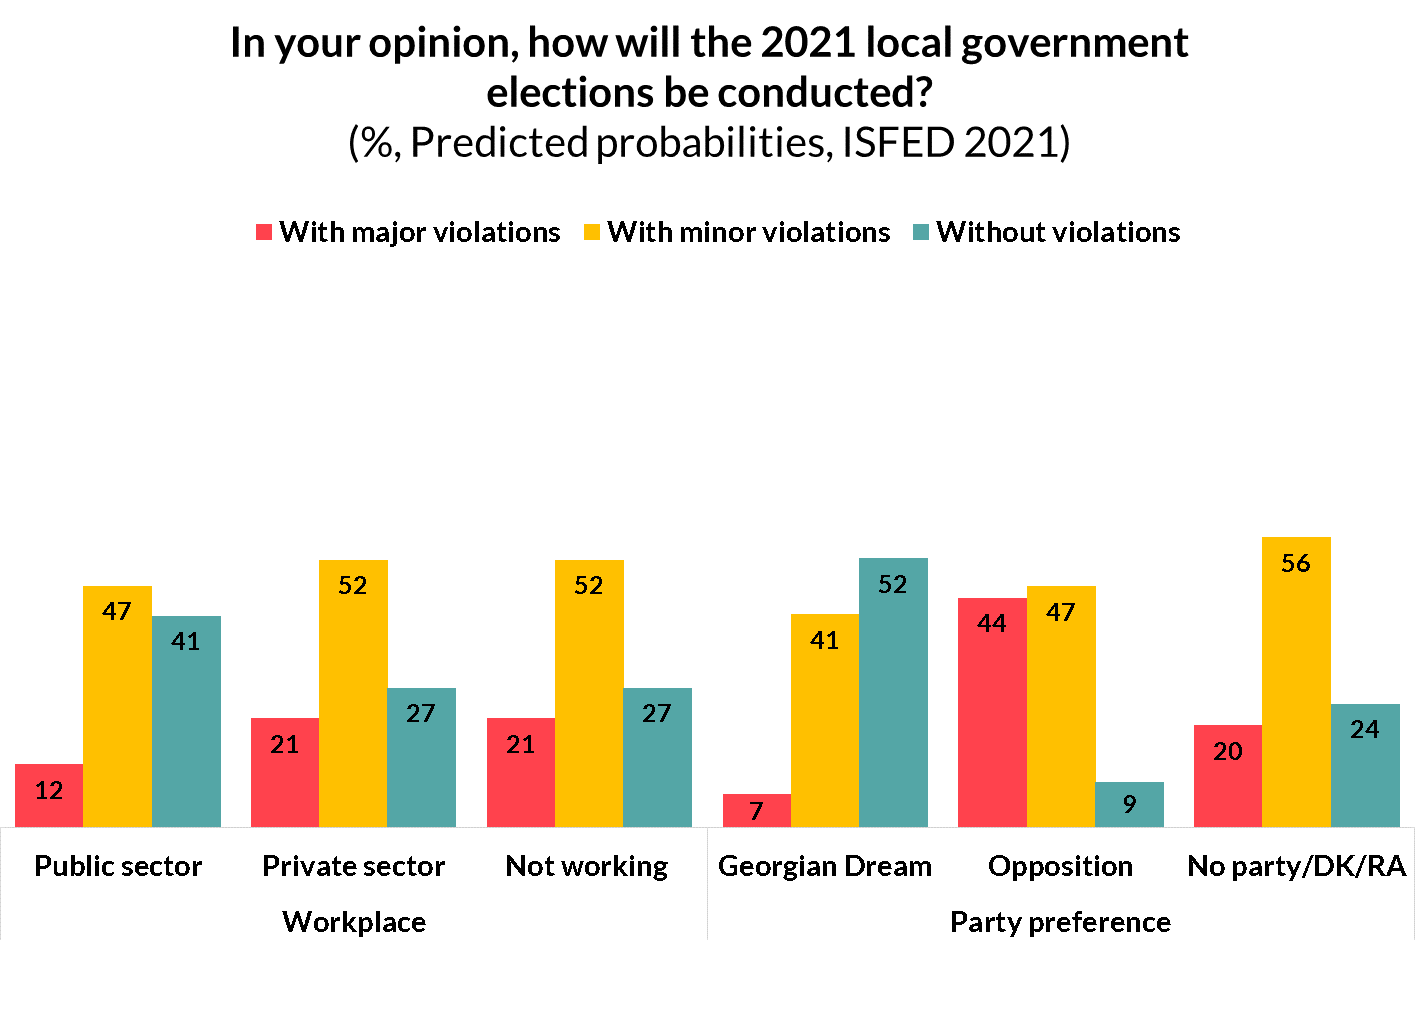
Respondents were also asked how the 2021 local government elections would be conducted. Almost 60% of respondents mentioned that the election would be conducted with either major or minor violations. While 23% said there would not be violations.  

A regression model indicates that opposition supporters were more pessimistic about the quality of elections than supporters of Georgian Dream. Controlling for other factors, opposition supporters had a 44% chance of saying that the elections would be conducted with major violations, 37 percentage points more than Georgian Dream supporters.  

Aside from partisanship, private sector workers and those who do not work were more pessimistic about election quality prior to the vote. More specifically, people who worked in the private sector and those who dido not work had a 21% chance of saying that the elections would be conducted with major violations, while 12% of public service workers reported the same.

Note: The results presented in the above charts came from regression models. The regressions included the following variables: sex (male or female), age group (18–35, 35–55, 55+), settlement type (capital, urban, rural), ethnic group (ethnic Georgian or other ethnicity), educational attainment (secondary or lower, secondary technical, higher than secondary), workplace (Working in the public sector, Working in the private sector, Not working), party preference (Georgia Dream supporter, opposition supporter, or supports no party/DK/RA), wealth (an additive index of ownership of 10 different items).

Views following the elections

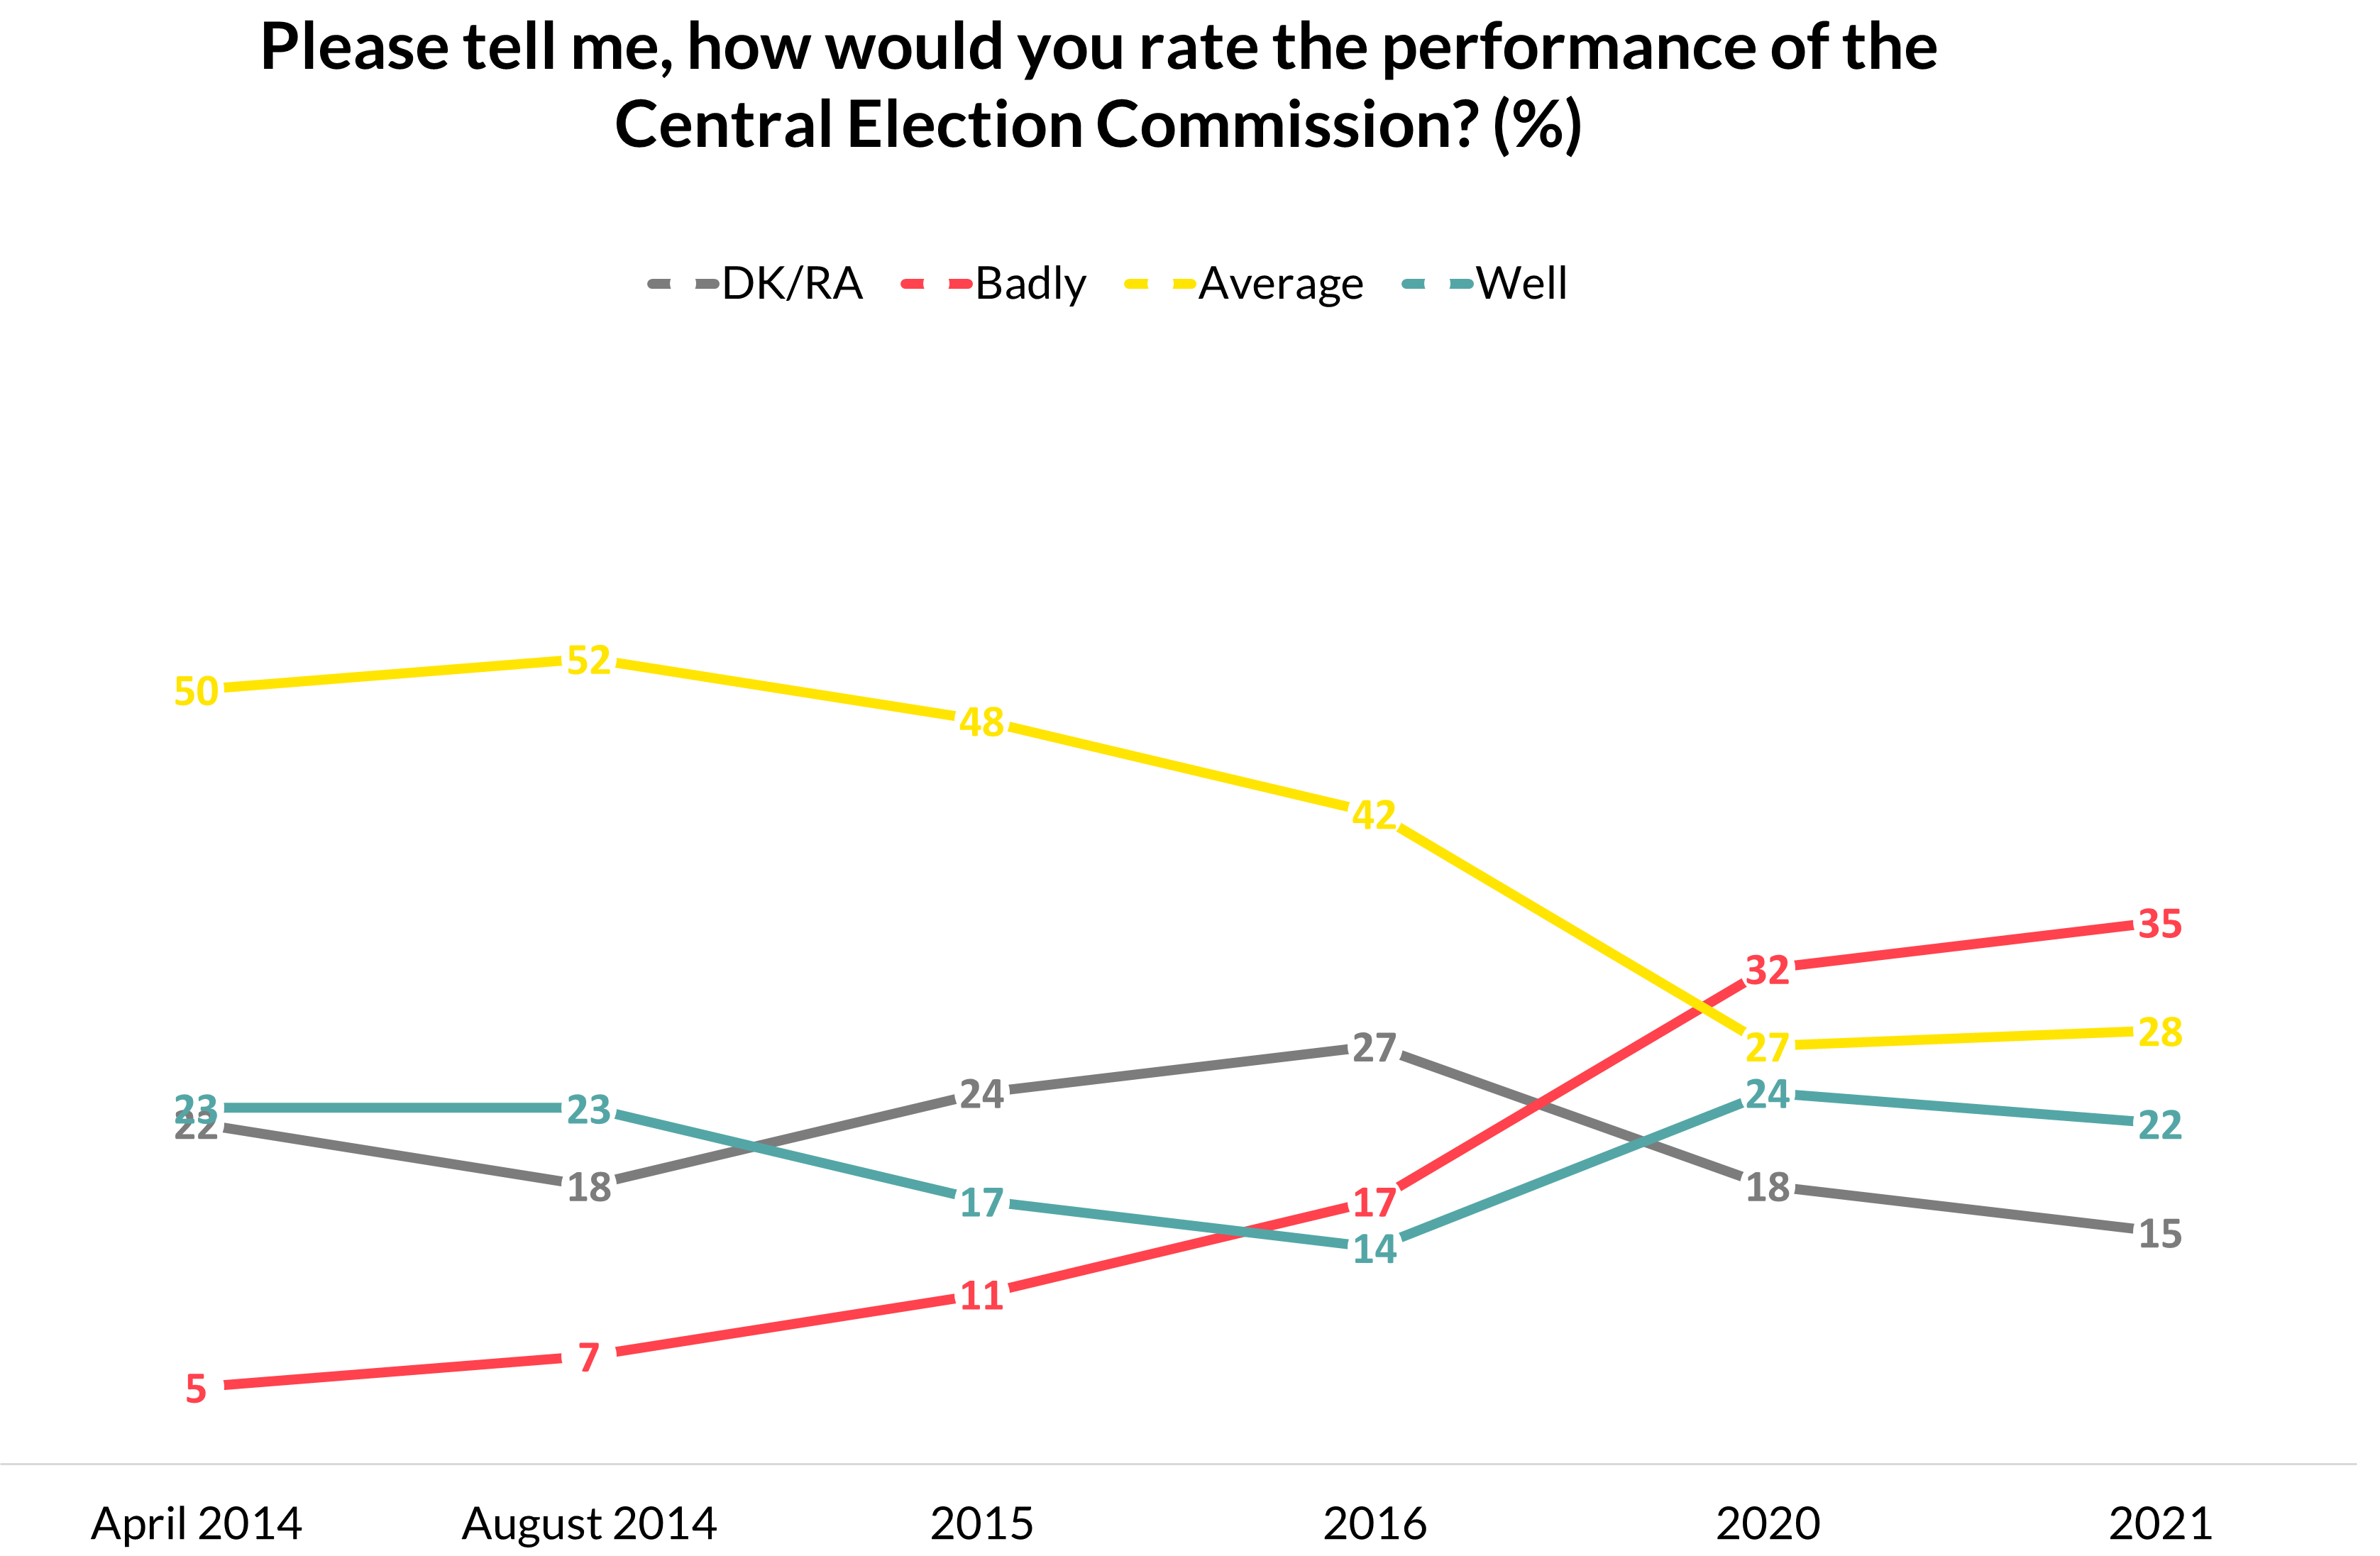
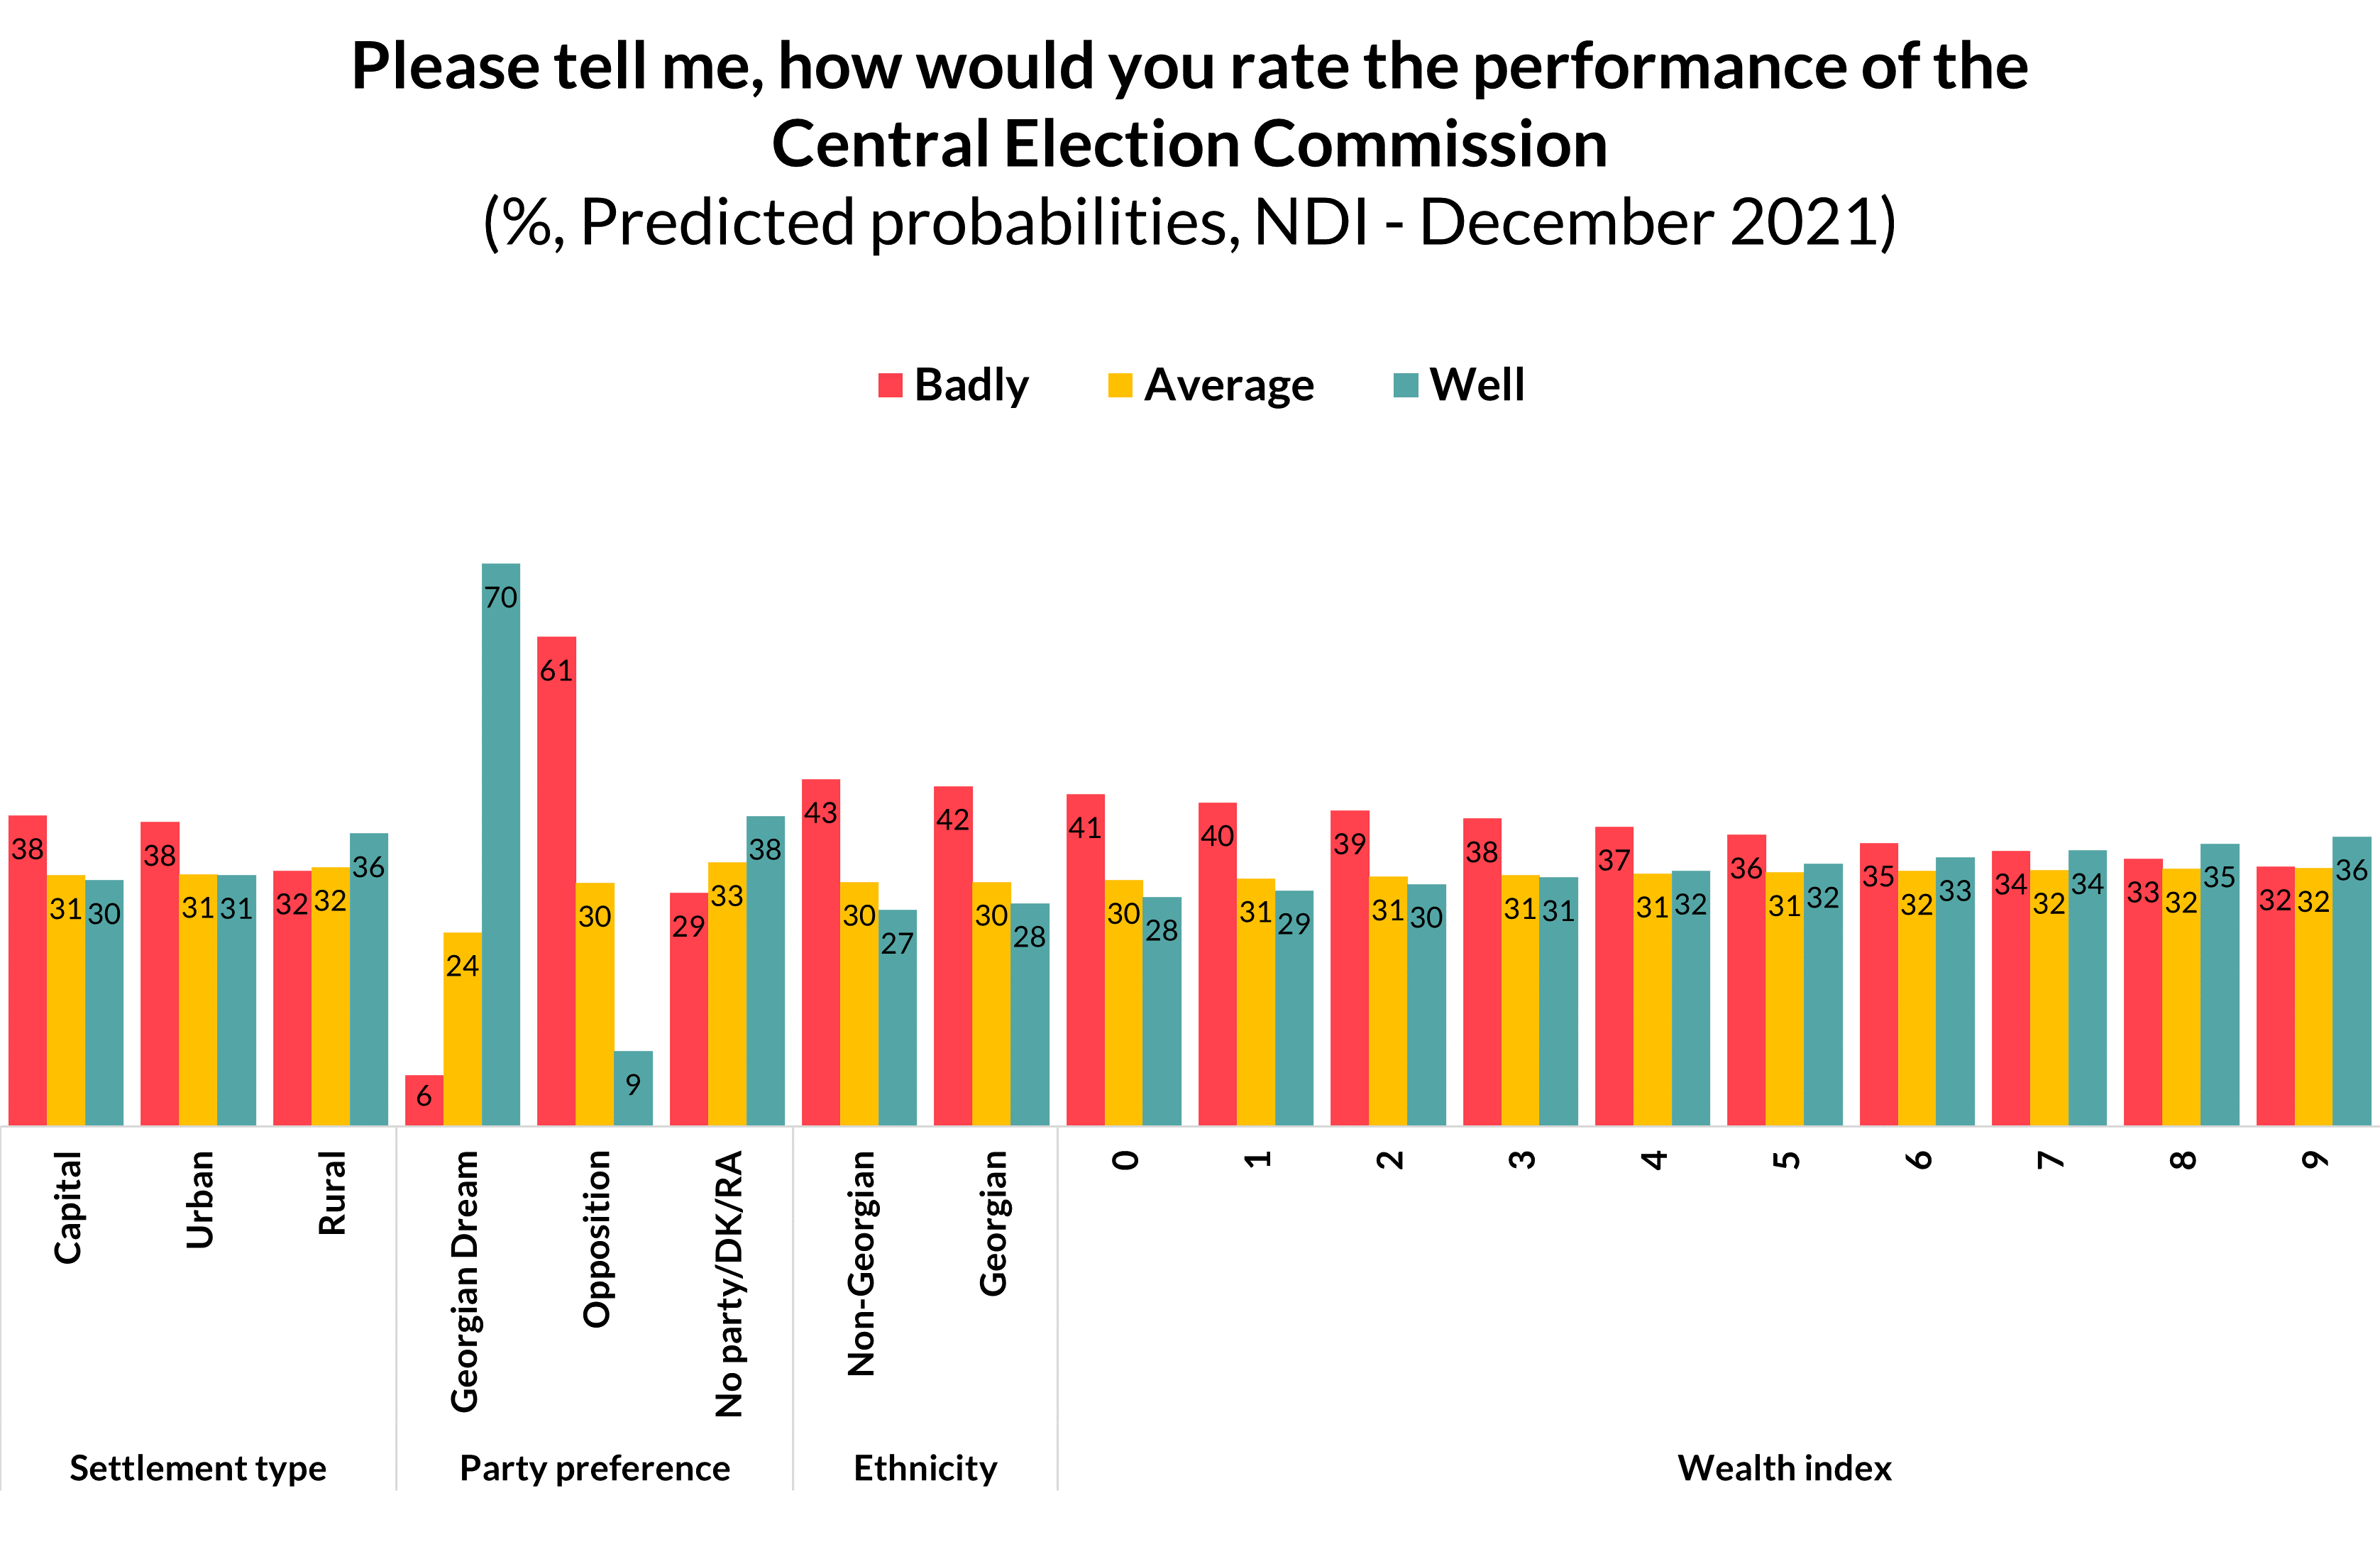
Data from NDI and CRRC Georgia’s regular polling efforts suggested that pessimism about the CEC’s performance has grown over time. In December 2021, seven times as many people (35%) assessed the CEC’s performance as poor compared with in April 2014 (5%). 

While positive assessments have fluctuated slightly over the years, neutral performance assessments have roughly halved. 

Note: In some cases in the above, graphs may not sum to 100%. This is generally due to rounding error.

A regression analysis suggests that a number of factors were associated with CEC performance assessments following the elections, including settlement type, ethnicity, partisanship, and wealth.

A regression analysis shows that the largest difference in people’s views stems from their political preferences. Georgian Dream supporters were almost 8 times more likely than opposition supporters to rate the CEC’s performance positively and around 3.7 times more likely to do so compared to those who do not report a party preference. 

Correspondingly, those who are not Georgian Dream supporters were significantly more likely to assess the CEC’s performance as poor. 

Aside from partisanship, a number of factors predicted people’s views. People in Tbilisi and other cities were slightly more likely to assess the CEC’s performance poorbadly than people in rural areas. 

Ethnic Georgians were more likely to have negative attitudes towards the CEC’s performance than ethnic minorities. The wealthier a household is, the less likely it was to evaluate the CEC's work badly. 

The above analysis is based on an ordinal regression model. The model includes age groups (18-34, 35-54, 55+), sex (male, female), settlement type (capital, urban, rural), education (secondary or lower, technical, tertiary), ethnicity (Georgian, ethnic minority), wealth (ownership of 10 different items, a proxy variable), and party preference (Georgian Dream supporter, opposition supporter, or supports no party/DK/RA).

The above analysis shows that regardless of the objective quality of elections in Georgia, there is a clear problem with regards to elections being viewed as legitimate across the political spectrum.

The data used in this article is available here. Replication code for the above analysis is available here.

Tuesday, February 22, 2022

How many votes were bought in Georgia’s local elections?

Note: This article first appeared on the Caucasus Data Blog, a joint effort of CRRC Georgia and OC Media. It was written by Dustin Gilbreath, Deputy Research Director at CRRC Georgia, and Givi Silagadze, a Researcher at CRRC Georgia. The views presented in this article are the views of the authors’ alone and do not represent the views of the National Endowment for Democracy, CRRC Georgia, or any related entity.

According to research carried out by CRRC Georgia, 20% of Tbilisi’s population appeared to be willing to sell their vote prior to elections. However, this research also discovered that the popularisation of certain messages may also discourage vote-buying among the population. 

Recent elections in Georgia have featured widespread allegations of electoral fraud. Indeed, the OSCE’s ODIHR, the main election watchdog internationally, said that ‘contestants were able to campaign freely in a competitive environment that was, however, marred by wide-spread and consistent allegations of intimidation, vote-buying, pressure on candidates and voters, and an unlevel playing field.” 

Knowing this type of problem could arise, given that past elections had featured similar allegations, CRRC Georgia attempted to measure and discourage vote-buying in the 2021 municipal elections. To do so, the organisation:

  • Conducted a pre-electoral experiment testing what messages might discourage vote-buying in Tbilisi prior to the elections; 
  • Delivered the most effective message identified in the pre-electoral experiment on posters to 18,000 households, prior to the elections as part of a randomized control trial and; 
  • Measured how effective the messages were at discouraging vote-buying. 

The results point in a positive direction, but are less than conclusive, requiring further research in future elections.

Measuring vote-buying 

Imagine that a stranger came to your home or called you on the phone, and asked you if you use illegal drugs. It is easy to imagine that few people would give an honest response.

To estimate the prevalence of illicit activities, researchers use a method called a list experiment. In list experiments, respondents are shown a list of different activities and asked how many they intend on doing or have done in the past. Half of the respondents are shown a list without a sensitive item and half are shown the same list plus the sensitive activity. By asking respondents how many activities they have engaged in, respondents do not have to tell the interviewer that they have engaged in an illicit activity. 

Researchers can then estimate how many people have engaged in an illicit activity by comparing the average number of activities that the people in the short list group reported versus the number of activities reported by the long list group. 

Willingness to sell a vote

In the lead up to the elections, approximately 3000 Tbilisi residents participated in a survey with the above-described type of experiment. The results suggest that approximately 20% of Tbilisi’s population was willing to sell their vote prior to the election, defined as voting, ‘for a certain candidate in exchange for a gift or money’.

While measuring vote buying can have important implications, discouraging it is arguably better. Indeed, ideally, there would be no vote-buying. In support of this goal, the pre-electoral survey also contained a randomised messaging experiment testing which of five different messages might discourage people from selling their vote most effectively.

The first message attempted to induce embarrassment about Georgia’s declining electoral integrity by comparing the country to positive examples internationally. The second message worked on the same premise, but placed Georgia alongside other countries doing poorly internationally. The third message highlighted the threat that vote-buying presents to Georgia’s western integration prospects. The fourth message reminded the public of the much-maligned ‘dark’ 1990s, which included widespread electoral fraud. The fifth message highlighted the incompatibility of vote-buying with democratic norms. 

The results suggest that the most effective message was the negative international embarrassment message. However, the other messages were also effective, with the exception of the message on democracy. The chart below shows the marginal effect of each message on people’s intentions to sell their votes right after hearing the messages.

Aside from discouraging people from selling their votes, the above messages also changed people’s responses to a set of six questions on attitudes towards vote-buying. The chart below shows the magnitude of the change on a scale varying from 0 to 18 points, with 0 meaning no acceptance of vote-buying and 18 meaning full acceptance of vote-buying. Again, the most effective message on this scale was the message that aimed to embarrass respondents about Georgia’s declining electoral quality, placing it in the ranks of countries that have recently had issues with electoral integrity.

Did the messages work in the real world?

Based on the above results, CRRC conducted a cluster randomized control trial in Tbilisi to test the efficacy of the negative international embarrassment message in the real world. To do so, the organisation designed the poster below, printed 18,000 copies, and delivered these to households that would be interviewed following elections.


After the first round of elections, over 1,200 interviews were conducted with households that did and did not get a copy of the above poster. 

Analyzing these interviews points in a positive direction for the posters, but is far from conclusive. The results point in the direction of vote-buying taking place, and also towards a decline in vote-buying as a result of the posters. However, the results are not definitive, failing to meet standards for statistical significance.

With regard to attitudes, the data indicates some minimal impacts on a few of the survey questions about attitudes towards vote-buying. However, there is no evidence that the poster uniformly shifted attitudes towards less tolerance of vote-buying on the attitude index depicted above. 

What does all of this mean?

The results of the experiment CRRC Georgia conducted are promising, but also definitively inconclusive. They point towards the existence of vote-buying, and they point towards the anti-vote-buying message being effective, but they do not demonstrate this beyond a shadow of a reasonable doubt. 

This conclusion calls for future research. Notably, the pre-electoral survey found statistically and substantively significant effects. However, this survey measured results immediately after respondents heard the message. In contrast, the posters were placed on people’s doorsteps in the weeks leading up to the elections. It is plausible that the effect of the message dissipated over time. In this regard, future research should consider attempts to deliver the message in multiple mediums, multiple times.

The data from the pre-electoral survey also clearly shows that multiple messages were effective, even though the negative international embarrassment message was most effective. In this regard, future research should test out whether delivery of multiple messages and combinations of the above, as well as different messages, is effective at sustaining anti-vote buying attitudes.

Above all, one would hope that this research would be unnecessary in the first place. That it was even conducted points towards a need for the authorities to ensure that vote-buying does not take place.


Tuesday, December 21, 2021

The Gakharia Effect

Note: This article first appeared on the Caucasus Data Blog, a joint production of CRRC Georgia and OC Media. It was written by Givi Siligadze, a researcher at CRRC Georgia, and Tsisana Khundadze, a Senior Researcher at CRRC Georgia. The views expressed in this article are the authors’ alone and do not represent the views of NDI, CRRC Georgia or any related entity.

In February, then Prime Minister Giorgi Gakharia resigned in response to a disagreement within the ruling party regarding the detention of Nika Melia, the leader of the United National Movement. But how did his resignation affect people’s political views?

Gakharia was among the most popular leaders from the ruling party and led Georgian Dream during the 2020 Parliamentary elections.  

Analysis of a February 2021 NDI survey, which was ongoing at the time of Gakharia’s resignation, suggests the immediate effect of Gakharia’s resignation was a nine percentage point decline in support for Georgian Dream.

The CRRC and NDI telephone survey was conducted between 17–24 February 2021. On 17 February, a day before Gakharia’s resignation, every third (32%) Georgian considered Georgian Dream as the political party closest to them, 12% named an opposition party, and more than half (56%) did not specify any party (responding no party, don’t know, or refuse to answer). 

After Gakharia resigned on 18 February, Georgian Dream numbers dropped to around every fifth person (22%) naming it as the party closest to them. One in seven Georgians (15%) named an opposition party, and almost two thirds (63%) did not name a party. 

A regression analysis, controlling for a wide range of factors, suggests that after taking into account differences between people interviewed before and after Gakharia’s resignation, there was a nine percentage point drop in support for Georgian Dream as a result of the resignation.  

Further analysis showed that Gakharia’s resignation did not affect support for opposition parties. Rather, support shifted to other response options generally.  Thus, the PM leaving the party contributed to Georgian Dream supporters becoming disillusioned, though the opposition did not gain much from the resignation either. 


Different groups of the public were affected differently. 

People living in Tbilisi, people with higher education levels, and employed people were significantly less likely to name the ruling Georgian Dream party as being closest to them after Gakharia’s resignation. 

In contrast, the resignation did not affect party identification for people who were not working, people with secondary or a lower levels of education, or people living outside the capital. 


While the changes in party support are logical, the circumstances of the resignation could also reasonably be expected to change people’s views of the government. This is particularly true given Gakharia’s popularity and contribution to the perception that the government was effectively handling the pandemic. 

Yet, regression analyses suggest no changes in terms of people’s attitudes towards the direction the country was headed, the performance of parliament, assessments of the government’s economic COVID mitigation measures, or vaccination intention. 


The above analysis shows that while Gakharia was critical to Georgian Dream support, his departure did not significantly affect how people thought about other issues in the country.

Note: The above data analysis is based on logistic regression models which included the following variables: age group (18–34, 35–54, 55+), gender (male or female), education (completed secondary/lower, secondary technical, or incomplete higher education/higher), employment situation (working or not), ethnicity (ethnic Georgian or ethnic minority), party identification (Georgia Dream, opposition, no party/DK/RA), settlement type (Tbilisi, other urban areas, or rural areas) and interview date (before Gakharia's resignation or after Gakharia's resignation).


Tuesday, November 30, 2021

Is it ok to cancel debts ahead of elections?

This article first appeared on the Caucasus Data Blog, a joint effort of CRRC Georgia and OC Media. It was written by Makhare Atchaidze, a Researcher at CRRC Georgia. The views presented in this article do not represent the views of CRRC Georgia, the National Endowment for Democracy, or any related entity.

In the run up to several recent elections, the government, or those close to it, have announced amnesties on people’s debts or fines. But what do people think of the practice?

In the lead up to the second round of the 2018 presidential elections, a charitable foundation set up by the founder of Georgian Dream announced a debt amnesty for people with loans of ₾2,000 or less. Around one-sixth of the population benefited from the programme. Similarly, in 2021, the government announced they would annul COVID-19 fines in the lead up to municipal elections. 

Election monitors have criticised this pattern of annulling fines and loans in the lead-up to elections. 

In September 2021, CRRC Georgia conducted a survey for ISFED on attitudes towards elections. The data indicates that a majority think this behaviour influences voters and is unacceptable during the pre-electoral period.

Overall, 59% of the public reported that debt and fine cancellation was unacceptable during the pre-electoral period, while 34% considered this acceptable. A small share did not know or refused to answer (7%).  

People’s attitudes vary according to several factors. Modelling suggests that wealthier people, people who do not support Georgian Dream, and ethnic Georgians are less likely to accept loan cancellation in the pre-electoral period than less wealthy people, Georgian Dream supporters, and ethnic minorities. 

Compared to other regions, people in Samtskhe-Javakheti and Kvemo Kartli are more likely to accept such activities. 

The data shows that 69% of the people think that cancelling bank loans or fines during the pre-electoral period influences who people vote for. Only 19% of people did not think so, and 12% were uncertain. 

When broken down by social and demographic characteristics, the data shows that ethnic minorities, Georgian Dream supporters, and people living in Adjara and Guria are less likely to say that such initiatives influence who people vote for. 

Opposition supporters, ethnic Georgians, and people from Kakheti are more likely to believe it influences voters.


Overall, most people do not think that annulling fines or loans before elections is acceptable, and they do believe that it influences voters. 

Those who support the governing party and ethnic minority are less likely to think loan cancellation influences voters, and they are more likely to accept the practice.

Note: The above analysis is based on a logistic regression model. The model includes gender (male, female), age groups (18-34, 35-54, 55+), region (Tbilisi, Adjara-Guria, Samegrelo-Zemo Svaneti, Imereti-Racha-Lechkhumi-Kvemo Svaneti, Shida Kartli- Mtskheta-Mtianeti, Samtskhe-Javakheti-Kvemo Kartli, Kakheti), employment status (employed or not), education (secondary or lower, technical, tertiary), ethnicity (Georgian, ethnic minority), wealth (ownership of 10 different items, a proxy variable), and closest party to the respondent’s views (Georgian Dream, opposition, Don’t know/Refuse to answer/No party).

The data used in this article is available here

Tuesday, November 16, 2021

Do people think voter secrecy is respected in Georgia

Note: This post first appeared on the Caucasus Data Blog, a joint production of CRRC Georgia and OC Media. It was written by Dr. Tsisana Khundadze, a Senior Researcher at CRRC Georgia. The views presented in the article are the author's alone and do not reflect the views of ISFED, CRRC Georgia, or any related entity.

International and local election observers often note violations of the secrecy of the ballot in Georgia, and the 2021 local elections were no exception.  According to a recent study, a plurality of people think such violations could take place in Georgia, and some have heard of such cases in the past year.

On the survey on election-related attitudes carried out by CRRC Georgia for ISFED,  respondents were asked about a hypothetical country where a citizen’s vote was somehow revealed to a neighbour who was on the election commission. 

Respondents were asked if they thought that something like this could happen in Georgia. A plurality of respondents thought it was possible, while around a third deemed it impossible. The rest were unsure.


A regression analysis shows that people in the 18-34 age group were around 1.2 times more likely to think that someone else might find out who they voted for than older people. 

Even though election observers recorded more violations of the secrecy of the ballot in areas predominantly populated by ethnic minorities, ethnic Georgians were 2.4 times more likely to think this kind of violation was possible in Georgia compared to ethnic minorities. 

People with higher than secondary education were 1.2 times more likely to deem it possible than people with secondary or lower education. 

The more durable goods a household owned (a proxy for wealth), the more likely a person was to think the secrecy of the ballot could be compromised in Georgia.

Opposition party supporters were 2.1 times more likely than Georgian Dream supporters and 1.4 times more likely than people who did not name any party as close to their views to think this was possible in Georgia. 

There were no differences in terms of gender, settlement type, or employment type.

Note: This and the following chart were generated from a regression model. The model includes gender (male, female), age group (18–34, 35–54, 55+), settlement type (capital, urban, rural), ethnicity (Georgian, ethnic minority), education (secondary or lower, secondary technical, tertiary), employment status (public sector, private sector employee, self-employed, not employed), party respondent names as closest to his/her views (Georgian Dream, opposition party, did not name a party (Don’t know, Refuse to answer, No party)), and an additive index of ownership of different items, a common proxy for wealth.

In focus groups and in-depth interviews, some participants felt that the secrecy of the ballot could only be violated when a voter chooses to show someone their ballot or tell them who they voted for. 

Some participants reported that party coordinators asked voters to send a picture of their ballot. Other participants indicated that voters might mark their ballot by drawing a line or putting a dot on it so that it is possible to tell who they voted for. 

However, participants underlined this would still mean that the voter revealed their preferences. 

One participant stated, ‘I have heard of many things, that they have told them to mark it in a specific way, put a cross on it or a dot. So I have heard of it, but not that they have forced someone. Such things happen. I don’t know. They talk about many things.’

The survey shows that, in the past year, 27% of the population had heard of a voter taking their ballot outside the election precinct. Most of the population (61%) had not heard about such an incident. 

A regression analysis shows that ethnic Georgians were 1.9 times more likely to report knowing of such cases than ethnic minorities. 

Similarly, opposition party supporters were 3.1 times more likely than Georgian Dream supporters and 1.6 times more likely than people who did not name a party to report that they had heard of a ballot being taken out of an election precinct. 

Wealthier people were also more likely to say they knew of such cases. There were no gender, age, settlement type, or employment related differences in the data.

Regardless of whether they had heard of someone taking their ballot outside the election precinct, a majority (88%) of the population thought that it was unacceptable or completely unacceptable when a political party coordinator asks a voter to take a picture of their ballot. There were no differences between different groups on this issue.

Thus, a plurality of Georgia’s population thinks it is possible for someone to know who you voted for. Qualitative data suggests that the public thinks this only occurs if a voter reveals their vote to someone else. 

For a majority, it is unacceptable to be asked to take a photo of one’s ballot. Young people, ethnic Georgians, people with higher than secondary education, opposition supporters and people with better economic situations were more likely to question whether the secrecy of the ballot is respected in Georgia.

The data used in this article are available here.


Tuesday, November 09, 2021

What issues do Georgians think about when voting?

This article first appeared on the Caucasus Data Blog, a joint effort of OC Media and CRRC Georgia. It was written by Makhare Atchaidze, a Researcher at CRRC Georgia.

While voters in Georgia tend to look to personalities rather than policies in determining who they will vote for, policies also matter to a large number of people. But what issues are most important to voters?

On 2 October 2021, 1.8 million voters participated in Georgia’s local elections. In Tbilisi, Kakha Kaladze won the most votes in the first round, but failed to pass the 50% + 1 threshold for winning outright in the first round. This resulted in runoff elections in a number of Georgian cities, including Tbilisi, where Kakha Kaladze was re-elected with 56% of the vote. 

In the second round of the campaign, a number of observers noted a shift in the discourse to a conversation around social policy.

Analysis of a recent CRRC Georgia survey funded by the National Endowment for Democracy suggests that in the context of municipal elections, environmental issues are the top policy priority voters think about when deciding who to vote for. 

CRRC Georgia conducted a survey of approximately 3,000 residents of Tbilisi a month before the first round of the elections. Respondents were asked what policy issues matter to them most when deciding who to vote for.

The data shows that the most important issues people think about when it comes to deciding who to vote for are related to the environment and transport infrastructure.

These issues were present in the platforms of the mayoral candidates in the runoff elections. 

Nika Melia focused on maintaining recreational areas, improving cleaning services and wage policies, and waste management. 

Kakha Kaladze’s platform suggested that the City Hall would spend ₾300 million ($95 million) on environmental issues over the next four years. This included spending on renovating old parks and building new ones, forest restoration around Tbilisi, implementing waste separation, and continuing the Healthy City Programme, which includes these and other initiatives. 

Both candidates had even more in their platforms on transport issues.

Further analysis which looks at who mentioned parks and green spaces, environmental pollution, and/or clean streets suggests that attitudes vary by a number of characteristics. 

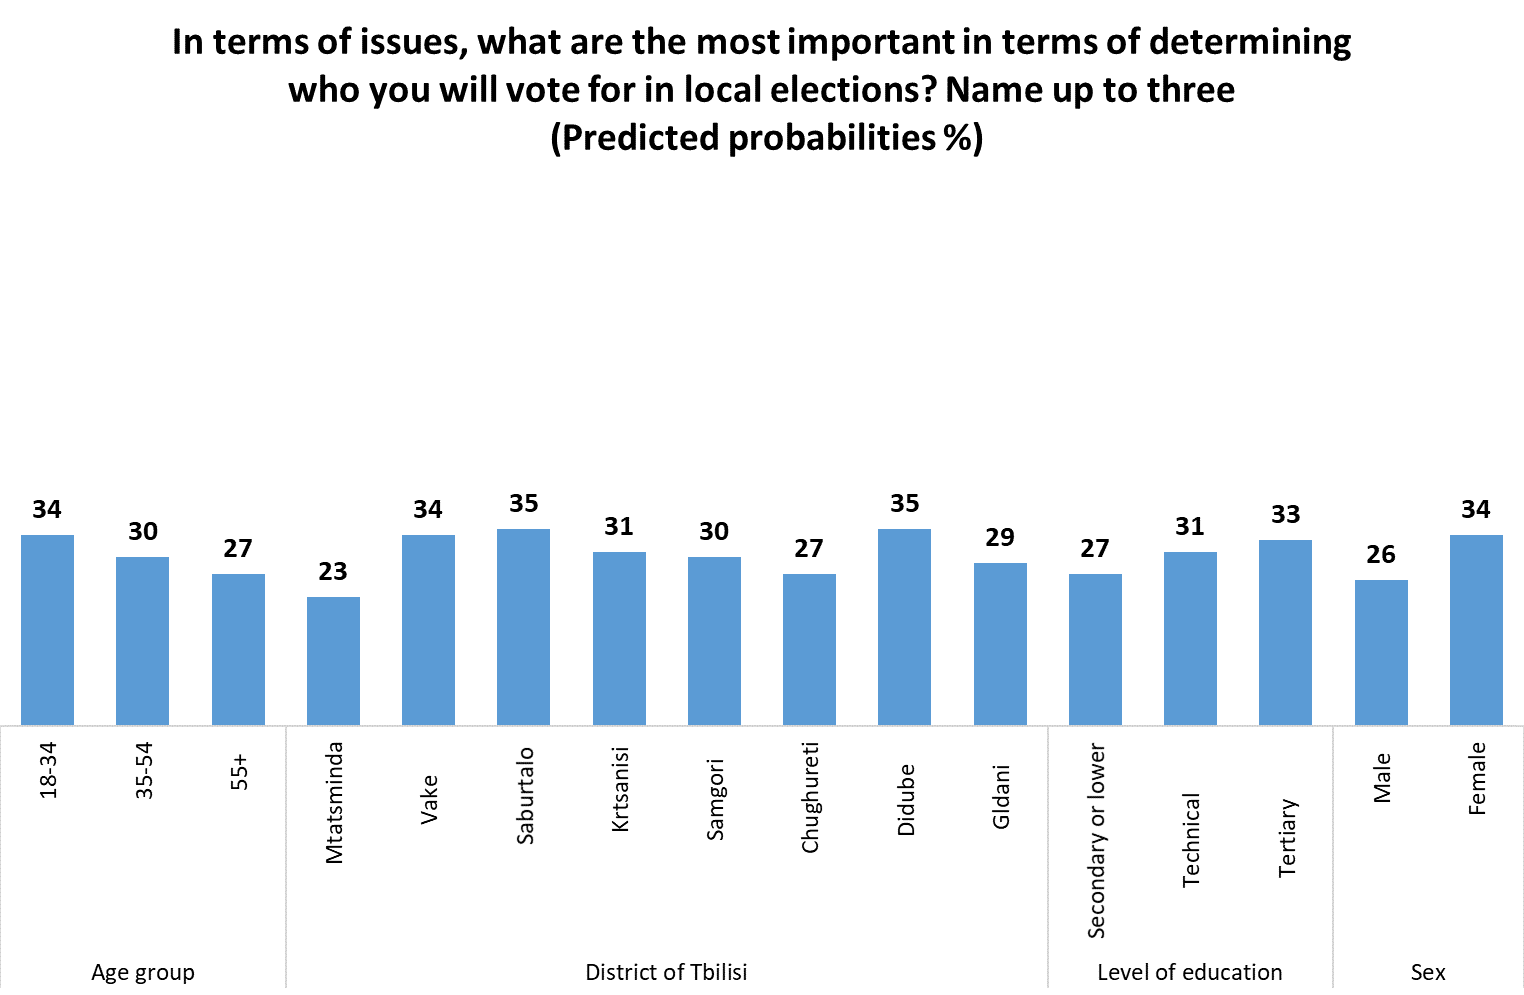
A regression model suggests that people over 55 were less likely to mention environmental issues than other age groups. Saburtalo, Vake, and Didube residents were significantly more likely to report they would vote for a party that would resolve environmental issues.  People with a higher education and women were more likely to name environmental issues as important as well.


Note: This and subsequent charts were based on a logistic regression model. The model includes gender (male, female), age groups (18–34, 35–54, 55+), district of Tbilisi (Mtatsminda, Vake, Saburtalo, Krtsanisi, Isani, Samgori, Chughureti, Didube, Nadzaladevi, Gldani), employment status (employed or not), education (secondary or lower, technical, tertiary), IDP status (forced to move due to conflicts since 1989 or not), ethnicity (Georgian, ethnic minority), wealth (ownership of 10 different items, a proxy variable), and closest party to the respondent’s views (Georgian Dream, opposition, Don’t know/Refuse to answer/No party).

The next most common issues were traffic, public transport, and roads. Looking at who named at least one of these variables shows that transport issues were significantly less likely to be mentioned in Mtatsminda compared to all other districts. 

As far as policy issues, people living in Tbilisi mostly think about environmental and transport issues when deciding who to vote for. Women, younger people, and people with a tertiary education are more likely to mention environmental issues. People in Mtatsminda are least likely of all districts to be concerned with public transport. 

The data used in this article is available here. Replication code for the above analysis is available here.

The views presented in this article do not represent the views of CRRC Georgia, the National Endowment for Democracy, or any related entity.  


Tuesday, November 02, 2021

Party activists near polling stations not acceptable for the majority in Georgia

Note: This article first appeared on the Caucasus Data Blog, a joint production of CRRC Georgia and OC Media. It was written by Elene Ergeshidze, a Researcher at CRRC Georgia. The views expressed in this blog post are the author’s alone, and do not reflect the views of CRRC Georgia, ISFED, or any related entity.

The presence of party activists and coordinators outside polling stations collecting information on voters has become a point of contention in recent years in Georgia. But what does the public think?

A number of local and international election monitors (including the OSCE, NDI, GYLA, ISFED) noted the widespread presence of party activists during 2020’s parliamentary elections. 

According to a CRRC and ISFED survey conducted in August 2021, only 16% of the public said they noticed a candidate, party activist, or coordinator near the election precinct during the past year, recording information about voters or asking voters for personal information. 

A large majority (78%) did not see coordinators, and 5% either reported not knowing or refused to answer. 

Opposition supporters were more likely to report noticing coordinators (33%) than Georgian Dream supporters (10%). Also, people from wealthier households (22%) were more likely to report so than poorer households (11%). 

About half of people did not think that the presence of coordinators at election precincts created an intimidating environment for voters (51%) or influenced who people vote for (55%). Still, more than a third of the respondents agreed with these statements (38%, 34%, respectively). One in ten did not know how to respond to the questions. 

A regression analysis suggests that partisanship and actually reporting seeing a party representative or coordinator predict attitudes towards the perceived atmosphere at election precincts. 

Opposition party supporters were 22 percentage points more likely to agree that it created an intimidating environment than Georgian Dream supporters and 24 percentage points more likely to say the presence of coordinators influenced who people vote for than supporters of the governing party. 

Those who said they have seen party representatives or coordinators near an election precinct were more likely to report that it created an intimidating environment for voters and influenced who people vote for than those who had not seen them.

Although more than half of the public disagreed that coordinators’ presence influenced how people vote or said it created an intimidating environment, a majority (59%) said that their presence was unacceptable. Only a third (30%) of the public said this was acceptable. 

As with the above variables, party support predicted who was more likely to think it was acceptable. Georgian Dream supporters were 2.5 times more likely (48%) to report it was acceptable than supporters of other parties (19%) or those with no specific party identity (27%). 

Those who reported they have not seen coordinators near voting precincts were more likely to find it acceptable (34%) than those who reported noticing them (23%). 

Interestingly people employed in the public sector were also more likely to report they felt it was acceptable for party representatives or coordinators to be present at voting precincts (36% vs 28%). 

While most of the public does not think the presence of coordinators at polling places influenced voters, a majority disapproved of the practice nonetheless. Notably, Georgian Dream supporters were much more accepting of the practice than others. 

The data used in this blog is available here. The analysis of whether different groups viewed the above issues differently was done based on a logistic regression model, which included sex, age group (18-34, 35-54,55+), settlement type (Tbilisi, other urban, rural), ethnicity (minority or not), education level (Secondary or less, vocational, or tertiary education), saw a coordinator or not, employment status (working in the public sector, private sector or not working), party support (Georgian Dream, Opposition, or don’t know/refuse to answer/ no party), and a simple additive index of durable goods (a common proxy of wealth).

Tuesday, October 26, 2021

Leaders or promises: What the Georgian public cares about when voting

Note: This article first appeared on the Caucasus Data Blog, a joint production of OC Media and CRRC Georgia. It was written by Dr. Tsisana Khundadze, a senior researcher at CRRC Georgia. The views presented in the article reflect those of the author alone, and do not reflect the views of ISFED, CRRC Georgia, or any related entity.

Researchers often talk about the importance of policies and political leaders, with the importance of each dependent on the political culture of an electorate. So what are the most important factors for people in Georgia when deciding who to vote for? 

This issue came to the forefront with the arrival of Mikheil Saakashvili in Georgia ahead of the first round of the 2021 local government elections. Whether this ultimately affected the election results is actively discussed

While the impact of Saakashvili’s arrival will likely remain unclear, data from an August 2021 ISFED survey, which CRRC Georgia carried out, shows that while policy matters to voters, political leaders are the most important factors in voters’ minds when deciding who to vote for.

The August 2021 ISFED survey on election-related processes shows that around a third of the population see a party’s electoral platform and promises as the most important factor when deciding who to vote for. A similar share reported the same about trust in the leaders of political parties. Every fourth person mentioned trust in specific members of the party as important. Fewer people mentioned the parties’ past performance or the political opinion of other people.

A regression analysis shows that the only factor that predicts whether trust in party leaders is the most important factor for someone is which party they support. 

People who support the Georgian Dream or an opposition party are 1.3 and 1.4 times more likely to say that trust in the leaders of a political party is an important factor when choosing who to vote for compared with people who do not report that they support a party. 

People of different genders, ages, settlement types, ethnicities, education levels, employment types, and economic situations have similar attitudes, controlling for other factors.

Note: This and the following charts were generated from a regression model. The model includes sex (male, female), age group (18-34, 35-54, 55+), settlement type (capital, urban, rural), ethnicity (Georgian, ethnic minority), education (secondary or lower, secondary technical, tertiary), employment status (public sector, private sector employee, private sector self-employed, not working), party respondent names as closest to his/her views (Georgian Dream, opposition party, did not name a party (Don’t know, Refuse to answer, No party), and an additive index of ownership of different items, a common proxy for wealth.

Whether someone names a party’s electoral platform and promises varies by a number of characteristics as well. 

People with higher than secondary education were 1.2 times more likely to mention a party’s electoral platform and promises as important than people with secondary or lower education. 

People who are not working and people who are employed in the public or private sectors were 1.2 times and 1.4 times, respectively, more likely to mention platforms and promises than self-employed people. 

Georgian Dream supporters were 1.2 times more likely to name a party’s platform and promises as important when deciding who to vote for compared to people who do not name any party. 

There were no significant differences in terms of gender, age, settlement type, ethnicity, or economic situation, controlling for other factors.

While trust towards the party leaders and a party’s promises were the most important factors, when faced with a choice between the two, people leaned towards trust in leaders. 

About half (48%) of the Georgian public reported that it was more important who the party leaders are. In contrast, a third (31%) said what the party promised was more important.

A number of variables predict which direction people lean in. A regression analysis showed that ethnic Georgians were 1.5 times more likely to choose leaders over promises compared to ethnic minorities. 

Opposition supporters were 1.2 times more likely to consider party leaders as more important compared to Georgian Dream supporters. 

Lastly, the wealthier a person’s household, the more likely that person was to agree that who the party leaders are is more important. 

There were no significant differences between people of different genders, ages, settlement types, education levels, or employment statuses, controlling for other factors.

People deem a party’s programme and promises as well as  party leaders important. However, people tend to place more emphasis on leaders. Georgian Dream supporters were more likely to name a party’s electoral platform and less likely to choose leaders over promises. Opposition supporters are most likely to name trust in leaders as most important. Ethnic minorities seem to care less about the leaders compared to ethnic Georgians.