Tuesday, June 29, 2021

CRRC’s 7th Annual Conference: The South Caucasus after a Turbulent Year

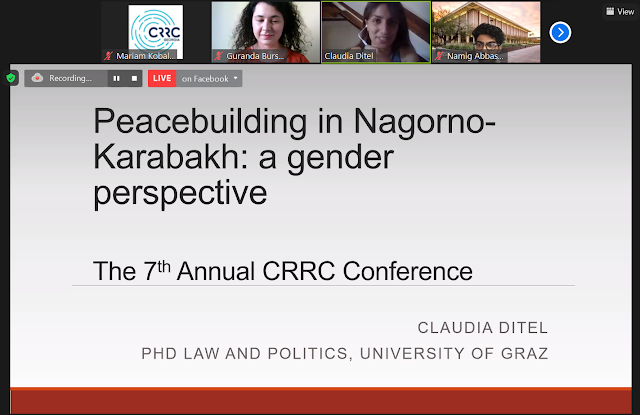
On June 25 and 26, the Caucasus Research Resource Centers in Armenia, Azerbaijan, and Georgia hosted the 7th annual methods conference. This year the conference focused on the changing landscape of the South Caucasus and the turbulent year witnessed in the region. From the conflict between Armenia and Azerbaijan, to the political crisis in Georgia, speakers focused on what and how they are studying the changing landscapes in the region.

The first day of the conference featured two panels, one focused on COVID 19 and related innovations in social science and policy research. The second focused on politics and democratization in the South Caucasus.

The first day also featured two keynote addresses. In the first, Dr. Gevorg Yeghikyan described how big data from taxis and public transport could be used to improve urban planning. In the second, Dr. Jennifer McCoy presented research on the democratic hypocrisy hypothesis and experimental work on how presenting out groups as threats erodes democratic support.


The second day of the conference also featured two panels, with the first looking at how societies are changing in the South Caucasus. The second explored the prospects for conflict transformation in the South Caucasus.


The conference concluded with a keynote speech from Dr. Laurence Broers. Dr. Broers' address focused on how we can study the recent developments in the conflict between Armenia and Azerbaijan.


The full conference video is available for viewing here: Day 1 and Day 2.

The conference agenda and abstract book is available here


Tuesday, June 22, 2021

The gap between Georgian Dream supporters and everyone else is widening

Note: This article first appeared on the Caucasus Data Blog, a joint publication of CRRC and OC Media. It was written by Nino Mzhavanadze, a researcher at CRRC Georgia. The views presented in the article are the author’s alone, and do not necessarily reflect the views of CRRC Georgia, NDI, or any related entity.

Whether one considers themselves to be a supporter of Georgian Dream or not appears to be the single biggest factor in their view that Georgia is ‘heading in the right direction’ or not. 

The share of the public thinking the country is going in the wrong direction has fluctuated dramatically over the years. But which groups have been more or less pessimistic over time remains an open question. The merged dataset of NDI and CRRC Georgia surveys from 2014 to 2021 suggests that throughout the fluctuations in attitudes, the largest determinant of whether people are pessimistic or optimistic about the direction the country is headed in is the party they support. 

Fluctuations in views of where the country is headed

Georgians’ views of where the country is headed have fluctuated together with Georgia’s often turbulent social, political, and economic situation.

The devaluation of the Georgian lari, starting in November 2014, is concomitant with the decline in views of the country’s direction between August 2014 and April 2015.  Negativity continued to rise in the next wave of the survey in November 2015. From this point, negativity in views of the country’s direction declined until November 2016. After a slight uptick in negativity between June and December 2017, negative attitudes were largely stable between 36% and 39% until April 2019. 

From April 2019, the level of negativity in the country steadily climbed, reaching 53% of the public viewing the country’s direction negatively in December 2019. The period between April 2019 and December 2019 coincides with the large-scale protests over the visit of Russian politician Sergei Gavrilov as well as subsequent failures to deliver promised reforms.

In the first post pandemic survey in August 2020, the rate of negativity dropped to 32%. This likely stems from Georgians’ positive assessments of the Government’s handling of the COVID-19 crisis. 

However, the three NDI surveys since suggest that this lull in negativity has receded, with 44% of the public thinking that the country is headed in the wrong direction and only 25% in the right direction as of February 2021. Increased pessimism likely stems from the political crisis which followed the October 2020 elections, and has only recently been largely, though not fully, resolved. 


What predicts pessimism and optimism?

While the above highlights major fluctuations in attitudes towards the country’s direction, a key question remains: which groups in society are more or less pessimistic?

People in Tbilisi and other urban areas are eight and five percentage points more likely to agree with the idea that Georgia is going in the wrong direction than people in rural areas. 

People who have secondary technical or a lower level of education are two to four percentage points more pessimistic than those with higher education.

People who do not have a job are three percentage points more likely to report that the country is going in the wrong direction.

Above and beyond all of the above, which party someone supports is the best predictor of whether someone thinks the country is headed in the right or wrong direction. Opposition party supporters are 34 percentage points more likely to have a negative view of where the country is headed, on average, controlling for other factors. Those who support no party are 21 percentage points more likely to have a negative view of where the country is headed. 

Aside from being the best overall predictor, supporting an opposition party or no party predicts views about the country’s direction for each wave of the survey when analysed independently. And while the influence of party support as a predictor has fluctuated over time, it has been increasing overall.

In April 2014, supporters of the ruling Georgian Dream party were 5 percentage points less likely to think the country was going in the wrong direction compared to supporters of no party. Opposition supporters were 22 percentage points more likely than Georgian Dream party supporters to think the country was going in the wrong direction. 

The gap in views has fluctuated, but increased overall. In February 2021, Georgian Dream supporters were 46 percentage points less likely to think the country was going in the wrong direction compared to opposition supporters, a 24 percentage points increase in the gap in perceptions. Similarly, the gap in perceptions rose by 23 percentage points between Georgian Dream supporters and non-partisans. The changes in the gap between Georgian Dream and supporters of the opposition and non-partisans are also highly correlated (a 78% correlation between the two sets of marginal effects). These data taken together suggest a widening gap between the perceptions of Georgian Dream supporters and everyone else in Georgia.

As assessments of Georgia’s direction have changed over time, several factors have been associated with relatively minor differences in views of where the country is headed. While demographics explain some of the variation in people’s views, the party people support explains more than all of the other factors combined. Whether this is caused by supporting a given party or whether people change their party when their views of the country’s direction change is an open question. What the data do suggest though is that there is a widening gap between the perceptions of Georgian Dream supporters and everyone else in society.

Note: The above analysis is based on a logistic regression, where the dependent variable is a negative assessment of the country's direction, and the independent variables include gender, age, settlement type, education, employment status, partisanship, and survey wave.  

Tuesday, June 15, 2021

Who smokes in Georgia?

[Note: This article first appeared on the Caucasus Data Blog, a joint production of CRRC Georgia and OC Media. It was written by Dustin Gilbreath, the Deputy Research Director at CRRC Georgia. The views presented in the article do not represent the views of CRRC Georgia or any related entity.]

An estimated 11,400 people die in Georgia due to tobacco consumption annually. Data from Caucasus Barometer 2019 suggests that efforts to counter smoking should likely focus on men, people in Tbilisi, and poorer individuals.

No one questions whether tobacco consumption is a public health scourge: tobacco is estimated to cause eight million deaths a year worldwide. In Georgia, in 2016, 29% of the 15+ population was estimated to be a smoker, making Georgia 33rd in the world for smoking prevalence at the time among 146 countries for which data was available. 

Overall smoking prevalence in Georgia is relatively high. Almost one-third of the public (29%) reported smoking in 2019.  This compares with 30% in 2013 and 35% in 2008, suggesting a decline of six percentage points between 2008 and 2019.  

Data in the 2019 Caucasus Barometer suggests that men in particular are significantly more likely to be smokers than women. While women have a nine percentage point chance of smoking, controlling for other factors, men have a 55 percent chance of smoking. 

In reality, the gap is likely smaller than this data suggests when it comes to sex. A large majority of the public (80%) think it is never acceptable for a woman to smoke. In this regard, it is reasonable to believe women would not necessarily report that they smoke to an interviewer. 

A study by the National Centre for Disease Control (NCDC) suggests that this is in fact the case. In the study, respondents were administered a urine test to check whether they had actually been smoking. It found that 12% of women had traces of tobacco in their body as opposed to the 9% that reported smoking on the survey. While this suggests the gap is likely being smaller than the data suggests, there likely remains a large divide.

Aside from sex, people’s age, settlement type, and household economic situation predict whether or not they smoke. Younger people are less likely to report smoking than people in the 35–54 age range, as are older people. The smaller share of older smokers likely stems from tobacco-related mortality. People in Tbilisi are almost twice as likely to smoke as people in rural areas. Similarly, people are 1.5 times as likely in other urban areas, compared with rural areas, to smoke. The poorest households in Georgia are 3 times as likely to smoke as the best off. 


Aside from who smokes, the data also tells us how much smokers smoke. Again sex predicts how much people smoke, as does people’s level of education. Controlling for other factors, female smokers smoke 12 cigarettes a day less than male smokers. People with a higher education smoke 5 cigarettes less per day compared with those with only secondary education or lower.

Although the data from the Caucasus Barometer is promising in that it shows that smoking prevalence has declined over the years, there are still a relatively large number of smokers in Georgia. 

The data suggests that anti-smoking campaigns need to target men in particular. Similarly, smoking is most common among poorer households and in Tbilisi, suggesting a need for increased anti-smoking efforts among these populations.

Note: The above data analysis is based on logistic and ordinary least squares regression models which included the following variables: age group (18-35, 35-55, 55+), sex (male or female), education (secondary or lower/vocational/higher), settlement type (capital, urban, rural), wealth (an additive index of ownership of 9 different items, a proxy variable), and employment situation (working or not). 


Tuesday, June 08, 2021

Who doesn’t watch TV in Georgia?

Note: This article first appeared on the Caucasus Data Blog, a joint effort of CRRC Georgia and OC Media. It was written by Dustin Gilbreath, Deputy Research Director at CRRC Georgia. The views presented in the article do not represent the views of CRRC Georgia or any related entity.

Television is the primary source of information for most in Georgia, and it has been for at least the last decade. Yet, as internet penetration expands in Georgia, so too has the share of people using the internet as their primary source of information, and data from CRRC Georgia’s 2020 Caucasus Barometer survey suggests that many people have simply stopped watching TV.

The 2020 Caucasus Barometer survey asked respondents which TV station they trusted most. In response to the question, nearly one in five (19%) reported that they do not watch TV.

To understand who does not watch TV in Georgia, a regression controlling for people’s age, sex, ethnicity, the settlement type they live in, education level, employment status, number of adults in the household, whether or not the household had children, whether the respondent was internally displaced, and the household’s economic status was run.

Of the above variables, ethnicity, age, and whether or not there are children in a household predict whether or not someone watches TV. Ethnic minorities were 24 percentage points more likely to report they do not watch TV, controlling for other factors. People without children in their household were nine percentage points more likely to report they do not watch TV. 

The largest difference in demographics is by age, however. A person in the 18-34 age group has a 40 percent chance of not watching TV compared with someone in the 55+ age range who has a 9 percent chance of not watching TV, controlling for other factors. 

The data indicates that most people not watching TV use the internet. People who report not watching TV report using the internet every day at a rate higher than people who report watching TV (83% versus 59%). This difference holds up when controlling for other factors, though the difference declines to six percentage points, suggesting that demographics (including,  age, sex, ethnicity, settlement type, education level, employment status, number of adults in the household, children in a household, internal displacement status, and economic condition) explain much of this.

In short, almost one in five Georgians report that they do not watch TV, with young people and ethnic minorities being significantly less likely to watch TV and the data appears to indicate that Georgians are replacing TV with the internet for information.

Note: The data used in this article are available here.

Tuesday, June 01, 2021

Does religion make Georgians happy?

Note: This article first appeared in the Caucasus Data Blog, a joint production of CRRC Georgia and OC Media. It was written by Davit Lursmanashvili, a Junior Fellow at CRRC Georgia. The views presented in this article are the author’s alone and do not necessarily represent the views of CRRC Georgia or any related entity. 

The connection between religion and happiness has been explored in a wide variety of studies, with data pointing to the religious being happier in many countries. However, data from the ISSP survey on religion, which was conducted in Georgia in early 2020, suggests that there is relatively weak evidence of religiosity being tied to happiness in Georgia. 

To explore whether happiness was tied to religiosity, four variables related to religiosity were used, including self-assessed religiosity, self-described spirituality and belief in religion, frequency of prayer, and frequency of engagement in religious activities aside from attending services. 

On the ISSP survey, a majority of the population (88%) said they consider themselves to be religious to some degree when asked how they would assess their own religiosity. 

When it came to spirituality and adherence to an organised religion, most (63%) considered themselves to be spiritual and follow a religion, 14% reported that they followed a religion but were not spiritual, 20% said that they were spiritual but did not follow a religion, and 3% said they neither followed a religion nor were spiritual. 

About half (48%) of the public said they never took part in religious activities aside from attending services, 40% did several times a year, and 12% did so on a monthly basis or more. 

With prayer, 10% of Georgians said they never prayed, 14% prayed several times a year, and 75% did so monthly or more often. A majority also reported being happy (76%).

The data was included in regression analyses which controlled for respondent age, sex, education level, whether they were working or not, had children in their household, settlement type, ethnicity, and marital status. 

When the analysis was run testing whether more religious and less religious people were more likely to be happy, the data suggested no statistically significant association. 

Similarly, how frequently people engaged in religious events aside from attendance at non-holiday sermons was not associated with happiness. Frequency of prayer was not associated with happiness either.

However, spirituality was associated with people’s happiness. 

Those who did not follow an organised religion but were spiritual were significantly more likely to be happy than those that reported following a religion. The non-religious and non-spiritual were not significantly more likely to be happy than the religious according to the regression analysis, but this likely stems from the small sample size within this group. 

The data is less than conclusive, though still striking. Of the four religiosity variables tested for association with happiness, three were not associated with happiness. The one that was associated with happiness worked in the opposite direction than is usually seen internationally. 

This pattern stands in contrast to the general picture globally, calling for further research into religion and happiness in Georgia.

Note: The data used in this article is available here. The results presented in this article are based on a logistic regression model. The outcome variable, happiness, is coded as happy or not happy. The religion variables are coded as follows: How would you describe yourself? (Religious, not religious); Which best describes you? (I follow a religion, I am a spiritual person; I follow a religion, I am not a spiritual person; I don't follow a religion, I am a spiritual person;  I don't follow a religion, I am not a spiritual person); How often do you pray? (Never, up to several times a year, once a month or more). How often do you participate in religious activities other than attending religious service? (Never, up to several times a year, once a month or more).  The control variables included age, sex, education level (tertiary education or not), whether the respondent was working or not, had children in their household or not, settlement type (Tbilisi, other urban, rural), ethnicity (minority or not), and marital status (married or not).