Showing posts with label Trends in the Data. Show all posts

Thursday, February 16, 2017

Trends in the data: Changing attitudes towards divorce in Georgia

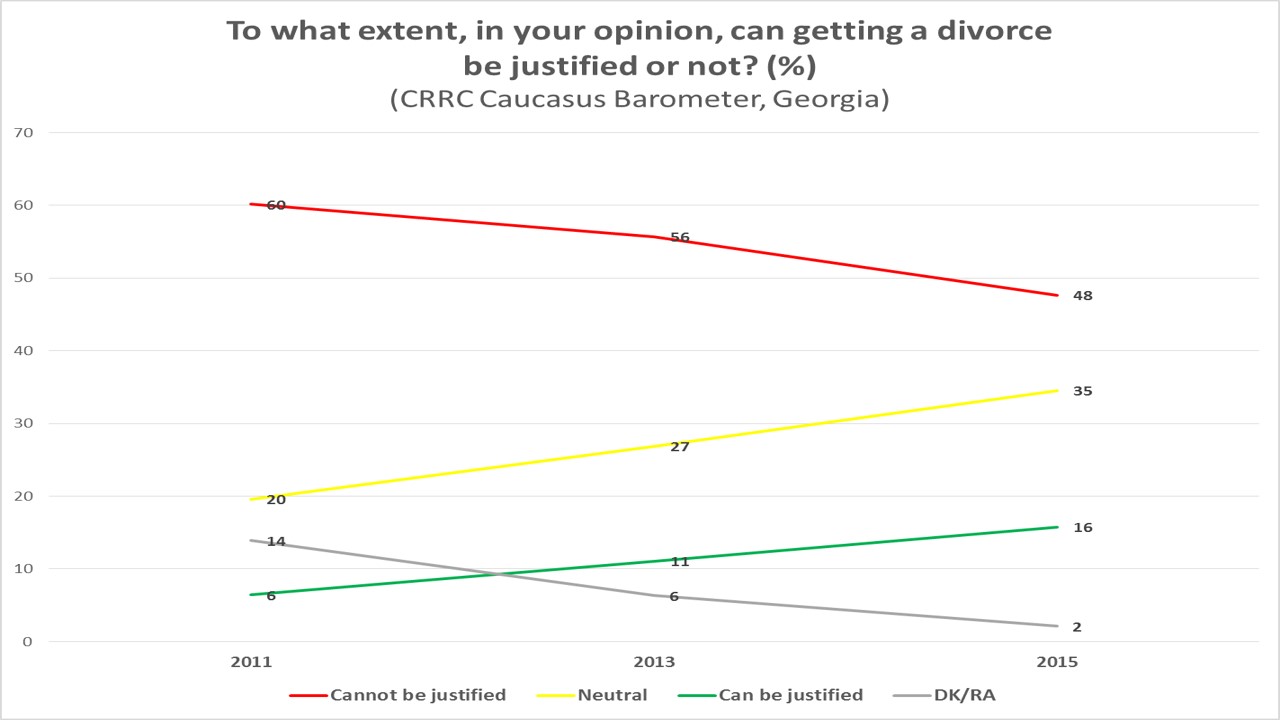
CRRC’s Caucasus Barometer data show that assessments of whether divorce can or cannot be justified are changing in Georgia. This blog post looks at this trend, and at how these assessments differ by gender, age, and settlement type.

The share of those who report that divorce can be justified has increased since 2011, while the share of those who think divorce cannot be justified decreased, as did the share of those who answered “Don’t know”. Notably, both men and women report similar assessments (2011, 2013, 2015).


Note: The original 10-point scale was re-coded into a 3-point scale, with original codes 1 through 4 labeled “Cannot be justified”, codes 5 and 6 labeled “Neutral”, and codes 7 through 10 labeled “Can be justified” on the chart above.

Unsurprisingly, residents of Tbilisi report more frequently that divorce can be justified, compared to people living outside the capital. Outside Tbilisi, the most frequent responses are that divorce cannot be justified. In Tbilisi “neutral” assessments became most frequent in 2015.

Although people who are 56 and older report most often that divorce cannot be justified, such assessments have gradually become less common even for people in this age group, decreasing by nine percentage points since 2011. The sharpest decrease is among those who are between 36 and 55 years old.


Overall, the opinion that divorce cannot be justified remains prevalent in Georgia. Nonetheless, the share of those who report that divorce can be justified is growing, and the share of those who report it cannot be justified is declining. This is true for residents of different settlement types, both males and females, and across age groups, although the attitudes of older people and those living in rural settlements are changing less.

To have a closer look at the Caucasus Barometer data, visit CRRC’s Online Data Analysis tool.

Monday, October 24, 2016

Trends in the data: Changes in Employment Sector and Type of Employment in Georgia

According to CRRC’s Caucasus Barometer (CB) surveys from 2008 to 2015, the self-reported employment rate is rather stable in Georgia – approximately 35%. This blog post looks at the trends in CB data on primary employment sector and type of primary workplace. Throughout the post, only the answers of those who reported being employed – slightly above a third of the population – are analyzed.

In 2015, as in previous waves of CB, the largest share of those who considered themselves employed – 14% – reported being employed in the agriculture, hunting, or forestry sector. Importantly, however, this share has declined considerably since 2008, when 29% of the employed reported being employed in this sector. Over the same period, the shares of those employed in other major sectors (trade, education, construction) have remained stable.


Note: In addition to actual responses of “Other”, several other options of low frequency are also included in this category on the chart above. That is, category “Other” in this chart includes responses “Healthcare and Social work”, “Financial Intermediation and Banking”, “Hotels, Restaurants, Cafes”, “Manufacturing”, “Transport and Storage”, “Electricity, Gas, and Water Supply” and “Mining and Quarrying”. 

A similar downward trend is observed between 2008 and 2015 in the share of employees who reported “owning a business without employees.” While in 2008, this share was about a third of those who were employed, roughly equal to those employed by state organizations, it decreased to 21% in 2015.

Although these two findings are not necessarily related, they show interesting trends in the employment situation in Georgia. Fewer people report working in the agriculture, hunting, and forestry sector, and fewer people report being sole proprietors than in the past. Both these trends suggest that the composition of the Georgian labor market may be shifting, and both call for further and thorough analysis.

CRRC’s Caucasus Barometer survey data and respective documentation are available at our online data analysis tool.


Monday, September 26, 2016

Trends in the Data: Declining Trust and Rising Ambivalence towards the Media in Georgia

CRRC has written before about the ambivalent attitude of the population of Georgia towards journalists. Based on CRRC’s Caucasus Barometer (CB) survey data, this post explores the population’s trust in the media over time, showing that it has been declining steadily since 2008, while ambivalence, demonstrated by the finding that people have difficulty stating their opinion and opt instead for either/or options, has been increasing. 

Between 2008 and 2015, reported trust in the media declined by 28 percentage points in Georgia. The biggest drops are between 2008 and 2009 and between 2011 and 2012. Interestingly, over the same period, the reported level of distrust in the media has remained rather steady. Ambivalence, however, is rising. The share of the population responding that they “neither trust nor distrust” the media climbed from 28% in 2008 to 54% in 2015.


Note: A 5-point scale was used during the survey. For this chart, answer options “Fully trust” and “Trust” have been combined into ’Trust’ and answer options “Fully distrust” and “Distrust” have been combined into ’Distrust’. Caucasus Barometer was not carried out in 2014.

The decline in trust and rise in ambivalence towards the media is consistent with responses to other CB questions on the media. Over time, the population’s positive assessment of how well TV journalists inform the population about what is going on in the country has also declined, while their ambivalence has risen. Since both trends are steady, this change seems to be less of a question of a reaction to specific events and more of a general shift. Between 2009 and 2015, positive assessments of how well TV journalists inform people dropped by 14 percentage points while ambivalence increased by 12 percentage points. As in the answers about general trust in the media, reported negative assessments remain stable.


Note: A 5-point scale was used during the survey. For this chart, answer options “Very well” and “Quite well” have been combined into option ‘Well’ and answer options “Very poorly” and “Quite poorly” have been combined into ‘Poorly’. 

Similar patterns can be discerned with regards to whether the Georgian population thinks that TV journalists serve their interests. Since 2009, the share of the population who reported believing that TV journalists, overall, serve the interests of people like them decreased by 13 percentage points, while ambivalence increased by 15 percentage points. 


Note: A 5-point scale was used during the survey. For this chart, answer options “Completely agree” and “Somewhat agree” have been combined into option ’Agree’ and answer options “Completely disagree” and “Somewhat disagree” have been combined into ’Disagree’. This question was not asked in 2013. 

The population of Georgia’s trust in the media has been steadily declining since 2008. Interestingly, this decline coincides with an increase in ambivalent attitudes rather than distrust. The same is reflected in assessments of how well TV journalists keep the public informed and how well they represent the interests of “regular” people. In all cases, positive assessments have decreased, while ambivalence has increased. If the trends marked here are indeed general shifts in attitudes towards the media, as the data for available years suggests, this has the potential to point to long-term changes that are less attached to specific political events or media scandals and may indicate avenues for further research on public opinion in Georgia about the media. 

The datasets used in this blog post and related documentation are available at our online data analysis platform. 

Monday, September 12, 2016

Trends in the Data: Changes in the level of trust in social and political institutions in Armenia

According to an earlier CRRC blog post, which looked at the changes in the level of trust in social and political institutions in Georgia from 2011 to 2015, trust in a fair number of institutions in Georgia declined. This post provides a comparable review of the situation in Armenia, using CRRC’s Caucasus Barometer (CB) survey data.

The level of trust in most political institutions CB asked about has declined in Armenia since 2011. The largest decline can be observed in respect to the President. Trust dropped from 36% in 2011 to 16% in 2015. Trust in executive government and parliament also declined between 2011 and 2013, and has stabilized since at a rather low level.

Note: The charts in this blog post only show the share of those who report trusting the respective institution. Answer options “Fully trust” and “Rather trust” were combined.

The survey results also show a slight decline in trust in courts between 2011 and 2015. Trust in the police, educational system and healthcare system remained largely unchanged, while trust in the army increased.


In sum, of the institutions CB asked about, the largest drop in the level of trust is observed was in the President, while trust in the army increased in Armenia. The levels of trust in executive government, parliament, and courts in Armenia have slightly declined since 2011, while the levels of trust in the healthcare system, police and educational system have not changed.

To learn more about trust in institutions in the South Caucasus, take a look at the data using our Online Data Analysis tool.

Friday, September 02, 2016

Trends in the Data: Declining trust in the banks in Georgia

The last few years have been turbulent for Georgia’s national currency, the Lari (GEL), the value of which started to decline in November 2014. While in October 2014 one US dollar traded for GEL 1.75, since February 2015 to date, the exchange rate has fluctuated between GEL 2 and 2.5 per dollar. Needless to say, the depreciation of the Lari has been widely covered by the media, and although it had numerous causes, a number of organizations and people were blamed for the devaluation. With this background in mind, this blog post looks at how reported trust in banks has changed in recent years in Georgia, using CRRC’s Caucasus Barometer (CB) survey data.

In 2015, for the first time since CB started asking the population about their trust in banks, more people in Georgia reported distrusting than trusting them. The decline in trust, however, started well before the GEL began to depreciate. While 27% reported trusting banks in October 2015, 53% did in October 2008.


Note: The original five-point scale was recoded into a three-point scale for this chart. Answer options “Fully trust” and “Trust” were combined into the category ‘Trust,’, while “Fully distrust” and “Distrust” were combined into ‘Distrust.’ “Neither trust nor distrust” was not recoded. The Caucasus Barometer survey was not conducted in 2014.

As is generally the case with trust in social and political institutions in Georgia, the population of rural settlements report less distrust in banks than residents of urban settlements. Nonetheless, since 2008, distrust in the banks in rural settlements has nearly tripled, from 11% in 2008 to 30% in 2015. In the capital, distrust has almost doubled during the same period.
 

Although there has been a decline in trust in the banks in recent years, this decline started before the devaluation of the Lari began in 2014. While the devaluation likely contributed to the decline in trust, the fact that trust began declining earlier shows that there is more to the story than the devaluation.
Given that the banking system, and trust in it, is crucial to the effective functioning of a country’s economy, the government of Georgia and banks themselves should consider efforts aimed at building trust in the banking sector.

What factors are at play in declining trust in the banks in Georgia? Join the conversation on the CRRC-Georgia Facebook page here, and to explore more data on Georgia and the South Caucasus, visit our online data analysis tool (ODA).

Monday, August 29, 2016

Trends in the data: A majority of the population of Georgia now uses the internet

Internet use is on the rise worldwide, and while internet penetration is increasing the world over, in some countries still relatively small shares of the population use it. While only about a third of the population of Georgia reported using the internet at least occasionally in 2009, today, slightly over half of the population is online. This blog post looks at the trends in internet usage in Georgia from 2009 to 2015 by age and settlement type, using the CRRC’s Caucasus Barometer survey (CB) data.

Until 2012, a larger share of the population had reported never using the internet or not knowing what it was than reported using it. In 2013, roughly equal shares reported using and not using the internet. On CB 2015, a majority (57%) of the population of Georgia reported using the internet at least occasionally.

Note: The original question asked: “How often do you use the internet?” For this blog post, answer options “Every day”, “At least once a week”, “At least once a month”, and “Less often” were combined into ‘Yes’. Answer options “Never” and “I don’t know what the internet is” were combined into ‘No’. 

Throughout this period, as one might expect, a larger share of the younger generation has used the internet than the older generation, with 87% of 18-35 year olds reporting using the internet at least occasionally in 2015, compared to only 19% of people aged 56 and older. Interestingly, the largest increase is among those between the ages of 36 and 55, with only 24% of this age group using the internet in 2009 compared with 63% in 2015.

Note: The chart above presents only the shares of those who reported using the internet at least occasionally. 

As is well known, internet usage is lowest in Georgia’s rural settlements. In 2015, slightly less than half of the rural population (43%) reported using the internet. In contrast, roughly seven in ten residents of urban settlements use the internet. Urban settlements outside the capital have seen the largest increase in internet use between 2009 and 2015, with the share of internet users increasing more than 2.5 times in this period, while the share of internet users has more than doubled in rural settlements.

Note: The chart above presents only the shares of those who reported using the internet at least occasionally. 

Currently, a majority of the population of Georgia use the internet at least occasionally. As one might expect, more young people use the internet than older people, and they use it more frequently. While slightly less than half of the rural population uses the internet, this share is steadily increasing. If this growth continues, a majority of the rural population of the country will soon be online as well.

To explore the data yourself, try our online data analysis tool.

Monday, August 08, 2016

Trends in the Data: Public support for democracy is slowly waning in Georgia (Part 2)

Analysis of survey findings from the last few years, presented in the first part of this blog post, shows that public support for democracy is declining in Georgia. Since 2012, the share of the population who would prefer democracy over any other kind of government dropped from 68% to 47%. As public support for democracy is indispensable to democratic consolidation, it is important to know how and why support for democracy is changing. This blog post describes a number of tendencies that might be related to the declining public support for democracy in Georgia, using the CRRC’s Caucasus Barometer (CB) survey data.

One reason for the declining support for democracy may be related to the worsening of the public’s assessment of domestic political developments in the country. Specifically, while nearly half the population agreed with the statement that “[domestic] politics is going in the right direction” in 2011-12, only 15% did so in 2015. On the other hand, the share of the population that agreed with the statement that “[domestic] politics is going in the wrong direction” quintupled between 2012 and 2015. The share of those who agreed with the statement that “[domestic] politics does not change at all” also increased.


Note: A show card was used for this question. Answer options "Politics is definitely going in the wrong direction" and "Politics is going mainly in the wrong direction" were combined into ‘[Domestic] politics is going in the wrong direction’ on the chart above. Answer options "Politics is going mainly in the right direction" and "Politics is definitely going in the right direction" were combined into ‘[Domestic] politics is going the right direction’. “[Domestic] politics does not change at all” was not recoded. Options ‘Don’t know’ and ‘Refuse to answer’ are not shown on the above chart. CB was not carried out in 2014.

Worsening assessments of domestic political developments might also be related to an increased perception that the government treats people unfairly. The share of those who did not agree with the statement that “people like yourself are treated fairly by the [present] government” more than doubled between 2013 and 2015.

Note: Answer options "Completely agree" and "Somewhat agree" were combined into ‘Agree,’ and options "Somewhat disagree" and "Completely disagree" were combined into ‘Disagree’.

Declining trust towards important political institutions such as parliament, executive government, the president, local government and the court system, also discussed in a recent blog post, might be considered a logical continuation of the tendencies mentioned above. For instance, since 2011 the shares of those who said that they trusted executive government, parliament and local government nearly halved, while the shares of those who report distrusting these institutions increased. Although trust towards the president and court system increased in 2015 compared with 2013, it is still lower than in 2011. This is a serious problem, because trust in political institutions is crucial for the maintenance and consolidation of democracy.


Note: Answer options "Fully trust" and "Rather trust" were combined into ‘Trust’, and options "Rather distrust" and "Fully distrust" were combined into ‘Distrust’. Options “Neither trust nor distrust”, ”Don’t know” and ”Refuse to answer” are not shown on the chart.


Trust in political institutions not only can strengthen democracy, but can also make governance more effective and cost-efficient. Declining trust towards major political institutions could impede Georgia’s stable development. Thus, it is of high importance to regularly monitor changes and analyze their causes. Since the causes of social change are usually complex, further, more focused research is needed on the issues highlighted in this blog post, with the eventual goal of improving the performance of major political institutions, leading to the population’s increased trust in these institutions. 

As the first part of this blog post showed, although the share of the population who supports democratic governance in Georgia declined by a third in recent years, reported support for democratic values strengthened. These findings, taken together, suggest that declining public support for democracy is unlikely to be caused by the weakening of democratic values. Thus, the causes for the decline likely lay elsewhere. The findings presented in this and in the first part of this blog post also suggest that the population’s knowledge and understanding of what democracy means are different from the predominant conception of liberal democracy. Therefore, increasing public awareness of democracy will be important for its consolidation in Georgia. 

This blog post has shown that fewer people report that domestic politics in Georgia is going in the right direction and that more people report the government treats people unfairly. Not surprisingly, trust in political institutions also declined. Taken together, these findings suggest that declining public support for democracy may be related to the public’s worsening assessments of the development of the country’s domestic political situation over the course of the past few years.

To find out more about public opinion in Georgia, visit CRRC’s online data analysis tool. 

Monday, May 09, 2016

Trends in the Data: Public support for democracy is slowly waning in Georgia


Following the first ever peaceful transition of power in Georgia’s 2012 parliamentary elections, the country improved its position in the Freedom House and Polity IV democracy rankings. Results from the latest polls, however, show that public support for democracy in Georgia has declined over the past few years. Weakening support for democracy can pose a serious problem for the process of democratic consolidation in Georgia, that is, the institutionalization and maturation of Georgia’s democracy. Reversion to a non-democratic system is unlikely in consolidated democracies, where a democratic system is accepted as “the only game in town”. Public opinion polls make it possible to measure public’s support for democracy. This blog post looks at how attitudes towards democracy have changed in Georgia in recent years.

According to CRRC’s 2015 Caucasus Barometer (CB) survey, nearly half of the population of Georgia (47%) agrees that “democracy is preferable to any other kind of government”, and only 16% thinks that “in some circumstances, a non-democratic government can be preferable”. However, if we compare these findings with previous waves of CB, it is clear that during the past four years, support for democracy has declined in Georgia. It was rather stable from 2011 through 2013, with approximately two thirds of the population reporting that democracy is the best form of governance. While in 2011, only 8% thought that “in some circumstances, a non-democratic government can be preferable”, this share doubled in 2015. The share of those who answered ”for someone like me, it doesn’t matter what kind of government we have”, also increased during the same period.


Note: Options ‘Don’t Know’ and ‘Refuse to answer’ are not shown on the above chart. CB was not carried out in 2014. 

Notably, the share of the population who consider Georgia a democracy has declined. According to CB 2011, half the population characterized Georgia as either ”a full democracy” (8%) or ”a democracy but with minor problems” (42%). In 2015, only 3% and 20% reported the same. The share of those who characterized Georgia as ”a democracy but with major problems” or ”not a democracy” increased.


It might be expected that one of the reasons why support for democracy declined would be the weakening of democratic values. Although a number of indicators can be used to test this,  CRRC data  do not suggest that this is the case. Support for democratic values has, in fact, visibly increased. For instance, the share of the population who agrees with the statement that “people should participate in protest actions against the government, as this shows the government that the people are in charge” has increased.  Since 2012 the share of the public agreeing with this statement has been at least twice as large as the share of those who agreed with the opposite statement.


Although, over time, the share of the population who regard Georgia as a democracy declined, the data shows that freedom of speech has likely been strengthened. For instance, since 2009 the share of those who agree that in Georgia people have the right to openly say what they think increased from 55% to 72% in 2015, while the share of those disagree with the opinion halved.


There is, thus, no empirical evidence confirming that the decline in public support for democracy in Georgia is caused by the weakening of democratic values. Hence, the reasons for the decline described in this blog post likely lay elsewhere.

When Georgia’s democratic development is discussed, public opinion is often forgotten. As this blog post has tried to demonstrate, the political elite should not take public support for democracy for granted. Attitudes towards democracy, like other attitudes, may often be changing. Further research is needed to understand the causes of this, since democratic consolidation is less likely without public support.

To find out more about public attitudes in Georgia, visit CRRC’s online data analysis tool.