Showing posts with label Governance. Show all posts

Tuesday, August 10, 2021

Data suggests Georgia has handled the pandemic poorly

Note: This post first appeared on the Caucasus Data Blog, a joint production of CRRC Georgia and OC Media. It was written by Givi Silagadze, a researcher at CRRC Georgia. The views expressed in this article are those of the author’s alone and do not in any way reflect the views of the CRRC Georgia, or any related entity.

Despite initial praise as a model case of handling the pandemic, Georgia is now seeing record numbers of COVID-19 cases and related deaths. Both health and economic data now suggests that the country has not fared well compared to its neighbours.

In early August 2021, Georgia was among the worst countries in the world in terms of COVID-19 case counts and deaths. Indeed, over the last week, over 1% of the adult population had COVID-19 at the same time.

At the start of the pandemic, headlines in international media praised Georgia as a, ‘Coronavirus success story’, and officials declared that they had ‘managed to stand ready to cope with the virus’. However, circumstances took a turn for the worse in the late autumn and the situation has not been assuring since. 

Despite the quickly deteriorating situation, government officials have been resistant to introducing measures aimed at preventing the spread of the virus. In July, public health officials said that their decisions and methods of tackling the pandemic had been successful. Moreover, polling from June 2021 suggests that 60% of the population is very satisfied (13%) or somewhat satisfied (47%) with the government’s response to COVID-19. 

But official health and economic data suggest Georgia has fared poorly compared to its neighbours, with the potential exception of performance on testing.

Health data

In the spring and summer of 2020, Georgia registered the lowest number of new, daily cases in its neighbourhood. However, by late autumn 2020, Georgia led the neighbourhood (and at times, the world) in new cases per capita. Throughout the summer of 2021, Georgia has performed worse than neighbouring countries.  


COVID-related deaths probably are the single most important indicator of how the country has handled the crisis. Georgia’s cumulative COVID-19 deaths per capita are the second-worst in the region, following Armenia.

Since late autumn 2020, Georgia has consistently fared the worst among its neighbours in COVID-19 deaths per capita. The exceptions in this regard are in the late spring of 2021 and a couple of weeks in July.

Georgia also lags behind its neighbours when it comes to vaccination, with only Armenia further behind. 

As of 10 August, at least 1 in 4 people were vaccinated with at least one dose in Azerbaijan and Russia, and 1 in 2 people in Turkey. Slightly more than 1 in 10 people received at least one dose in Georgia and fewer than 5% in Armenia.

While Georgia tends to lag behind its neighbours on many pandemic related indicators, Georgia is outperforming them on testing and tracking the virus in general. As of 9 August, 1,955 tests per thousand people have been conducted in Georgia since the beginning of the pandemic. 

The figure is significantly lower in neighbouring countries, especially in Armenia and Azerbaijan. However, this data might be misleading because Georgian officials decided to add antigen tests to the test count in December 2020, while Azerbaijan, Russia, and Turkey report only PCR tests (see here).

Moreover, Georgia registered the lowest number of excess deaths throughout 2020. 

In total, there were 333 excess deaths per 100,000 people throughout 2020 in Armenia, 190 excess deaths in Azerbaijan, 245 excess deaths in Russia, and 130 in Georgia (data was not available for Turkey). 

However, data is not available for 2021 and hence, cannot portray the full picture. 

Considering that in August 2021 Georgia tops the neighbourhood in terms of new cases as well as new deaths, it is likely that excess mortality figures have substantially deteriorated as of summer 2021. 

The fact that Armenia and Azerbaijan engaged in military conflict in autumn 2020 further complicates the task of drawing unequivocal conclusions regarding the countries’ efforts to track the virus.


Economic data

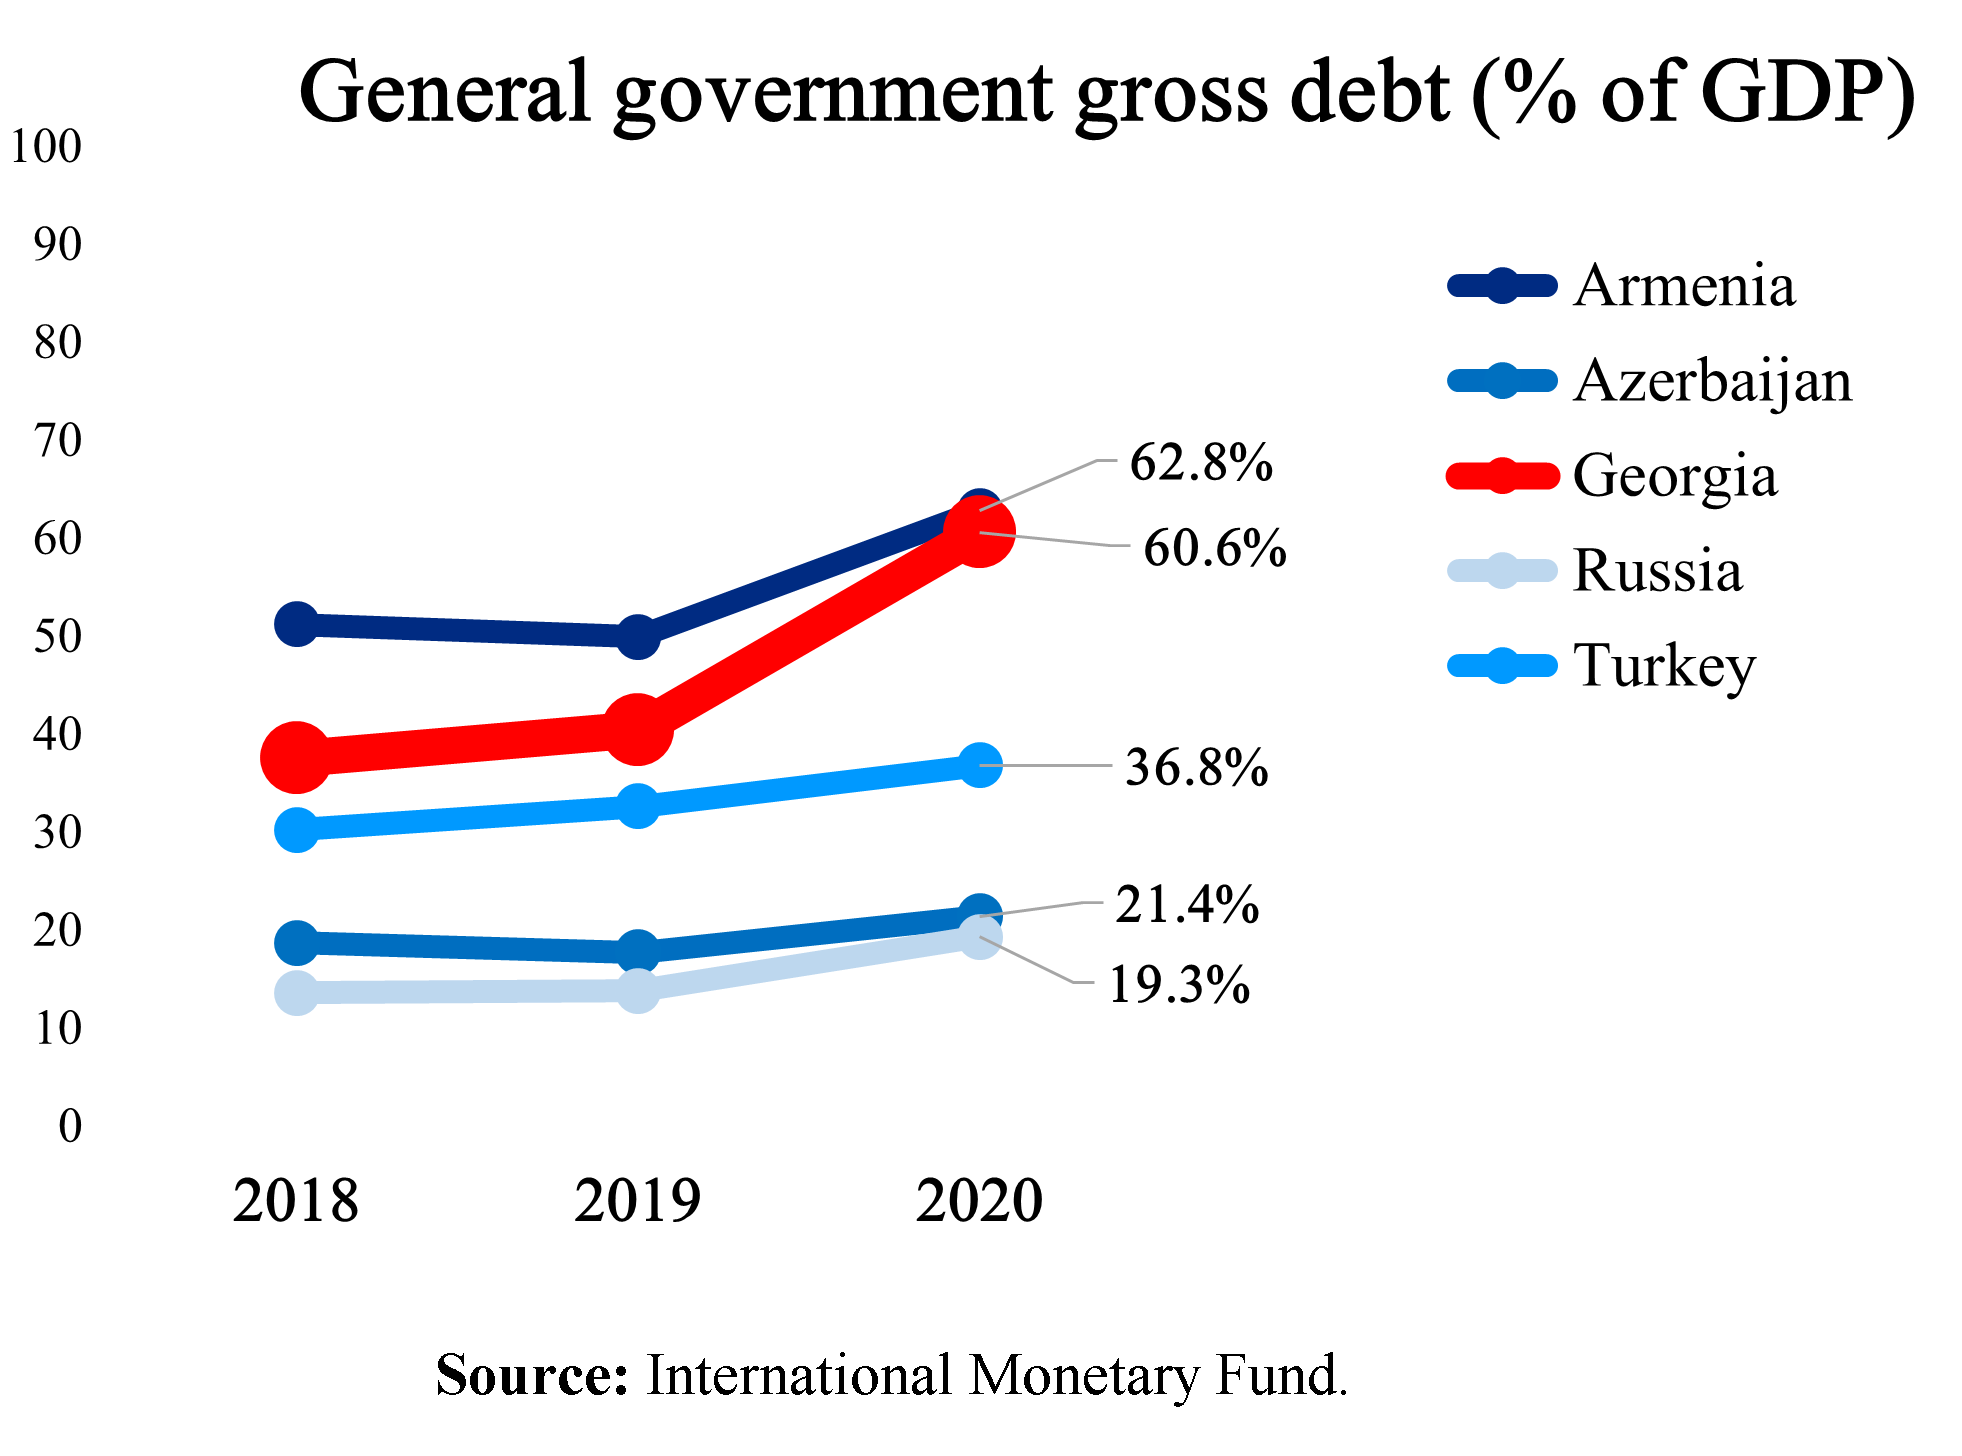
The economy of Georgia has also suffered. According to data from the World Bank and International Monetary Fund, Georgia had the second-highest inflation rate, the second-worst recession, and Georgia’s debt to GDP ratio is the second-largest in the neighbourhood.


Official data suggests Georgia has not done well in comparison to its neighbours in terms of managing the epidemic, with the exception of testing and tracking the virus, at least in 2020. 

Despite the initial success in containing the virus, since autumn 2020 Georgia has been the worst-hit country in the neighbourhood. 

That Georgia lags behind in terms of vaccination is perhaps the most concerning part of this. Vaccination is considered to be the only way to substantively reduce hospitalisation and fatality rates.

Had the economic figures looked encouraging, one could have argued that the country prioritised minimising economic hardship. Yet, if that was the case, the country failed, with the second-highest inflation rate and the second-worst economic recession in the region. What is more, among its neighbours, only Armenia has a larger debt ratio to its economy than Georgia.

Thursday, April 29, 2021

What were the greatest successes of Shevardnadze, the UNM, and Georgian Dream?

Note: This post first appeared on the Caucasus Data Blog, a joint effort of CRRC Georgia and OC Media. The article was written by Dustin Gilbreath, Deputy Research Director at CRRC Georgia. The views presented in the article do not represent the views of CRRC Georgia, the Carnegie Foundation, the Levan Mikeladze Foundation, the Government of Sweden, or any related entity.

Each government of Georgia has had a wide range of successes; but how do the public see these successes from Shevardnadze’s time to the present?

When Eduard Shevardnadze’s government is mentioned in Georgia today, it tends to be connected with the dark times Georgia experienced in the 1990s. Yet, his government also saw the introduction of the Georgian Lari, resulting in a stable exchange rate.  

The United National Movement is credited with fighting petty corruption, and oversaw a period of relatively high economic growth, while at the same time failing to avoid the disastrous 2008 war with Russia. 

The Georgian Dream government too is seen as having had some success, for example, in reducing the prison population, from what was among the highest in the world. At the same time, incidents like the Gavrilov Nights and issues around election integrity are often cited as failures. 

While outside observers frequently point to a wide variety of successes and failures, what does the Georgian public think? 

Newly released data from a CRRC Georgia survey conducted in partnership with the Levan Mikeladze Foundation and Carnegie Europe provides a picture of the public’s views of the largest successes and failures of government. 

This post looks at the successes, while another post also published today (available here) looks at the failures.

Who has something nice to say about Shevardnadze?

The data says relatively few people in Georgia have something nice to say about Shevardnadze: a third of the public reported they could not name a single success of his government. The second most common response was ‘don’t know’, suggesting less approbation than the previously noted response, but still a lack of a clear success coming to mind. 

The relatively high share of ‘don’t know’ responses may in part stem from a lack of memory of government during this time, particularly for younger respondents.

Among responses that were actual successes, gaining international recognition of Georgia’s independence (12%) and building the east-west energy corridor and related responses (5%) were the most commonly named options. Other responses were named by 3% or less of the public.


Note: The questions about the successes of each government in Georgia were asked as open questions, which interviewers selected a corresponding category for from a list of potential response options. If the respondent’s response did not match with any of the categories among those available, the response was coded as other and specified. These responses are quite diverse and available in the dataset, here.

The data indicates that ethnic Georgians, older people, people in Tbilisi, and working people were more likely to be able to name some success of Shevardnadze. 

Supporters of different political parties were no more or less likely to name a success. However, those who responded that they did not know which party was closest to their views were less able to name a success of Shevardnadze. This may signal less awareness of politics more generally, and in this sense is unsurprising. 

The data suggested there were no significant differences between wealthier and poorer households, the internally displaced and not, and people with different levels of educational achievement.


The public’s views of the UNM in power

The United National Movement Government received praise internationally for its anti-corruption measures, and the country’s economy grew at a rate of between 5%–12% annually outside of the 2008–2009 great recession. Given this, it is perhaps unsurprising that when asked what the largest successes of the government were from 2004–2012, a quarter of the public replied fighting crime/law and order (24%) and another quarter economic growth (23%). 

Improved public services, elimination of petty corruption, and Georgia growing closer to the EU and NATO were each named by 5% of the public, as was that the government had no successes.


There were relatively few differences between the perceptions of Georgian Dream and UNM supporters in terms of the UNM’s greatest achievements, with one exception. Opposition supporters were more likely to view the UNM’s greatest success as economic growth while, Georgian Dream supporters were more likely to report that the UNM had no successes.


Georgian Dream’s wins

While more people could name a success of the Georgian Dream than Shevardnadze’s government, a mix of uncertainty and thinking the government had no successes was common. 

When asked what the Georgian Dream government’s largest success was, the most common response was that the government had no success, named by 21% of the population. The next most common responses was don’t know (13%). 

Among actual successes, the public most frequently named improved human rights protections (11%), effective mitigation of the COVID-19 pandemic (9%), and introduction of the universal healthcare programme (9%). 

Visa-free travel to the EU (7%) and the implementation of the Hepatitis C programme (5%) were also commonly named.


Unsurprisingly, Georgian Dream supporters were more likely to name a success of the government, and opposition supporters were more likely to say they have had no successes. 

People who were not aligned with any political party were significantly more likely than Georgian Dream supporters, but less likely than opposition supporters, to say that the government has had no successes.  

Among Georgian Dream supporters, the protection of human rights was named more often than among other groups. 

According to the Georgian public, Shevardnadze’s largest success, among those who could name one, was gaining international recognition of Georgia. Yet, three times as many people report his government had no successes. 

For the UNM, the public remembers its anti-corruption efforts as well as the country’s economic growth during this period. 

For Georgian Dream, people have more difficulty naming a concrete success than with the UNM, though more people can name a success for Georgian Dream than for Shevardnadze. 

Views about the UNM and Georgian Dream were divided along partisan lines, with people in opposing camps less willing or able to name a success of the opposing party.

Note: The data analysis of who can name a success for Shevardnadze’s government presented in this article is based on regression models controlling for respondent age group (18-35, 36-55, 56+), employment situation (working or not), party support (Georgian Dream, Opposition party, no party/don’t know and refuse to answer), education level (secondary or less, vocational education, or tertiary education), sex (female or male), settlement type (capital, other urban, or rural), and IDP status (IDP or not). The data used in this article are available here.

The greatest failures from Shevardnadze to Georgian Dream

Note: This post first appeared on the Caucasus Data Blog, a joint effort of CRRC Georgia and OC Media. The article was written by Dustin Gilbreath, Deputy Research Director at CRRC Georgia. The views presented in the article do not represent the views of CRRC Georgia, the Carnegie Foundation, the Levan Mikeladze Foundation, the Government of Sweden, or any related entity.

While each Georgian government has had a range of successes, as described in another post published today, they have each had their own spectacular failures. 

From Shevardnadze’s failure to establish state power outside Tbilisi, to the human rights abuses under the UNM and Gavrilov’s Nights under Georgian Dream, every government has had significant shortcomings. 

While these are some of the most memorable, little research has been conducted on what the public thinks are the largest failings of each government. Data released on Tuesday from a CRRC Georgia survey conducted in partnership with the Levan Mikeladze Foundation and Carnegie Europe provides a picture of the public’s views of the largest successes and failures of government. 

This article looks at the failures, as well as political divisions over them for supporters of the opposition and Georgian Dream.

Shevardnadze’s failures

When it comes to Shevardnadze’s failures, the most common failure named, by 21% of the public, was the country’s economic collapse. One in nine (11%) consider his government’s largest failure to be not preventing the wars in Abkhazia and South Ossetia. 

Electricity shortages (9%), ineffective governance (7%), crime (6%), and the 1998 fighting in Gali (6%) were also commonly mentioned. Still, a fifth of the public (22%) were unable to think of a particular failure.

Note: The questions about the failures of each government in Georgia were asked as open questions, which interviewers selected a corresponding category for from a list of potential response options. If the respondent’s response did not match with any of the categories among those available, the response was coded as other and specified. These responses are quite diverse and available in the dataset, here.

The data suggests that people in rural areas, ethnic minorities, and younger people were less capable or willing to name a failure, controlling for other factors. Young people being less likely to name a failure may stem from young people not remembering the time Shevardnadze was in office. 

Low awareness among ethnic minorities likely stems from the fact that ethnic minorities tend to respond ‘don’t know’ more often than ethnic Georgians in general on surveys.


The UNM’s failures

When asked about the UNM, the public tended to say that human rights abuses (27%) and not preventing the 2008 August War (25%) were the government’s largest failures. 

Not listening to the public (8%) and crackdowns on protestors (6%) were both also named relatively commonly. 

Seven percent answered that the government had no failures.

Views of the UNM’s failures varied by party support. Supporters of the opposition were much more likely to think that the UNM government had no failures. 

In contrast, Georgian Dream supporters were significantly more likely to report that the violation of human rights was the UNM’s greatest failure. 


Georgian Dream’s failures

With regard to the failures of the Georgian Dream government, weak economic growth was most commonly mentioned, with a quarter of the public naming this issue. 

The next most common response was ‘don’t know’, with one in five not being able to provide a largest failure. 

Failure to deliver on pre-election promises (9%), Gavrilov’s nights (9%), and failure to accomplish the restoration of justice (8%) were also named somewhat commonly. One in twenty in Georgia believed at the time of the survey that the government had no failures.

While there was not a partisan difference in terms of whether or not people believed the Georgian Dream government had no failures, Georgian Dream supporters were less likely to report they knew which failure was largest. 

In contrast, slow economic growth was the most common response for non–Georgian Dream supporters. They were also more likely to name a failure to deliver on election promises more frequently. 


Shevardnadze’s largest failure was considered to be the economic collapse Georgia experienced during his governance. The United National Movement’s largest failure was considered to be human rights abuses, while the Georgian Dream’s was weak economic growth. 

With these failures, the opposing camps of Georgian Dream and opposition supporters tend towards differing interpretations of their party’s failures. 

Note: The data analysis presented in this article about Shevardnadze’s failures is based on regression models controlling for respondent age group (18-35, 36-55, 56+), employment situation (working or not), party support (Georgian Dream, Opposition party, no party/don’t know and refuse to answer), education level (secondary or less, vocational education, or tertiary education), sex (female or male), settlement type (capital, other urban, or rural), and IDP status (IDP or not). The data used in this article are available here.


Monday, March 11, 2019

Georgians support technical inspections of motor vehicles, even given the financial burden

[Note: This article was originally published on OC-Media. The text is also available in Georgian here. The article was written by David Sichinava, CRRC-Georgia’s Research Director, and Nino Mzhavanadze, a Junior Researcher at CRRC-Georgia. The views presented in the article do not necessarily represent the views of CRRC-Georgia, the National Democratic Institute, or any related entity.]


In 2018, the Government of Georgia decided to resume mandatory periodic technical inspection of vehicles, which was partially suspended in 2004. From January 2019, all cars are required to pass technical inspection. In 2018, heavier vehicles were required to do so. The change was spurred on by the Association Agreement with the European Union, under which Georgia took responsibility to resume inspections. More practically, the government also began inspections as Georgia’s private vehicle fleet has been recognized as the main source of air pollution in the country. A June 2018, CRRC/NDI survey finds people in Georgia overwhelmingly support the decision.

To learn whether potential costs associated with the reform such as repairing a vehicle to meet standards the technical inspections require would influence support for the reform, a survey experiment was carried out. Half of the sample (the control group) was asked, “In your opinion, is it necessary or not to have technical inspection of vehicles?” The other half (the treatment group) was asked, “In your opinion, is it necessary or not to have technical inspection of vehicles, as a result of which the car owners may be required to repair their vehicles or buy new ones?”

While these questions were randomly assigned, the share of the supporters of the reform does not differ between the two groups, which suggests that, overall, people’s support for the reform does not vary significantly when reminded of the additional costs that will be associated with the reform.
Clearly, car owners will be directly affected by the reform. However, people living in households that reported owning car(s) (41% of the population) feel enthusiastic about obligatory inspections of vehicles. Similar shares in both car-owning and non- car-owning households answered that technical inspections should be necessary.

People living in Tbilisi (96%) and urban settlements (92%) almost unanimously supported resumption of technical inspection, while residents of ethnic minority settlements were much more (62%) reluctant about the changes. There is no difference between respondents who have different perceptions of air quality. Interestingly, those who perceive the quality of air as completely satisfactory, are more likely to support the introduction of technical inspections if they are exposed to the treatment statement.

Opinions do differ along party lines, however. Those who reported the United National Movement (UNM) as the party closest to them were significantly less likely to report technical inspections were necessary (regardless of being in the treatment or control group).

There is a strong consensus among people in Georgia regarding the need for the newly introduced technical inspections for vehicles. People support the idea even when reminded of the costs associated with the reform. The survey also indicates that attitudes towards the reform significantly differ along party lines, hinting at the politicization of the issue.

The data used in this blog post is available here. Replication code is available here.

Monday, January 21, 2019

Budget priorities are similar to people's spending priorities

Georgia’s state budget amounted to GEL 12.5 billion in 2018.  The Ministry of Labor, Health and Social Affairs; Ministry of Regional Development and Infrastructure; and Ministry of Education and Science had the largest appropriations at 28.2% (GEL 3.528 billion), 14.5% (GEL 1.815 billion), and 9.5% (GEL 1.186 billion) of the budget, respectively. In the 2018 June CRRC/NDI survey, respondents were asked, “What are your top three priorities for spending, understanding it means cutting elsewhere?” Respondents were provided with a show card and allowed to name up to three answers. This blog post looks at whether responses match up with actual spending, and how priorities vary among different demographic groups.

Overall, healthcare was named most often, with 61% of the population reporting it was a priority, followed by education (55%) and pensions/social assistance (47%).  No other issues were named nearly as frequently, with support for SMEs and infrastructure being the next most commonly named issues (reported to be priorities by 12% of the public).

People’s views on budget priorities and the current state budget correspond to each other. Healthcare and pensions/social assistance (which are under the Ministry of Labor) and education had the largest share of the budget in 2018. Georgia’s population thinks that these spheres should be budget priorities.

While priorities generally match up with appropriations, who prioritizes different realms of spending? The data suggests that compared to young people (18-35) those who are over the age of 36 are more likely to name healthcare, perhaps unsurprisingly since healthcare spending generally increases with age. Women are also significantly more likely to report healthcare than men. Interestingly, ethnic minorities are less likely to name healthcare as a budget priority. These results are supported by a logistic regression analysis, which found each variable to be a significant predictor of mentioning healthcare.


About half the population (55%) report that education is one of their top three priorities. The data suggest people with tertiary education are more likely to name education as a priority for the state budget than people who have a lower level of education. Age also matters. People between the ages of 18-55 are more likely to name education as a top priority than those who are above 55. People who live in rural areas and ethnic minorities are less likely to name education as a top priority. A logistic regression analysis supports these results.


People 56 years old or more are more likely to name pensions and social assistance as a state budget priority than younger people. Compared to men, women tend to mention pensions and social assistance as a priority. People who think the economic situation is good in the country are less likely to name pensions and social assistance in their top three priorities for the budget. Interestingly, those who live in rural area are also less likely to mention pensions/social assistance as a budget priority.  These results are also supported by a logistic regression analysis.


The above data leads to two conclusions. First, the state budget largely matches up with people’s spending priorities. Second, priorities vary significantly between age groups, settlement types, sexes, and ethnicities.

To look into the data on the issue further, visit CRRC/NDI survey results and visit our Online Data Analysis portal.


Monday, January 14, 2019

Institutions need to replace personality

[This article was first published on OC-Media.]

A fair amount of scholarship indicates that (dis)trust in political institutions provides an indication of how well the institutions work. Hence, trust in political institutions is an important indicator for the functioning of a democratic government.

Following this line of logic, one would expect that trust in institutions reflects the public’s trust in who runs them. Caucasus Barometer (CB) data from 2011 to 2017 support this argument.

Overall, the data indicates that trust in political institutions has declined since 2011. None of the political institutions asked about on CB (the president, local government, executive government, parliament, and political parties) received as high a level of trust on the 2017 Caucasus Barometer as on the 2011 or 2012 waves of the survey.

While trust has declined overall, the relative levels of trust have largely been in sync with the changes of power in the country.

After Georgian Dream came to power in 2012, there was an increase in trust towards the executive government (from 39% to 48%) and parliament (from 37 to 44%), the two institutions that changed political leadership.

Trust in the president continued to decline from 58% in 2011 to 28% in 2012 and 23% in 2013. All of these surveys were done while Mikheil Saakashvili was still president.

Trust in the president grew in 2015, the first wave of CB after the 2013 presidential elections, which ended Mikheil Saakashvili’s presidency and brought Giorgi Margvelashvili to office.

Public trust in local government did not follow the same logic as executive government, parliament, and the presidency. Even though Georgian Dream won the 2014 local elections, trust in local government did not change between 2013 and 2015.

This could be due to the relatively weak public expectations of local government. Indeed, in 2013, only 4% of the public reported they had attended a local government meeting in the last year on a CRRC/TI survey. Besides low expectations, many local government officials had defected from the UNM to GD in the years since the change of power. Hence, it is not clear that the elections truly marked a change of power.

At the same time that trust in local government did not increase, trust towards executive authorities and the parliament declined as the popular glow surrounding Georgian Dream wore away. Trust towards the executive fell from 48 percent in 2012 to 26 percent in 2017. While 44 percent trusted parliament in 2012, trust fell to 22 percent in 2017. Meanwhile, trust in President Margvelashvili continued grow, which might be attributable to his de facto opposition to the ruling party, without defection to the UNM.

Trust in political parties has remained low and showed little change from year to year. It declined between 2011 and 2015, yet, trust in political parties does not appear to follow the electoral cycle as trust in institutions controlled by specific parties appears to.

Growing public mistrust toward political institutions in Georgia is a sign of weak state institutions in the country. Renewed optimism and trust in institutions appear to follow changes in political leadership, but without strong institution-building processes, optimism turns into disappointment.

While Georgian democracy has made consistent progress for the last three decades, transitioning from personality to policy driven politics remains a challenge for Georgia’s democratic consolidation.

This article was written by Kristina Vacharadze, Programs Director at CRRC-Georgia. The opinions expressed in the article do not represent the views of CRRC-Georgia or any related entity.

To explore the data further, visit our Online Data Analysis tool.


Monday, August 14, 2017

Who makes political decisions in Georgia: What people think

[Note: This post was written by Tsisana Khundadze, a Senior Researcher at CRRC-Georgia. The post was originally published here in partnership with On.ge. The views in the article do not necessarily reflect the views of CRRC-Georgia, the National Democratic Institute, or any related entity.]

Bidzina Ivanishvili resigned from the post of prime minister of Georgia on November 20th 2013, and in his own words, “left politics“. Speculation about his continued informal participation in the political decision-making process began even before he resigned and still continues. Some politicians think that Ivanishvili gives orders to the Georgian Dream party from behind-the-scenes, while others believe that he actually distanced himself from politics. Politicians, journalists and experts continue to discuss the situation. Meanwhile, a majority of Georgia’s population thinks that Bidzina Ivanishvili is still involved in the governing process and that his informal participation is unacceptable.

The results of CRRC-Georgia and NDI-Georgia surveys carried out during the last two years indicate that the majority of the population of Georgia thinks that former Prime Minister Bidzina Ivanishvili continues to be a decision-maker in the actions of the government. Notably, this is people’s perceptions and may not coincide with reality. In none of the main demographic groups (in terms of sex, age, level of education and settlement type) does the majority indicate otherwise. In total, 56% of the population would prefer that the former prime minister not be involved in the decision-making process at all. About one fourth of the population, on the other hand, thinks that Bidzina Ivanishvili should hold an official position and make political decisions. Only 7% would prefer Bidzina Ivanishvili’s informal involvement in Georgia’s governance.

People who say that the United National Movement is the party closest to them more frequently indicate that Bidzina Ivanishvili is still a decision-maker in politics, compared to Georgian Dream supporters. A majority (86%) of United National Movement supporters say that it is preferable if Bidzina Ivanishvili is not involved in decision making processes, while 43% of Georgian Dream supporters think that the former prime minister should be involved in these processes in an official capacity. It is noteworthy that the share of Georgian Dream supporters who prefer that Bidzina Ivanishvili participate in the political decision-making process in an official capacity decreased during the last two years.


Note: The question about party support was asked as follows: “Which party is closest to you?” People were grouped as supporters of the Georgian Dream or United National Movement based on their answers to this question.

These differences are not entirely unexpected considering the polarized political environment. Though, as we see, even among Georgian Dream supporters, only a small share prefers Bidzina Ivanishvili’s informal participation in political decision-making processes.

The data show that informal governance is unacceptable for the majority of the population of Georgia. No matter an individual’s sex, age, education, place of residence or political orientation, the majority of the population thinks that if a person resigns from politics, s/he should no longer influence the government’s decisions. These results indicate that basic principles of democratic governance, namely transparency of decision-making processes and accountability, are important for people. Politicians should take this into consideration.

Monday, August 07, 2017

Rare evidence: Judges on challenges in the court system of Georgia

Georgia has long faced problems with its court system. On CRRC’s 2015 Caucasus Barometer survey, only about one in four people in Georgia reported trusting the country’s court system. Since 2012, there have been three sets of judicial reforms, yet according to a number of NGOs, there are still important issues to be solved.
We often hear what NGO representatives think about the challenges facing the judiciary system in Georgia. It is, however, rare to have the chance to learn what judges think about the system. In partnership with the Coalition for an Independent and Transparent Judiciary, CRRC-Georgia interviewed 12 current and former judges in Tbilisi, Kutaisi and Zugdidi in October-December, 2016. Although 28 judges were sampled originally, others could not be contacted or refused to be interviewed. Importantly, the findings of these interviews cannot be generalized. Still, they provide rather unique insights into what judges think about the problems in the judicial system in Georgia. 
Respondents named several important issues that have a negative impact on the court system. First, judges have large caseloads that might affect the quality of decisions. Thus, more judges are needed to handle cases. Second, judges note a lack of courtrooms. Both problems result in trials being delayed. As one judge noted:
We have a shortage of staff, we need more judges. There are too many cases. We fail to handle them all. We lack judges, <…> so, this may affect the quality of [court] decisions. Trials take too long, because we simply don’t have [enough] courtrooms. (Current judge; male; Tbilisi City Court).
Importantly, both these issues have already been addressed in the draft version of the 2017-2021 Court System Strategy, which calls for an increase in the number of judges as well as courtrooms.
The interviewed judges also noted the lack of trust in the court system as another important issue. The respondents believe that it may be the judges themselves who are sometimes responsible for the lack of trust in the court system. In their opinion, if judges in Georgia consistently issued well-elaborated verdicts, the system would earn more trust, since such verdicts would help avoid any suspicion about the quality of the verdict, particularly from representatives of the party that has lost.  
Respondents also think that the media influences public opinion about the courts. Some of the respondents believe that the media prefers to cover problematic cases, especially when the court competence is to be questioned, rather than the cases when the court came up with a well-reasoned and convincing verdict. Generally, the interviewed judges are not against media coverage of the court proceedings and believe that such coverage increases the transparency of courts. However, some of them believe that journalists should be trained on how to use legal terminology properly.
In spite of the challenges associated with such interviews, it would be valuable to continue to collect these first-hand accounts of the court system from judges. The full report of this study is available here

Tuesday, April 25, 2017

How many Tetri are in a Lari? The importance of municipal statistics for good governance

[Note: This post was co-published with Eurasianet and authored by Koba Turmanidze, CRRC-Georgia's Director.] 

The government of Georgia committed itself to collect and publish policy-relevant data in a timely manner under the Open Government Partnership. Yet while most ministries and state agencies are happy to provide national-level statistics, they often fail to break them down to the municipal level. 

As a result, if you think about it in monetary terms, the current system means that officials do not know how many tetri are in a lari. 

Reliable municipal statistics can contribute to good governance in several important ways. First, municipal-level data can let citizens assess the quality of state services they receive compared to other municipalities, or to the national average. Second, municipal-level data can help policy makers improve the targeting of programs, and therefore, spend public money more efficiently. Third, it can help both government and citizens evaluate the successes and failures of municipal governance.

The following scenarios highlight the benefits of comprehensive data on a local level: 

Imagine you want to move from one town to another for a better job. You consider moving with your spouse and a child of school age. However, your spouse does not want to move, arguing that your town has much better public schools than the new one. In such cases, it would help if you could look at municipal-level education data to see if schools in the two towns are similar or different in terms of the student-teacher ratio, exam scores, the success rate on national examinations, etc. 

Imagine you are a civil servant and are working with an investor to build a new factory in a municipality. You want the factory to be built in the municipality where its social impact will be highest. To persuade the investor, you use municipal statistics to demonstrate that the municipality of your choice has high unemployment, yet its labor force is younger and better trained than in comparable municipalities. 

Imagine you are an analyst in a think tank and your task is to advise the government on whether to extend a poverty reduction program or not. The government claims the program helped to reduce poverty by two percentage points nationwide, but you have reasons to suspect that the reduction happened in certain settlements, whereas in others the program had a negligible impact. You look at relevant data on the program and poverty statistics, and conclude that the program’s effect across municipalities was truly unequal. Importantly, it made no difference in the most economically deprived communities. Therefore, you advise the government to redesign the program to improve its impact on the communities with the highest poverty rates, before pouring more money into it. 

Unfortunately, we can only imagine the above. These three scenarios remain purely hypothetical, since, in Georgia, reliable municipal data is rarely available on education, employment and poverty. 

CRRC-Georgia’s repeated interactions with a multitude of state agencies over the past three years have uncovered at least three problems regarding municipal data. First, when municipal data of potentially good quality exists, it is often not processed and made available to the public. Second, if municipal data is accessible, its quality is often questionable. Third, municipal data often does not exist at all, since the responsible agency does not recognize its value, or is unable to collect it due to lack of relevant training. 

Below are three concrete cases that correspond to these three problems: 

Case 1: Until recently, the National Assessment and Examination Center (NAEC) maintained detailed and high-quality data on the results of the Unified National Exams (UNE) for many years. The data allowed one to see which municipality’s and even school’s students were most successful in the exams. Such data was not proactively shared on the Center’s website, but was available upon request. The situation changed when the Center introduced electronic applicant registration in 2011. Under the new system, an applicant’s place of residence and school was no longer recorded. However, the Center could still identify the municipality based on an applicant’s ID number. 

For the 2015 UNE results, NAEC processed the data this way and made the data file available on its website. However, when CRRC-Georgia requested the same data for 2016, the Center turned the request down, arguing it no longer processed data per municipality, and would not do so for our sake. As a result, it is no longer possible to analyze municipal- or school-level performance and map it as we did in this blog post. At the time, this map drew attention to large differences in educational attainment countrywide, including an important fact – that Unified National Exam scores in Upper Ajara were among the worst in the country. In part in response to this fact, AGL, a Norwegian company building a hydro-electric dam in upper Ajara created a tutoring program for students in the region to help them prepare for the exams. If the NAEC withholds such data, it will hinder the ability of interested parties to spot trends and develop remedial policies.

Case 2: The Social Service Agency (SSA) is a leading organization in the country in terms of providing access to comprehensive data on poverty and targeted social assistance at the national and municipal levels. Among other statistics, the Agency reports monthly data on applicants and recipients of social aid. The 2014 census data, however, casts some doubt on whether the SSA poverty statistics are trustworthy. 

The scale of mismatch between the agency’s data and the 2014 census results is evident from the chart below. Using Geostat’s population estimates, the agency calculates the share of the population registered for targeted social assistance in each municipality. The census was conducted in November 2014, so it is possible to re-calculate the share of those registered for targeted social assistance based on the census data and compare it with the agency’s estimates. 

Let’s take the extreme case of Lentekhi. The agency reported that 44 percent of the population applied for targeted social assistance. When the census data is used, the finding is that 89 percent of Lentekhi residents registered for social assistance. Thus, the SSA estimate was 45 percentage points lower than the actual percentage. The chart below plots the differences between the shares of the population registered for targeted social assistance, as calculated and reported by the SSA on the one hand, and updated calculations based on the 2014 census data on the other, for each municipality in November 2014. Overall, the agency underestimated the share of applicants by 14 percentage points, on average. However, publicly available data has yet to be adjusted based on the 2014 census.    


Case 3: In a number of cases municipal statistics do not exist. Measuring the scale of economic activity (level of employment by employment sector, total value added, etc.) in every municipality would require large-scale surveys that are both time-consuming and expensive. Geostat’s periodic Integrated Household Survey cannot provide this information, due to the cost that such a large sample size would entail. 

However, the Revenue Service (RS) under the Ministry of Finance of Georgia could help solve this challenge. Based on taxpayers’ IDs, the agency can provide information about the number of taxpayers, be it individuals or organizations, and amount of taxes collected in each municipality. This information would serve as a good proxy of economic activity by municipality. However, as the RS told CRRC-Georgia, it can only break the data down for regions. Officials claimed that breaking the data down further was not possible. 

Undoubtedly, the collection and analysis of municipal data requires additional resources. However, the three concrete cases highlighted above show that a little increase in awareness regarding municipal data could go a long way toward promoting better municipal governance in important ways. Investors could have clearer insight into the best investment destinations, for one. Civil society groups would also have better ways to assess the successes and failures of government actions. Citizens likewise would have a better idea of where their place of residence stands compared to other parts of the country, or the national average. Government could have better tools to ensure equal access to services in the country, or to achieve efficiencies in the provision of services. 

All of this is possible. Unfortunately, it is not reality. And as a result, the government doesn’t know how many tetri are in a lari.


Tuesday, April 18, 2017

Why the civil service? The civil service as seen by civil servants in Georgia

The civil service plays an important role in the development of a country. Thus the competence and motivation of civil servants matter. An online survey of civil servants conducted by CRRC-Georgia for NATO-PDP in December 2015 – January 2016 was one of the first attempts in Georgia to study civil servants’ perceptions of and attitudes towards their job. This blog post provides a brief overview of some of the findings, focusing on reported reasons for choosing to work in the civil service, the advantages and problems civil servants see with their jobs, as well as general assessments of civil servants’ motivation to work.

Slightly over a half of civil servants (56%) reported that the main reason they chose their job was an interest in working in the public sector. Forty-five percent hoped to improve their professional skills. The third most frequently named reason was a hope to improve the situation in their field. Importantly, a rather small share of civil servants (18%) reported a “stable job” as a reason for choosing to work in the civil service, and only 2% named an “attractive salary”.


About half of civil servants named the opportunity to contribute to the development of the country as the main advantage of working in the civil service. The opportunity to acquire new professional skills was the second most frequent answer, while the opportunity to make new connections, work one’s way up within the organization, and work with competent colleagues were named rarely.


Civil servants most frequently assessed the motivation to work of those in the civil service as average (50%). Positive assessments, though, are much more frequent than negative ones (36% vs 15%).

Note: To a certain extent, in response to most of the questions in this survey, civil servants tended to pick answers that can be considered socially desirable. Hence, social desirability bias is likely to have affected other responses as well, including assessments of other civil servants’ motivation to work. In order to avoid this bias in the case of this question, a very general wording was used: “How would you assess civil servants’ motivation to work?” This question measures civil servants’ reported perceptions of their colleagues’ motivation. To a certain extent, social desirability bias likely still influenced responses. However, this influence should be less than if the question had been asked about the respondent herself. 

Should the 50% of “average” assessments be considered a problem? Probably. The state invests financial resources in the improvement of civil servants’ professional skills, and the country, overall, is interested in a high productivity of their work. Undoubtedly, motivation encourages productivity. Thus, higher motivation will also lead to a more efficient use of public resources.

While trying to increase civil servants’ motivation in Georgia, it is important to consider the problems they face. The most frequently named problem is a lack of professionally competent civil servants. A fear of losing one’s job and poor infrastructure come in second and third, followed by a fair number of other problems.


Addressing these problems may improve civil servants’ motivation to work. As a result, the country would benefit from higher productivity among civil servants.

Monday, February 06, 2017

The state procurement system in Georgia: Companies’ views (Part 2)

The first part of this blog post presented findings about Georgian companies’ participation in the state procurement system. This post provides an overview of companies representatives’ assessments of the state procurement system and how these assessments differ depending upon the company’s participation or non-participation in the state procurement process.

Company representatives report that their main sources of information about state procurement include the websites of procuring state entities (17%) and the State Procurement Agency’s Unified Electronic System (16%). However, representatives of companies that do not participate in state procurement report that they do not or cannot get information about the state entities’ procurement tenders.


Note: The number of answer options was not limited during the interviews.

Most companies (60%) report trusting the State Procurement Agency, with only a small share (8%) saying they do not trust it. At the same time, almost a third of companies (30%) say they don’t know whether they trust the Agency or not. Notably, representatives of companies which have never bid on state procurement tenders answer “don’t know” more frequently than representatives of companies that have. Moreover, representatives of the companies which have participated in the state procurement process at least once report trusting the Agency more often than the non-participating companies. This result likely indicates that the participating companies’ experiences working with the State Procurement Agency were positive.


Responses to the question, “How much do you agree or disagree that companies which have connections with the government win tenders?” also vary based on whether companies have experience participating in the state procurement system. Representatives of companies that have such experience disagree with this statement more often. Moreover, representatives of companies which have not participated in the state procurement system respond “don’t know” twice as often as participating companies.


Around one third (36%) of the companies that have participated in state procurement think that tenders are often “tailored” to one specific company and the goal is to ensure that this particular company wins. However, almost half (48%) of the participating companies do not agree with this statement. While 27% of the companies which have participated in the state procurement system agree with the statement that tenders may be repeatedly rejected by the procuring side with the aim of awarding the contract to a particular company through simplified tender, almost half disagree with this statement.


Note: This question was asked to the representatives of the 17% of companies that have participated in the state procurement system.  

As the findings presented in this blog post show, representatives of companies that have participated in the state procurement system at least once assess the State Procurement Agency’s work more positively. Most of them trust the Agency and believe that there is no need to have connections with the government to win tenders. Most representatives of companies that have not participated in the state procurement system have difficulty stating their opinion on these issues. The findings presented in this blog post indicate that the State Procurement Agency should do more to raise awareness among companies about the state procurement system.

To explore this topic more, take a look at CRRC-Georgia’s report Survey of companies on state procurement. 


Friday, January 27, 2017

The state procurement system in Georgia: Companies’ views (Part 1)

The Unified Electronic System for State Procurement was introduced in Georgia in 2010. The system aimed to simplify the state procurement process and make it transparent. According to the State Procurement Agency, “Every year, the state spends hundreds of millions of lari on procurement of different kinds of goods, services and construction. … Accordingly, private companies ought to be interested in state procurement as an important potential source of increasing their incomes.” However, according to the findings of a Survey of companies on the state procurement system conducted by CRRC-Georgia for Deloitte Consulting LLP and USAID in August 2016, a majority of companies do not actively participate in the state procurement process. Based on CRRC-Georgia’s report on the subject, this blog post discusses problems with the system in the companies’ views.

According to the State Procurement Agency’s 2015 annual report, 15.6% of active companies have bid on state procurement tenders (pg.17). On CRRC-Georgia’s survey 17% of companies report taking part in the state procurement process, and approximately half of these companies report doing so only sometimes or rarely. Seventy-three percent of companies report not being registered in the Unified Electronic System for State Procurement (UES), which is a requirement for bidding on state procurement tenders.


Note: 2% of companies, whose representatives answered “Don’t know” to the question: “Is your company registered in Unified Electronic System for State Procurement?” were excluded from the analysis. 

The results of the survey provide some insight about why companies do not participate in state procurement. Most frequently (56%), a lack of interest in participating in the state procurement process was mentioned as the main reason for not participating. We do not, however, have any information about why there is a lack of interest. The second most common reason company representatives mentioned for not participating was that the tenders announced are not applicable to the company’s field of activity (27%).


Note: Only answers of the representatives of companies that are not registered in the Unified Electronic System for State Procurement (73%) are presented in the chart above. 

A majority of companies (64%) report having no information about the announcement of state procurement tenders. Given this general lack of information, it is not surprising that their representatives found it difficult to assess how fairly different types of tenders are conducted. Notably, representatives of 76% of the companies report they have not heard about seminars which the State Procurement Agency conducts with the aim of increasing the knowledge of business people about the state procurement system.


Note: The chart shows distribution of answers of the 83% of companies that have not participated in state procurement system. Companies whose representatives answered “Refuse to answer” to the question are excluded from analysis. There are five types of state procurement tenders in Georgia: simplified procurement, simplified electronic tender, electronic tender, consolidated tender and contest. Definitions of each type of tender are available here.

It is possible that the lack of information is an obstacle to greater participation in state procurement processes. Thus, the State Procurement Agency should better inform companies about its activities.

The second part of this blog post, which will be published next Monday, shows how representatives of companies assess the state procurement system based on whether they have or have not participated in the state procurement system.

Monday, August 08, 2016

Trends in the Data: Public support for democracy is slowly waning in Georgia (Part 2)

Analysis of survey findings from the last few years, presented in the first part of this blog post, shows that public support for democracy is declining in Georgia. Since 2012, the share of the population who would prefer democracy over any other kind of government dropped from 68% to 47%. As public support for democracy is indispensable to democratic consolidation, it is important to know how and why support for democracy is changing. This blog post describes a number of tendencies that might be related to the declining public support for democracy in Georgia, using the CRRC’s Caucasus Barometer (CB) survey data.

One reason for the declining support for democracy may be related to the worsening of the public’s assessment of domestic political developments in the country. Specifically, while nearly half the population agreed with the statement that “[domestic] politics is going in the right direction” in 2011-12, only 15% did so in 2015. On the other hand, the share of the population that agreed with the statement that “[domestic] politics is going in the wrong direction” quintupled between 2012 and 2015. The share of those who agreed with the statement that “[domestic] politics does not change at all” also increased.


Note: A show card was used for this question. Answer options "Politics is definitely going in the wrong direction" and "Politics is going mainly in the wrong direction" were combined into ‘[Domestic] politics is going in the wrong direction’ on the chart above. Answer options "Politics is going mainly in the right direction" and "Politics is definitely going in the right direction" were combined into ‘[Domestic] politics is going the right direction’. “[Domestic] politics does not change at all” was not recoded. Options ‘Don’t know’ and ‘Refuse to answer’ are not shown on the above chart. CB was not carried out in 2014.

Worsening assessments of domestic political developments might also be related to an increased perception that the government treats people unfairly. The share of those who did not agree with the statement that “people like yourself are treated fairly by the [present] government” more than doubled between 2013 and 2015.

Note: Answer options "Completely agree" and "Somewhat agree" were combined into ‘Agree,’ and options "Somewhat disagree" and "Completely disagree" were combined into ‘Disagree’.

Declining trust towards important political institutions such as parliament, executive government, the president, local government and the court system, also discussed in a recent blog post, might be considered a logical continuation of the tendencies mentioned above. For instance, since 2011 the shares of those who said that they trusted executive government, parliament and local government nearly halved, while the shares of those who report distrusting these institutions increased. Although trust towards the president and court system increased in 2015 compared with 2013, it is still lower than in 2011. This is a serious problem, because trust in political institutions is crucial for the maintenance and consolidation of democracy.


Note: Answer options "Fully trust" and "Rather trust" were combined into ‘Trust’, and options "Rather distrust" and "Fully distrust" were combined into ‘Distrust’. Options “Neither trust nor distrust”, ”Don’t know” and ”Refuse to answer” are not shown on the chart.


Trust in political institutions not only can strengthen democracy, but can also make governance more effective and cost-efficient. Declining trust towards major political institutions could impede Georgia’s stable development. Thus, it is of high importance to regularly monitor changes and analyze their causes. Since the causes of social change are usually complex, further, more focused research is needed on the issues highlighted in this blog post, with the eventual goal of improving the performance of major political institutions, leading to the population’s increased trust in these institutions. 

As the first part of this blog post showed, although the share of the population who supports democratic governance in Georgia declined by a third in recent years, reported support for democratic values strengthened. These findings, taken together, suggest that declining public support for democracy is unlikely to be caused by the weakening of democratic values. Thus, the causes for the decline likely lay elsewhere. The findings presented in this and in the first part of this blog post also suggest that the population’s knowledge and understanding of what democracy means are different from the predominant conception of liberal democracy. Therefore, increasing public awareness of democracy will be important for its consolidation in Georgia. 

This blog post has shown that fewer people report that domestic politics in Georgia is going in the right direction and that more people report the government treats people unfairly. Not surprisingly, trust in political institutions also declined. Taken together, these findings suggest that declining public support for democracy may be related to the public’s worsening assessments of the development of the country’s domestic political situation over the course of the past few years.

To find out more about public opinion in Georgia, visit CRRC’s online data analysis tool.