Showing posts with label Monetary income. Show all posts

Tuesday, March 21, 2023

People in Georgia are highly uncertain about their economic future

Note: This article first appeared on the Caucasus Data Blog, a joint effort of CRRC Georgia and OC Media. It was written by Nino Zubashvili, a Researcher at CRRC-Georgia, The views presented in the article are of the author alone, and do not necessarily reflect the views of CRRC-Georgia, or any related entity.

Across various demographic groups, Georgians are uncertain about what their economic futures might hold, with those from lower-income backgrounds more uncertain than those with a higher income.

Georgia today faces numerous structural challenges that hinder social and economic development, such as low productivity and low-quality jobs, poor quality of education, poor links between education and employment, high unemployment, and poverty. 

On top of this, high use of the dollar alongside the country’s own currency, and reliance on income from tourism make the country vulnerable to external shocks. 

Despite some positive developments, including becoming an upper middle income country in 2016, a ‘very high’ rating on the Human Development Index, and a low average multidimensional poverty score (37%), public opinion polling has found that the public is highly uncertain about their economic prospects. 

CRRC Georgia’s Caucasus Barometer 2021 data shows that while a plurality of the population feel they are part of the middle class, almost half are uncertain about their households’ future economic well-being. 

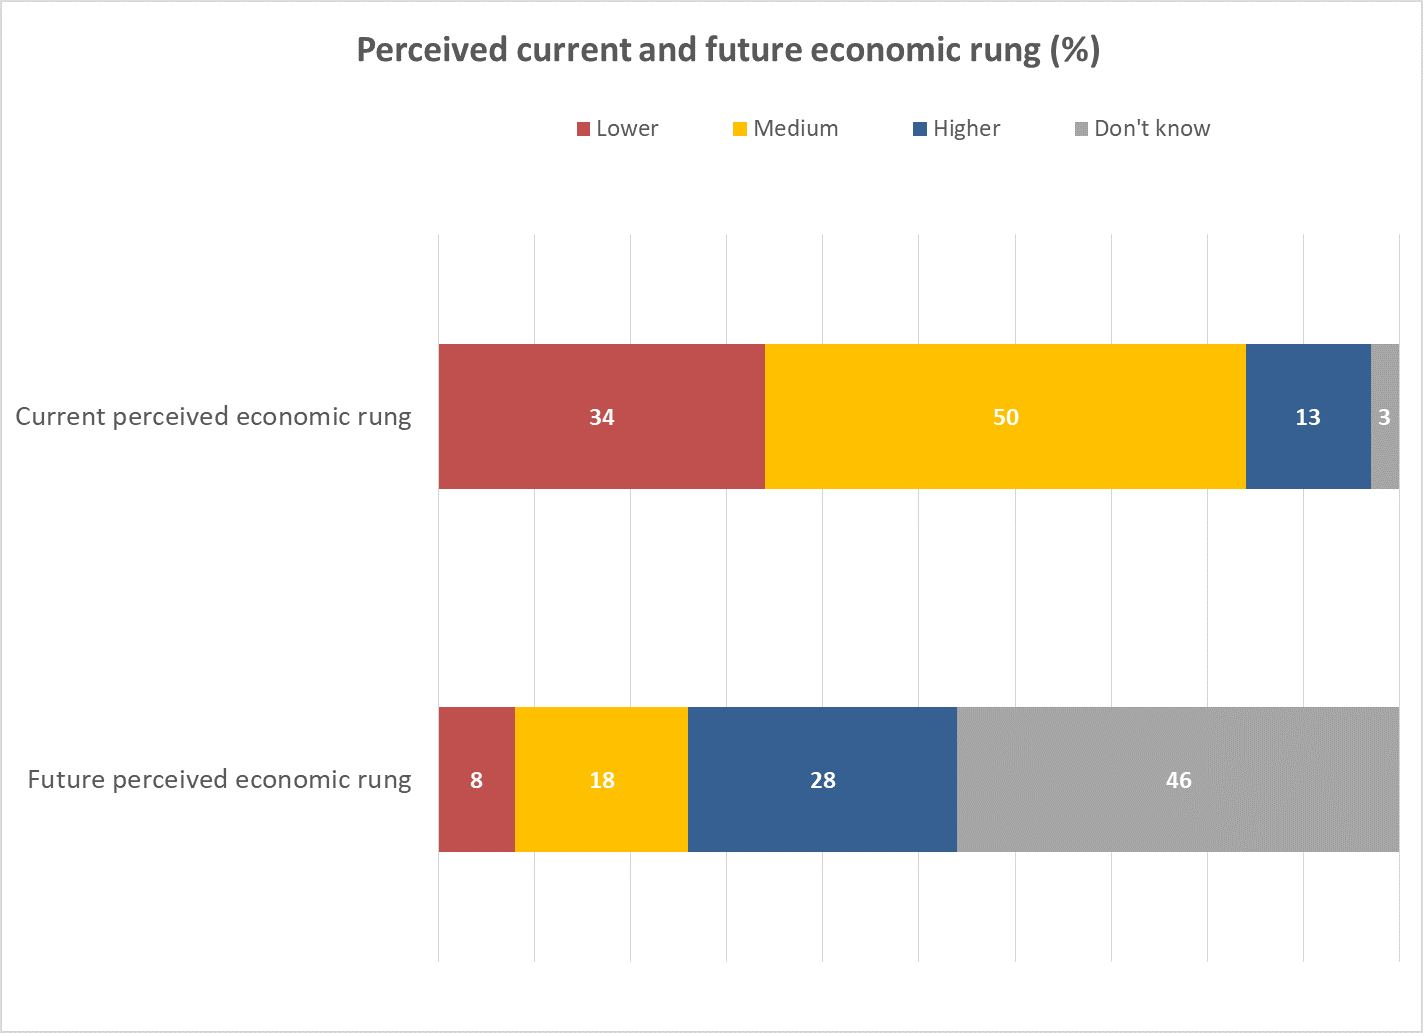
Half (50%) of Georgia’s population perceive their current economic status as in the middle, 34% as poor, and only 13% as high. 

When asked what they expect their economic status to be five years in the future,  8% of the population see themselves on the lower rungs of the economic ladder, with 18% seeing themselves in the middle class. Notably, 28% believe they will be relatively well off, twice as many as currently see themselves in that category.

But uncertainty about the future is substantial. Almost half of the public (46%) answered that they didn’t know what their household’s economic status would be in five years. 
Numerous factors are associated with how people in Georgia perceive their future economic rung. 

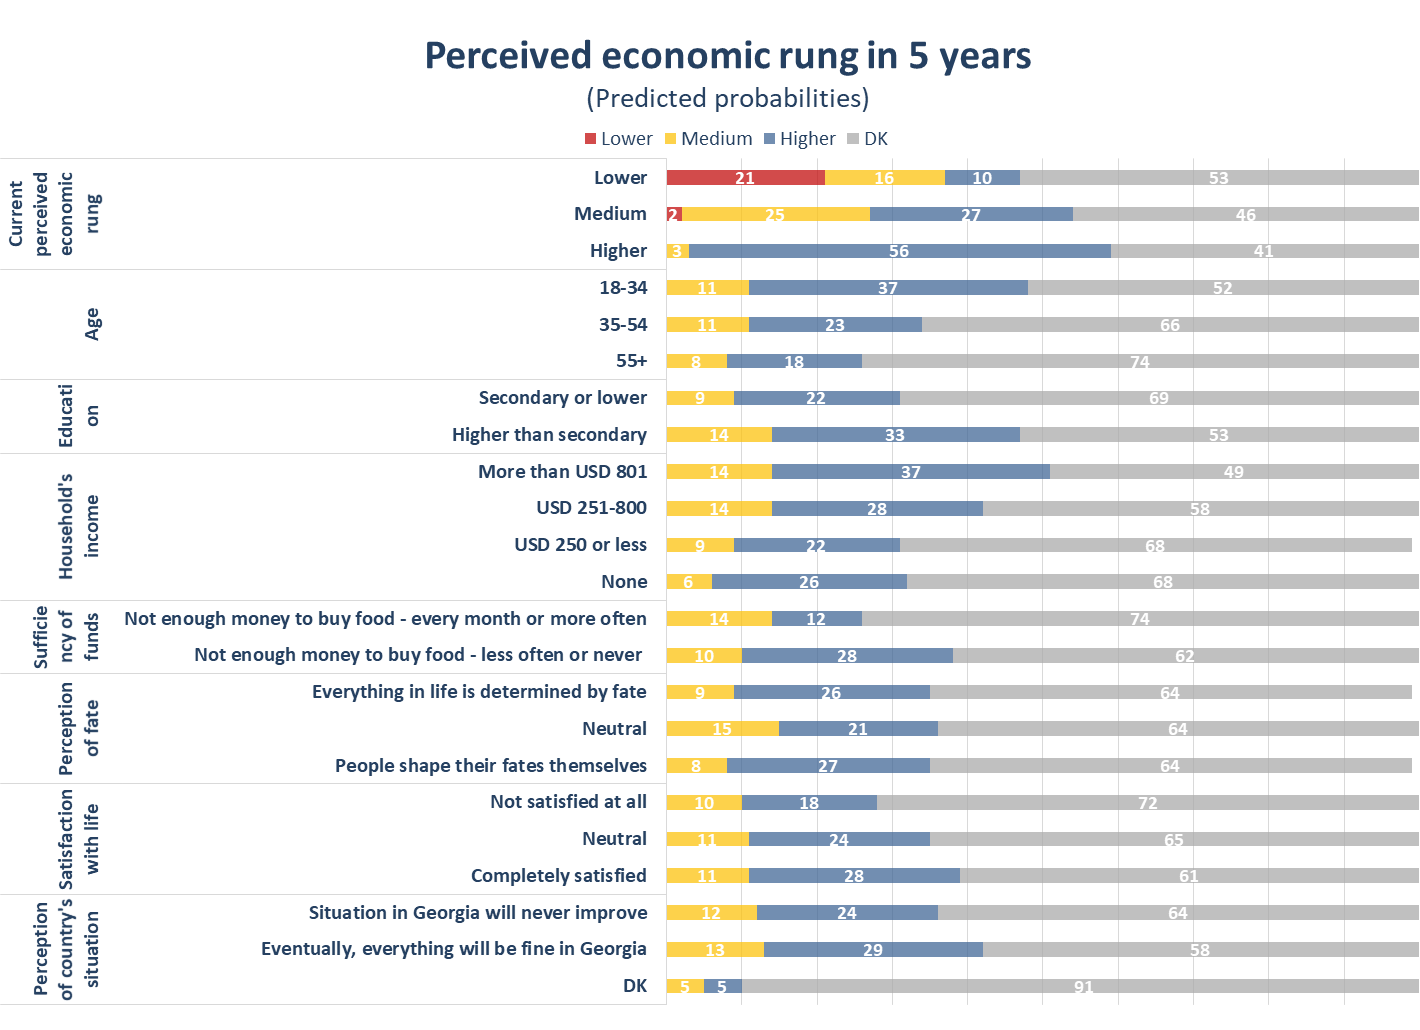
More than half of those who perceive themselves to be on the lowest rungs of the economic ladder are uncertain about the future. A fifth on the lower rungs expect to stay there, and around a fifth expect to move to the middle of the ladder. Few on the lowest rungs today expect to move to a relatively well-off rung. 

In contrast, wealthier people, as measured along a wide range of variables, tend to expect a better future for themselves. People who perceive themselves to be relatively well-off have less uncertainty about their economic futures, and expect to continue to be relatively well-off. 

Similar patterns are present for people and households with higher measured incomes, and who do not struggle to buy food.

In terms of age, younger Georgians (aged 18-34) have higher expectations for a better economic future and less uncertainty compared to other age groups. With age, expectations for a better economic future decrease, and uncertainty increases. 

Economic expectations are also notably higher and uncertainty notably lower among those with a higher education, compared to those with a lower level of education.

Personal beliefs and perceptions of the country’s future are also associated with a household’s perceived future economic rung. Those who believe that ‘the situation in Georgia will never improve’ are slightly less likely to expect improvements in the economic situation compared to those who believe that everything will be fine in Georgia. 

Finally, it is perhaps unsurprising that people who are currently more satisfied with life are also more likely to have positive expectations for their economic futures. 
Gender, ethnicity, settlement type, employment, religious denomination, frequency of attendance at religious services, whether or not someone has enough money to buy durable goods or not, ownership of durable goods, party affiliation, whether people think everything in life is determined by fate or not, and generalised trust were not associated with what people think their household’s economic future holds.

The largest share of people in almost every socio-demographic group in Georgia are uncertain about their economic futures, regardless of their level of education, perceptions of fate, or perspective on Georgia’s politics. 

Note: The data used in the article can be found on CRRC’s online data analysis tool.

The analysis was carried out using logistic regression. The regression included the following social and demographic variables in all cases: sex (male or female), age group (18–35, 35–55, 55+), ethnic group (ethnic Georgian or other ethnicity), settlement type (capital, other urban, rural), educational attainment (secondary or lower education, or higher education), employment situation (working or not), party support (GD, opposition, no party, DK/RA), current perceived economic rung (low, medium, high), religious denomination (Orthodox Christian, other, none), frequency of attendance to religious services (frequently, sometimes, rarely, never). Household’s economic well-being measurements included household’s income, household’s purchasing power (Money not enough for durables, money enough for durables and more), sufficiency of household’s income (Not enough money to buy food every month or more often, not enough money to buy food less often or never), ownership of durable goods. Attitudinal variables tested as part of the analysis included, whether or not one believes in fate, generalized trust, satisfaction with life, whether politics in Georgia is going in the right or wrong direction, whether the situation in Georgia will improve. Both attitudinal variables and measures of households’ economic well-being were tested independently in separate regression analyses that controlled for the previously mentioned social and demographic variables.

Friday, September 27, 2019

The gender gap in expected wages in Georgia exists only among the well off

[Note: This blog post was originally published in partnership with OC Media, here.]

Much has been made of the gender pay gap in Georgia. A related but different economic indicator is the reserve price of labor i.e. the wage which someone wants before they would consider accepting a job. The July 2019 CRRC and NDI survey suggests a gendered gap in the reserve price of labor as well: women want significantly less than men to start working on average. However, further analysis suggests that the gap only exists among the relatively well-off and not among poorer households.

On the survey, respondents that did not consider themselves employed were asked, “Considering your education and skills, what is the minimum salary you would agree to work for?” Eight percent of respondents asked the question refused to answer and 16% reported they did not know. Among those that did know how much they would want to start a job, the average was GEL 719.  For men, the average was GEL 823 while for women, it was GEL 643 – GEL 180 less. Women’s lower reserve prices appear to stem from the larger share of women who report they would be willing to start working for GEL 500 a month (33%) compared with men (22%).

Further analysis of this question suggests that sex remains a significant predictor of the minimum salary someone would be willing to start working for, controlling for education level, settlement type, household wealth (proxied through the number of assets they own), age, and the presence of children in the household. Aside from sex, household wealth has a statistically significant association with the salary people want to start working.  In Tbilisi and other urban areas, salary expectations are also higher than in rural settlements. Among the oldest age cohort in the survey (56+), expectations were lower.

However, after controlling for the interaction between sex and other variables rather than sex in and of itself, the data suggests that the interaction between a household’s wealth and sex is the key gender related factor when it comes to the reserve price of labor. There is no significant difference between the sexes in the reserve price of labor in poorer households. However, as wealth increases, men’s reserve price of labor increases at nearly twice the rate as it does for women: for every additional asset that a household owns, men want GEL 80 more to start working on average, compared to GEL 44 for women.

Rather than wanting more money to start working than men, women have lower reserve prices overall. While women want less to start working, this is only the case when women are in relatively better off households. In poorer households men and women that are not working are willing to start work at statistically indistinguishable wages.

Note: This blog post is based on two ordinary least squares regression analysis. The first controls for sex, age group, education level, household wealth (number of assets owned, from 11 asked about), settlement type (Tbilisi, Urban, Rural), and whether or not there is children in the household as independent variables. The dependent variable is the salary someone would want in order to start working. The second regression analysis looks at the interaction between all of the previously noted variables with sex. The data used in the above analysis is available here. The replication code can be found here.

This piece was written by Dustin Gilbreath, the Deputy Research Director of CRRC-Georgia. The views presented in this article do not necessarily represent the views of CRRC-Georgia. The views presented in this article do not represent the views of the National Democratic Institute or any related entity.

Monday, June 12, 2017

Most households in Georgia report limiting food consumption, despite economic growth

According to the World Bank, GDP in Georgia increased from USD 10.1 billion to USD 13.9 billion between 2009 and 2015. Despite this growth, according to CRRC’s Caucasus Barometer survey (CB), the share of those who reported not having enough money to buy food on at least a weekly basis did not decrease between 2011 and 2015. This blog post shows how this finding differs by settlement type and reported household income.

As the chart below shows, the general picture did not change between 2011 and 2015. Only about one third of the population claims it never happened during the 12 month prior to the survey that they did not have enough money to buy food they or their family needed. More than one third report encountering such difficulties periodically and about a quarter monthly or more often.


Note: Answer options “Every day” and “Every week” have been combined for the charts in this blog post.

Taking into account the margin of error, the share of people who reported not having enough money to buy food every week or more often is approximately the same in different settlement types. Importantly, the most common response in Tbilisi and the second most common response in other urban settlements is “Never”. This answer is, however, reported by less than half of the population of these settlement types.

Note: Answer options “Don’t know” and “Refuse to answer” were excluded from the analysis.
                       
A lack of money for food logically suggests a low income. The chart below shows that the higher the reported household income, the higher the share of the population reporting never being in a situation when they did not have enough money for food. According to CB 2015, 61% of the population reported their household income was less than USD 250 the month prior to the survey.


CB data show that a large share of households in Georgia have financial difficulties supporting their families’ primary needs and a majority struggle with not having enough money for food at least some of the time.

To have a closer look at the Caucasus Barometer data, visit CRRC’s Online Data Analysis tool.

Monday, May 15, 2017

Debts and Loans in Georgia (Part 2)

The first part of this blog post showed that people who report being in a worse economic situation are more likely to have debts in Georgia. In the second part of this blog post, a new variable is added to the analysis, “Does anyone owe you any money?”

While 46% of the population of Georgia report having debt, only 20% report that someone owes them money. In the latter, group, there are no differences by gender and settlement type, but there are differences by age. People between 36 and 55 years of age are more likely to say that someone owes them money. As seen in the first part of this blog post, people in this age group are also most likely to report they have personal debts.

The cross tabulation of the questions about having debt and being owed money shows that people who are owed money are slightly more likely to have debts.


A new variable, “Debts and Loans,” was created to group people into four categories based on the two CB questions discussed above.


Forty four percent of the population of Georgia are part of the largest group who report neither having debts nor being owed any money. These people are neither better off nor worse off compared to the population on average. The second largest group has debts but no one owes them money. They appear to be in the worst economic situation, with the greatest share of people saying they do not have enough money for food and for clothes in comparison to other groups. The two smallest groups are people who say someone owes them money. The two groups who have no debts appear to be in a relatively good economic situation, with the largest shares of people saying they can afford expensive durables.


Based on the findings presented in both parts of this blog post, debts are approximately twice as common in Georgia as being owed money. Yet, the largest share of the population of the country are those who report neither having debts, nor being owed money.

To look at these issues in more detail, explore the Caucasus Barometer data at CRRC’s Online Data Analysis platform.

Thursday, May 11, 2017

Debts and Loans in Georgia (Part 1)

In Georgia, where, according to the World Bank, a third of the population live on under USD 2.5 per day, poverty and unemployment are consistently considered the most important issues facing the country. For those who are struggling financially, borrowing is a widespread coping mechanism. While access to credit can have benefits, debt can also have psychological costs, such as increased stress and anxiety. CRRC’s 2015 Caucasus Barometer (CB) data show interesting patterns about having personal debts in Georgia. The first part of this blog post focuses on the characteristics of those who report having personal debts in Georgia, while the second part looks at the money lending patterns, as well as reported well-being of people who are owed money or who borrow it.

In response to the question, “Do you currently have any personal debts?” which asks about all types of debt a person may have, 46% of the population report having debts and 53% say they do not have any. There are no large differences by settlement type. People between 36 and 55 years of age report having debts more frequently than people in other age groups. Men report they have debts slightly more often than women.


Note: The charts in this blog post do not include answer options “Don’t know” and “Refuse to answer,” which constituted 1% of responses.

People reporting a more difficult economic situation in their household are more likely to say they have debts. While 55% of people who state they do not have enough money for food report having debts, 28% of people who have enough money for durables report the same.


Note: Answer options “We can afford to buy some expensive durables like a refrigerator or washing machine” and “We can afford to buy anything we need” were combined into the category “Can afford to buy expensive durables” on the chart above.

In the second part of this blog post, which will be published on Monday, patterns of both borrowing and lending money will be discussed.

To have a closer look at the Caucasus Barometer data, visit CRRC’s Online Data Analysis platform.

Monday, September 19, 2016

Employment and income in Georgia: Differences by educational attainment

According to the data of the National Statistics Office of Georgia for 2005-2016, there are approximately 100,000 students in Georgian tertiary educational institutions. Around the world, education generally contributes to increased individual income, and Georgia would not be expected to be an exception in this regard. Still, the role of tertiary education in the professional lives of the population of Georgia has not been studied thoroughly. Based on CRRC’s 2015 Caucasus Barometer survey, this blog post looks at the share of the population that has completed tertiary education, what share of those are employed and in what positions, how much their personal income is, and how the employment situation of those with tertiary education differs from the situation of those who did not obtain a degree.

The answers to the following questions, which used show cards are analyzed in this blog post:
  • What is the highest level of education you have achieved to date? 
    • show card listing levels of education was used.
  • Which of the following best describes your situation?
    • A show card with the following answer options was used:
      • Retired and not working;
      • Student and not working;
      • Housewife and not working;
      • Unemployed;
      • Working either part-time or full time (even if the respondent is retired / is a student), including seasonal work;
      • Self-employed (even if the respondent is retired / is a student), including seasonal work;
      • Self-employed (even if the respondent is retired / is a student), including seasonal work;
      • Other.
  • Which of the following best describes the job you do?
    • A show card listing a hierarchy of job types was used.
  • Speaking about your personal monetary income last month, after all taxes are paid, to which of the following groups do you belong?
    • A show card with income groups was used.
Thirty percent of Georgia’s population reports having completed tertiary education (Bachelor’s, Master’s, Specialist’s or post-graduate degree). As the chart below shows, 29% of those without tertiary education report being employed compared to 49% of those with tertiary education.


Note: Answer options to the question “What is the highest level of education you have achieved to date?” were recoded in the following way: “No primary education”, “Primary education (either complete or incomplete)”, “Incomplete secondary education”, “Completed secondary education”, “Secondary technical education” and “Incomplete higher education”  were combined into “Do not have tertiary education”. Answer options “Completed higher education” and “Post-graduate degree” were combined into “Have tertiary education”.

Answer options to the question “Which of the following best describes your situation?” were recoded in the following way: “Working either part-time or full time (even if retired / a student), including seasonal work”, “Self-employed (even if retired / a student), including seasonal work” were grouped as “Employed”. Those who answered “Disabled and unable to work” and “Other” (2%) were excluded from the analysis. Answer options: “Retired and not working", "Student and not working", "Housewife and not working", and "Unemployed" were grouped as “Unemployed”. Within this group, those who answered “Yes” to the question “Are you currently interested in a job, or not?” were grouped as “Unemployed who are interested in a job”, while those who answered “No” were grouped as “Unemployed who are not interested in a job”.  

Answers “Don’t know” and "Refuse to answer” to either of these questions were also excluded from the analysis. Overall, 4% of cases were excluded. 

As for job positions, most of those with tertiary education who were employed at the time of the survey (28%) were employed as professionals (in the fields of science, healthcare, education, business, law, culture, etc.). On the other hand, most of those without tertiary education who were employed at the time of the survey (18%), reported working in the service sector (e.g., as salespersons, including personal care workers, e.g. baby sitters). 

The higher the income group, the higher is the share of those with tertiary education in it. For example, almost there are almost 2.5 times as many people with tertiary education among those who earned above GEL 600 the month before the survey, compared to those without tertiary education. A Mann-Whitney test shows that the difference between these groups is statistically significant. 


Note: Answer options to the question “Speaking about your personal monetary income last month, after all taxes are paid, to which of the following groups do you belong?” were recoded in the following way: options “GEL 601 to GEL 1000”, “GEL 1001 to GEL 2000”, “GEL 2001 to GEL 3000” and “More than GEL 3000” were grouped as “More than GEL 600”. Answer options “Up to GEL 120” and “GEL 121 to GEL 240” were grouped as “Up to GEL 240”. Those who answered “0”, “Don’t know”, and “Refuse to answer” were excluded from the analysis (36% of cases).

The findings presented in this blog post show that, like in many other countries, tertiary education plays a positive role for employment prospects in Georgia. People with tertiary education are more likely to be employed compared to those who do not have tertiary education. The largest group of those with tertiary education is employed as professionals, while those without tertiary education are most frequently employed as service workers. Importantly, the income of those with tertiary education tends to be higher. In all cases, the differences between those with and without tertiary education are statistically significant.

For more information about the impact of education, see CRRC’s earlier blog posts including Educated parents, educated children? And Connections or education? On the most important factors for getting a good job in Georgia. For more data, check out our Online Data Analysis tool.
