Tuesday, November 16, 2021

Do people think voter secrecy is respected in Georgia

Note: This post first appeared on the Caucasus Data Blog, a joint production of CRRC Georgia and OC Media. It was written by Dr. Tsisana Khundadze, a Senior Researcher at CRRC Georgia. The views presented in the article are the author's alone and do not reflect the views of ISFED, CRRC Georgia, or any related entity.

International and local election observers often note violations of the secrecy of the ballot in Georgia, and the 2021 local elections were no exception.  According to a recent study, a plurality of people think such violations could take place in Georgia, and some have heard of such cases in the past year.

On the survey on election-related attitudes carried out by CRRC Georgia for ISFED,  respondents were asked about a hypothetical country where a citizen’s vote was somehow revealed to a neighbour who was on the election commission. 

Respondents were asked if they thought that something like this could happen in Georgia. A plurality of respondents thought it was possible, while around a third deemed it impossible. The rest were unsure.


A regression analysis shows that people in the 18-34 age group were around 1.2 times more likely to think that someone else might find out who they voted for than older people. 

Even though election observers recorded more violations of the secrecy of the ballot in areas predominantly populated by ethnic minorities, ethnic Georgians were 2.4 times more likely to think this kind of violation was possible in Georgia compared to ethnic minorities. 

People with higher than secondary education were 1.2 times more likely to deem it possible than people with secondary or lower education. 

The more durable goods a household owned (a proxy for wealth), the more likely a person was to think the secrecy of the ballot could be compromised in Georgia.

Opposition party supporters were 2.1 times more likely than Georgian Dream supporters and 1.4 times more likely than people who did not name any party as close to their views to think this was possible in Georgia. 

There were no differences in terms of gender, settlement type, or employment type.

Note: This and the following chart were generated from a regression model. The model includes gender (male, female), age group (18–34, 35–54, 55+), settlement type (capital, urban, rural), ethnicity (Georgian, ethnic minority), education (secondary or lower, secondary technical, tertiary), employment status (public sector, private sector employee, self-employed, not employed), party respondent names as closest to his/her views (Georgian Dream, opposition party, did not name a party (Don’t know, Refuse to answer, No party)), and an additive index of ownership of different items, a common proxy for wealth.

In focus groups and in-depth interviews, some participants felt that the secrecy of the ballot could only be violated when a voter chooses to show someone their ballot or tell them who they voted for. 

Some participants reported that party coordinators asked voters to send a picture of their ballot. Other participants indicated that voters might mark their ballot by drawing a line or putting a dot on it so that it is possible to tell who they voted for. 

However, participants underlined this would still mean that the voter revealed their preferences. 

One participant stated, ‘I have heard of many things, that they have told them to mark it in a specific way, put a cross on it or a dot. So I have heard of it, but not that they have forced someone. Such things happen. I don’t know. They talk about many things.’

The survey shows that, in the past year, 27% of the population had heard of a voter taking their ballot outside the election precinct. Most of the population (61%) had not heard about such an incident. 

A regression analysis shows that ethnic Georgians were 1.9 times more likely to report knowing of such cases than ethnic minorities. 

Similarly, opposition party supporters were 3.1 times more likely than Georgian Dream supporters and 1.6 times more likely than people who did not name a party to report that they had heard of a ballot being taken out of an election precinct. 

Wealthier people were also more likely to say they knew of such cases. There were no gender, age, settlement type, or employment related differences in the data.

Regardless of whether they had heard of someone taking their ballot outside the election precinct, a majority (88%) of the population thought that it was unacceptable or completely unacceptable when a political party coordinator asks a voter to take a picture of their ballot. There were no differences between different groups on this issue.

Thus, a plurality of Georgia’s population thinks it is possible for someone to know who you voted for. Qualitative data suggests that the public thinks this only occurs if a voter reveals their vote to someone else. 

For a majority, it is unacceptable to be asked to take a photo of one’s ballot. Young people, ethnic Georgians, people with higher than secondary education, opposition supporters and people with better economic situations were more likely to question whether the secrecy of the ballot is respected in Georgia.

The data used in this article are available here.


Tuesday, November 09, 2021

What issues do Georgians think about when voting?

This article first appeared on the Caucasus Data Blog, a joint effort of OC Media and CRRC Georgia. It was written by Makhare Atchaidze, a Researcher at CRRC Georgia.

While voters in Georgia tend to look to personalities rather than policies in determining who they will vote for, policies also matter to a large number of people. But what issues are most important to voters?

On 2 October 2021, 1.8 million voters participated in Georgia’s local elections. In Tbilisi, Kakha Kaladze won the most votes in the first round, but failed to pass the 50% + 1 threshold for winning outright in the first round. This resulted in runoff elections in a number of Georgian cities, including Tbilisi, where Kakha Kaladze was re-elected with 56% of the vote. 

In the second round of the campaign, a number of observers noted a shift in the discourse to a conversation around social policy.

Analysis of a recent CRRC Georgia survey funded by the National Endowment for Democracy suggests that in the context of municipal elections, environmental issues are the top policy priority voters think about when deciding who to vote for. 

CRRC Georgia conducted a survey of approximately 3,000 residents of Tbilisi a month before the first round of the elections. Respondents were asked what policy issues matter to them most when deciding who to vote for.

The data shows that the most important issues people think about when it comes to deciding who to vote for are related to the environment and transport infrastructure.

These issues were present in the platforms of the mayoral candidates in the runoff elections. 

Nika Melia focused on maintaining recreational areas, improving cleaning services and wage policies, and waste management. 

Kakha Kaladze’s platform suggested that the City Hall would spend ₾300 million ($95 million) on environmental issues over the next four years. This included spending on renovating old parks and building new ones, forest restoration around Tbilisi, implementing waste separation, and continuing the Healthy City Programme, which includes these and other initiatives. 

Both candidates had even more in their platforms on transport issues.

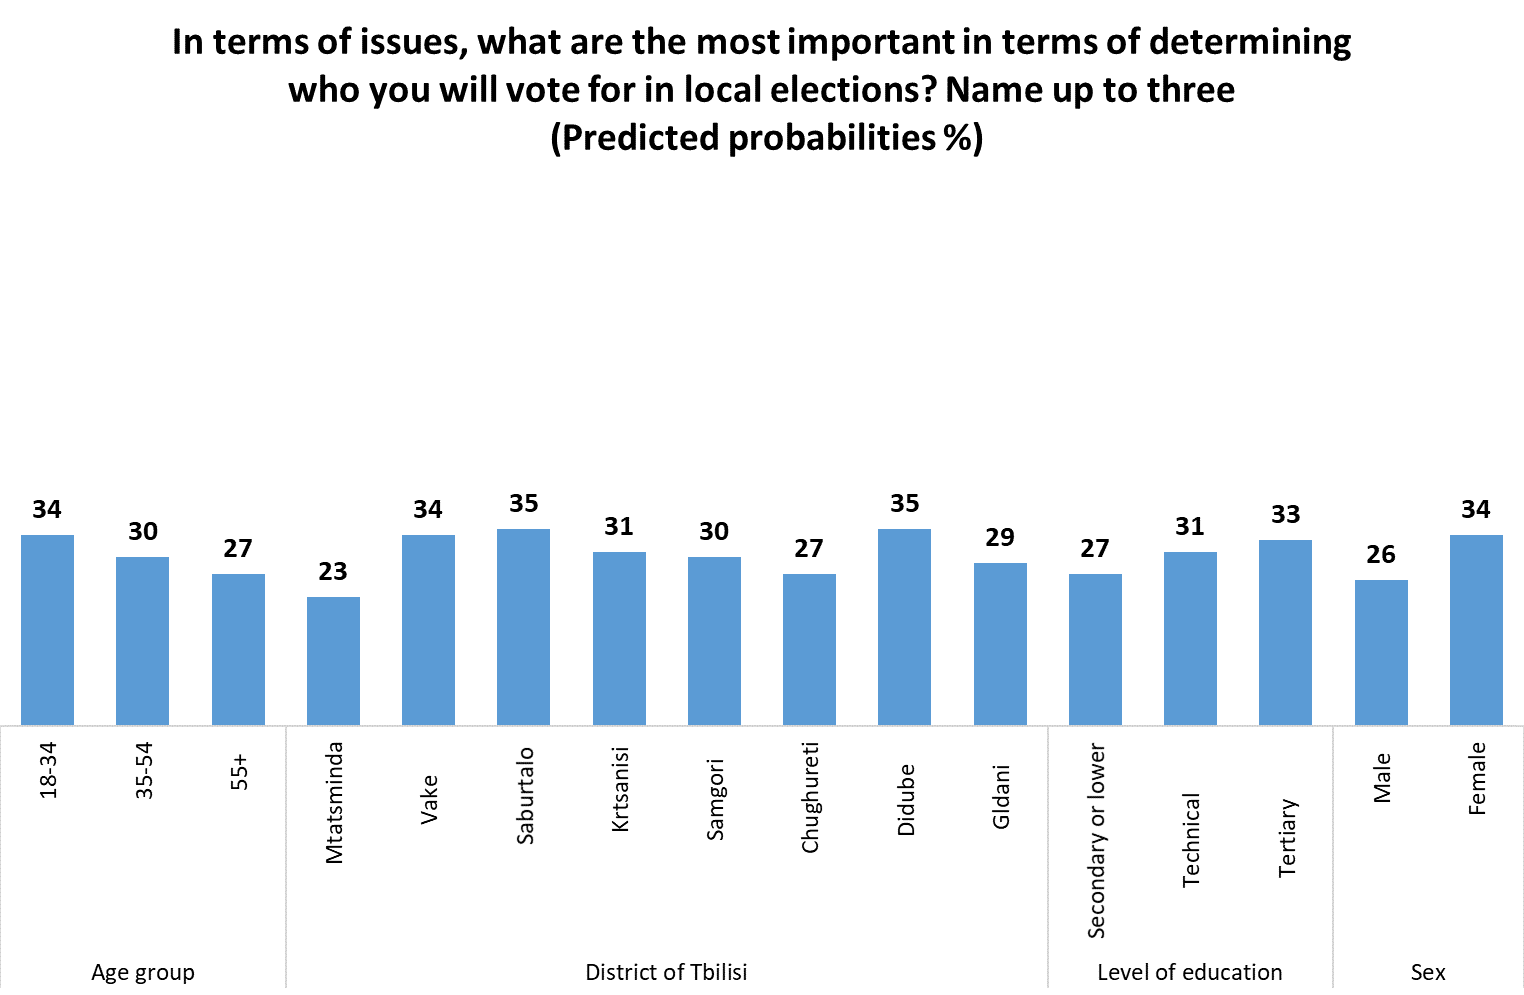
Further analysis which looks at who mentioned parks and green spaces, environmental pollution, and/or clean streets suggests that attitudes vary by a number of characteristics. 

A regression model suggests that people over 55 were less likely to mention environmental issues than other age groups. Saburtalo, Vake, and Didube residents were significantly more likely to report they would vote for a party that would resolve environmental issues.  People with a higher education and women were more likely to name environmental issues as important as well.


Note: This and subsequent charts were based on a logistic regression model. The model includes gender (male, female), age groups (18–34, 35–54, 55+), district of Tbilisi (Mtatsminda, Vake, Saburtalo, Krtsanisi, Isani, Samgori, Chughureti, Didube, Nadzaladevi, Gldani), employment status (employed or not), education (secondary or lower, technical, tertiary), IDP status (forced to move due to conflicts since 1989 or not), ethnicity (Georgian, ethnic minority), wealth (ownership of 10 different items, a proxy variable), and closest party to the respondent’s views (Georgian Dream, opposition, Don’t know/Refuse to answer/No party).

The next most common issues were traffic, public transport, and roads. Looking at who named at least one of these variables shows that transport issues were significantly less likely to be mentioned in Mtatsminda compared to all other districts. 

As far as policy issues, people living in Tbilisi mostly think about environmental and transport issues when deciding who to vote for. Women, younger people, and people with a tertiary education are more likely to mention environmental issues. People in Mtatsminda are least likely of all districts to be concerned with public transport. 

The data used in this article is available here. Replication code for the above analysis is available here.

The views presented in this article do not represent the views of CRRC Georgia, the National Endowment for Democracy, or any related entity.  


Tuesday, November 02, 2021

Party activists near polling stations not acceptable for the majority in Georgia

Note: This article first appeared on the Caucasus Data Blog, a joint production of CRRC Georgia and OC Media. It was written by Elene Ergeshidze, a Researcher at CRRC Georgia. The views expressed in this blog post are the author’s alone, and do not reflect the views of CRRC Georgia, ISFED, or any related entity.

The presence of party activists and coordinators outside polling stations collecting information on voters has become a point of contention in recent years in Georgia. But what does the public think?

A number of local and international election monitors (including the OSCE, NDI, GYLA, ISFED) noted the widespread presence of party activists during 2020’s parliamentary elections. 

According to a CRRC and ISFED survey conducted in August 2021, only 16% of the public said they noticed a candidate, party activist, or coordinator near the election precinct during the past year, recording information about voters or asking voters for personal information. 

A large majority (78%) did not see coordinators, and 5% either reported not knowing or refused to answer. 

Opposition supporters were more likely to report noticing coordinators (33%) than Georgian Dream supporters (10%). Also, people from wealthier households (22%) were more likely to report so than poorer households (11%). 

About half of people did not think that the presence of coordinators at election precincts created an intimidating environment for voters (51%) or influenced who people vote for (55%). Still, more than a third of the respondents agreed with these statements (38%, 34%, respectively). One in ten did not know how to respond to the questions. 

A regression analysis suggests that partisanship and actually reporting seeing a party representative or coordinator predict attitudes towards the perceived atmosphere at election precincts. 

Opposition party supporters were 22 percentage points more likely to agree that it created an intimidating environment than Georgian Dream supporters and 24 percentage points more likely to say the presence of coordinators influenced who people vote for than supporters of the governing party. 

Those who said they have seen party representatives or coordinators near an election precinct were more likely to report that it created an intimidating environment for voters and influenced who people vote for than those who had not seen them.

Although more than half of the public disagreed that coordinators’ presence influenced how people vote or said it created an intimidating environment, a majority (59%) said that their presence was unacceptable. Only a third (30%) of the public said this was acceptable. 

As with the above variables, party support predicted who was more likely to think it was acceptable. Georgian Dream supporters were 2.5 times more likely (48%) to report it was acceptable than supporters of other parties (19%) or those with no specific party identity (27%). 

Those who reported they have not seen coordinators near voting precincts were more likely to find it acceptable (34%) than those who reported noticing them (23%). 

Interestingly people employed in the public sector were also more likely to report they felt it was acceptable for party representatives or coordinators to be present at voting precincts (36% vs 28%). 

While most of the public does not think the presence of coordinators at polling places influenced voters, a majority disapproved of the practice nonetheless. Notably, Georgian Dream supporters were much more accepting of the practice than others. 

The data used in this blog is available here. The analysis of whether different groups viewed the above issues differently was done based on a logistic regression model, which included sex, age group (18-34, 35-54,55+), settlement type (Tbilisi, other urban, rural), ethnicity (minority or not), education level (Secondary or less, vocational, or tertiary education), saw a coordinator or not, employment status (working in the public sector, private sector or not working), party support (Georgian Dream, Opposition, or don’t know/refuse to answer/ no party), and a simple additive index of durable goods (a common proxy of wealth).

Tuesday, October 26, 2021

Leaders or promises: What the Georgian public cares about when voting

Note: This article first appeared on the Caucasus Data Blog, a joint production of OC Media and CRRC Georgia. It was written by Dr. Tsisana Khundadze, a senior researcher at CRRC Georgia. The views presented in the article reflect those of the author alone, and do not reflect the views of ISFED, CRRC Georgia, or any related entity.

Researchers often talk about the importance of policies and political leaders, with the importance of each dependent on the political culture of an electorate. So what are the most important factors for people in Georgia when deciding who to vote for? 

This issue came to the forefront with the arrival of Mikheil Saakashvili in Georgia ahead of the first round of the 2021 local government elections. Whether this ultimately affected the election results is actively discussed

While the impact of Saakashvili’s arrival will likely remain unclear, data from an August 2021 ISFED survey, which CRRC Georgia carried out, shows that while policy matters to voters, political leaders are the most important factors in voters’ minds when deciding who to vote for.

The August 2021 ISFED survey on election-related processes shows that around a third of the population see a party’s electoral platform and promises as the most important factor when deciding who to vote for. A similar share reported the same about trust in the leaders of political parties. Every fourth person mentioned trust in specific members of the party as important. Fewer people mentioned the parties’ past performance or the political opinion of other people.

A regression analysis shows that the only factor that predicts whether trust in party leaders is the most important factor for someone is which party they support. 

People who support the Georgian Dream or an opposition party are 1.3 and 1.4 times more likely to say that trust in the leaders of a political party is an important factor when choosing who to vote for compared with people who do not report that they support a party. 

People of different genders, ages, settlement types, ethnicities, education levels, employment types, and economic situations have similar attitudes, controlling for other factors.

Note: This and the following charts were generated from a regression model. The model includes sex (male, female), age group (18-34, 35-54, 55+), settlement type (capital, urban, rural), ethnicity (Georgian, ethnic minority), education (secondary or lower, secondary technical, tertiary), employment status (public sector, private sector employee, private sector self-employed, not working), party respondent names as closest to his/her views (Georgian Dream, opposition party, did not name a party (Don’t know, Refuse to answer, No party), and an additive index of ownership of different items, a common proxy for wealth.

Whether someone names a party’s electoral platform and promises varies by a number of characteristics as well. 

People with higher than secondary education were 1.2 times more likely to mention a party’s electoral platform and promises as important than people with secondary or lower education. 

People who are not working and people who are employed in the public or private sectors were 1.2 times and 1.4 times, respectively, more likely to mention platforms and promises than self-employed people. 

Georgian Dream supporters were 1.2 times more likely to name a party’s platform and promises as important when deciding who to vote for compared to people who do not name any party. 

There were no significant differences in terms of gender, age, settlement type, ethnicity, or economic situation, controlling for other factors.

While trust towards the party leaders and a party’s promises were the most important factors, when faced with a choice between the two, people leaned towards trust in leaders. 

About half (48%) of the Georgian public reported that it was more important who the party leaders are. In contrast, a third (31%) said what the party promised was more important.

A number of variables predict which direction people lean in. A regression analysis showed that ethnic Georgians were 1.5 times more likely to choose leaders over promises compared to ethnic minorities. 

Opposition supporters were 1.2 times more likely to consider party leaders as more important compared to Georgian Dream supporters. 

Lastly, the wealthier a person’s household, the more likely that person was to agree that who the party leaders are is more important. 

There were no significant differences between people of different genders, ages, settlement types, education levels, or employment statuses, controlling for other factors.

People deem a party’s programme and promises as well as  party leaders important. However, people tend to place more emphasis on leaders. Georgian Dream supporters were more likely to name a party’s electoral platform and less likely to choose leaders over promises. Opposition supporters are most likely to name trust in leaders as most important. Ethnic minorities seem to care less about the leaders compared to ethnic Georgians.

Tuesday, October 19, 2021

Who reported seeing dzveli bitchebi engaged in the elections?

This article first appeared on the Caucasus Data Blog, a joint production of CRRC Georgia and OC Media. It was written by Dustin Gilbreath, Deputy Research Director at CRRC Georgia.


The views presented in this article do not represent the views of the ISFED, CRRC Georgia, or any related entity. 

Opposition parties and some observers reported the engagement of dzveli bitchi, a term roughly equivalent to wise guys or hoods in English, in election-related activities prior to the October 2021 local elections. Data from an ISFED and CRRC Georgia survey suggests that a substantial share of the public also reported seeing the same.

While the survey on the pre-electoral environment saw a large share reporting seeing dzveli bitchebi near election precincts in the year prior to the elections, reported sightings varied significantly based on which political party people support. Even so, some Georgian Dream supporters still reported seeing dzveli bitchebi around election precincts.

One in nine (11%) of Georgia’s adult population reported seeing a dzveli bitchi near a voting precinct in the past year, 83% reported they had not, and 6% either did not know or refused to answer. 

The public was also asked if they thought the participation of dzveli bitchebi in elections was acceptable. Most of the public thought their participation was completely unacceptable (48%) or unacceptable (39%). Only 4% of the public viewed this as acceptable. A further 8% reported they did not know whether it was acceptable or not and 1% refused to answer the question. 

Those that had seen a dzveli bichi around the polling station felt more strongly that this was unacceptable.

A regression analysis suggests that a number of variables predict whether or not someone reported seeing dzveli bitchebi around the election precinct. 

Wealthier households were more likely to report seeing so than people in poorer households.

People in Tbilisi were more likely to report seeing dzveli bitchebi around the election precinct than people in other urban areas, controlling for other factors. 

By far the strongest predictor of whether or not someone reported that they saw dzveli bitchebi near the voting precinct was the party someone supports. Controlling for other factors, a Georgian Dream supporter had a 3% chance of reporting so while an opposition supporter had a 23% chance of reporting the same, a 20 percentage point gap.

The large partisan gap on this issue may suggest that opposition supporters were reporting they saw dzveli bitchebi around election precincts in order to discredit Georgian Dream, knowing that the survey would eventually be public. This could be the case. But, the fact that some Georgian Dream supporters reported the same thing suggests that there were at least some dzveli bitchebi around election precincts in the pre-electoral period.

Dzveli bitchebi tend to be an urban phenomenon. In this regard, one might suggest that the people in rural areas are reporting what they saw on television. This again may be the case. 

A model comparing people who do and do not watch TV in different settlements suggests that people outside Tbilisi that do not watch TV were less likely to claim they saw dzveli bitchebi around polling stations. However, the rates of reporting seeing dzveli bitchebi in Tbilisi are not significantly different for those that do and do not watch TV.


While one in nine in Georgia reported seeing dzveli bitchebi around the electoral precinct prior to the elections this year, the vast majority did not approve of their engagement in elections. 

The data indicates that whether or not all of these reports are true, some of them likely are, given that even Georgian Dream supporters occasionally reported seeing dzveli bitchebi around the election precincts and that the reporting rates are consistent in Tbilisi, where dzveli bitchebi would most likely be, whether or not someone was reporting what they saw on TV on the survey.

Note: The above analysis is based on a logistic regression. The independent variables include gender, age group (18-34, 35-54, 55+), settlement type, education level, an index of durable goods (proxying wealth), ethnicity (ethnic minority or ethnic Georgian), employment status (not working, working in the private sector, working in the public sector) and partisanship. 

Tuesday, October 12, 2021

What issues are important for Tbilisi residents?

Note: This article first appeared on the Caucasus Data Blog, a joint effort of OC Media and CRRC Georgia. It was written by Givi Silagadze and Dustin Gilbreath. The views expressed in this article are the authors’ alone and do not represent the views of NED, CRRC Georgia or any related entity.

The first round of the 2021 municipal elections were short on substantive discussions of local issues. But with the second round coming, what does the Tbilisi public want from their local government? 

Following the 30 October elections, the US Embassy in Tbilisi pointed out that a ‘lack of focus on local issues was a missed opportunity’. The OSCE, meanwhile, lamented that national political framing of the elections ‘overshadowed local issues’. 

A new survey of nearly 3,000 Tbilisians which CRRC Georgia conducted with the support of the National Endowment for Democracy suggests that the local issues that the population of Tbilisi is most worried about are jobs, traffic, air pollution, and public transport. 

Most people were satisfied with their utility infrastructure and unsatisfied with parking, their building’s appearance, and yards. 

When it comes to public transport, the public thinks things have been getting better in recent years. In this regard, they continue to prioritise the development of public transportation over car infrastructure. The public also wants to see green spaces prioritised over private development.

Most important issues

Even though unemployment is a national rather than a local issue, Tbilisi residents were most worried about the lack of jobs in the city. 

A quarter (24%) of people living in Tbilisi named unemployment as the most important problem in their community. Aside from employment, the public named traffic, air pollution, and public transport most frequently. One in seven (13%) Tbilisi residents named traffic as the top problem, 11% reported air pollution, while 10% thinks public transport is the most important issue in the city. 


Regression analysis suggests that men, people with lower education levels, those without jobs, and people living in poorer households were significantly more likely to name unemployment than women, people with higher education levels, the employed, and people from richer households.

As for traffic, supporters of the ruling party, younger people, men, and people living in wealthier households were significantly more likely to report traffic than supporters of the opposition or unaffiliated voters, older people, women, and people living in poorer households. 

IDPs were significantly less likely to name air pollution as a key concern than non-IDPs. No other differences were identified on these issues between different groups.

Housing infrastructure

Respondents were asked about issues in and surrounding their buildings. Tbilisi residents seemed to be most satisfied with utilities infrastructure, such as gas and electricity infrastructure, and light fittings. More than 80% of the public was satisfied with the above communal infrastructure. 

On the other hand, people were most unsatisfied with parking, the condition of yards, and their building’s appearance.


A simple additive index was created with the above 12 housing items, and regression analysis was conducted. The analysis suggests that men, people without jobs, supporters of the Georgian Dream Party, and people living in wealthier households were most satisfied, while women, employed people, supporters of the opposition or unaffiliated voters, and people living in poorer households were least satisfied with their communal infrastructure.

Cars VS public transport

A plurality (45%) of Tbilisi residents said the situation regarding car traffic had improved over the last four years. A third believed it had gotten worse (34%), and roughly a fifth said it had not changed (18%). 

This issue seems particularly partisan with party affiliation being the only statistically significant predictor. More specifically, Georgian Dream supporters were 40 percentage points more likely than opposition supporters and 32 percentage points more likely than unaffiliated voters to think that the situation had improved. 

Attitudes towards public transportation were more positive. Three in five Tbilisi residents (63%) said the situation regarding public transport had improved over the last four years. One in seven (16%) believed it had gotten worse, while 13% thought it had not changed. 

Attitudes towards public transport were a partisan issue as well, with supporters of the ruling party being 33 percentage points more likely to say it had gotten better than opposition supporters. Aside from partisanship, people living in wealthier households had significantly more positive views than people living in poorer households.

As for bus lanes, the public tended to approve of more bus lanes, even at the expense of slowing car traffic. Roughly four in five Tbilisi residents (79%) were in favour of constructing new bus lanes, even if that would make transportation by private cars slower. Only 11% of Tbilisi residents said new bus lanes should not be constructed and that unrestricted car traffic was more important. Regression analysis suggests that men and car owners were less supportive of constructing bus lanes.

In general, the public tended to prioritise improving public transport over building new roads and parking spaces. A majority (63%) of Tbilisi’s population thought improving public transport should be a higher priority for the city. 

Construction and recreational spaces

The survey asked about the government’s role in the construction business. Four in five people living in Tbilisi (82%) thought that the government rather than the construction business should decide where, what, and how something should be built. Regression analysis suggests that, all else equal, opposition supporters and employed people were less supportive of government regulations.

Overall, the survey showed that Tbilisi’s population was most concerned with jobs, traffic, public transportation, and air pollution. 

As for communal infrastructure, people tended to be unsatisfied with their building’s appearance, the state of their yards, and parking. 

Most people were satisfied with gas and electricity infrastructure and light fittings. 

The public generally supports the construction of bus lanes and tends to think that the situation regarding car traffic as well as public transportation has improved over the last four years. However, there is a stark partisan divide with supporters of the Georgian Dream party significantly more likely than other groups of society to think the situation had become better in this regard. 

Finally, Tbilisi residents would like their city government to play an active role in regulating the construction business.

Note: The above data analysis is based on logistic and multinomial regression models which included the following variables: age group (18-34, 35-54, 55+), sex (male or female), education (completed secondary/lower or incomplete higher education/higher), wealth (an additive index of ownership of 10 different items, a proxy variable), employment situation (working or not), IDP status (forced to move due to conflicts since 1989 or not), ethnicity (ethnic Georgian or ethnic minority), and party identification (Georgia Dream, opposition, no party/DK/RA).

Wednesday, October 06, 2021

How widespread is vote-buying perceived to be in Georgia?

Note: This article first appeared on the Caucasus Data Blog, a joint effort of CRRC Georgia and OC Media. It was written by Givi Silagadze, a Researcher at CRRC Georgia. The views presented in this blog do not reflect the views of ISFED, CRRC Georgia, or any related entity.

In their preliminary findings on the 2 October local election in Georgia, the OSCE-led observation mission cited ‘widespread and consistent allegations of vote-buying’ as having marred the vote. Survey data from earlier in the summer sheds further light on the problem, suggesting that 16% of people know someone who has been offered a bribe for their vote.

In recent years, there have been increasing concerns over the conduct of elections in Georgia. Such concerns are well documented in international reports and academic projects that advocate for democracy. 

The Freedom House 2021 report underlined democratic backsliding over recent years, and said the 2020 Parliamentary elections were ‘marred by vote-buying’. 

According to the Varieties of Democracy project, which relies on expert surveys, Georgia’s scores on free and fair elections have been declining since 2017. This decline is largely driven by deteriorating scores in the vote-buying component. 

A recent ISFED/CRRC survey offers a snapshot of people’s attitudes towards and experiences of vote-buying in Georgia. 

How many people know someone that sold their vote?

In total, 12% of the public reported that they knew someone whom a political party had promised personal gain in exchange for their vote. Regression analysis suggests that Georgian Dream supporters were 17 percentage points less likely to do so than opposition supporters. 

One in ten voters said they knew someone whom a political party or candidate had actually given money or a gift to in exchange for their vote over the past year. Regression analysis suggests people living in rural areas and opposition supporters were significantly more likely to report that they know such people than people living in urban areas and supporters of the ruling party. 

Regarding vote-buying practices on election day specifically, 10% of the public said they knew someone whom a party representative or coordinator asked to vote for a specific party in exchange for money on the day of an election. According to a regression analysis, Georgian Dream supporters, people living in poorer households, and older people were less likely to say so than opposition supporters, people living in rich households, and younger people. 

In total, 16% of the public said that they personally knew someone in one of the three categories noted above. 

Regression analysis suggests people living in urban areas, supporters of the ruling party, and people living in poorer households were less likely to report acquaintance with someone who has experienced vote-buying than people living in villages, opposition supporters, or unaffiliated voters, and people living in richer households. 

Are Georgians concerned?

One in five people named vote-buying as the main barrier to free and fair elections in the country. 

Supporters of the ruling Georgian Dream party were less likely than other groups to name vote-buying as an issue. 

Half of the public (54%) named one or multiple obstacles to free and fair elections in Georgia, while 27% reported that they did not know what barriers there were and 16% said there were no obstacles to free and fair elections.

One in five (19%) said vote-buying was one of the most important barriers to proper electoral conduct, while 12% named harassment of voters. Smaller portions of the public named other obstacles. 


Vote-buying was named by a number of different groups as one of the main barriers to free and fair elections more often than others. 

All else equal, ethnic Georgians, opposition supporters, and people who mostly get information about elections via the internet or social media were more likely to think that vote-buying impairs Georgian elections than ethnic minorities, Georgian Dream supporters, and people who watch TV.


That 20% of people believe vote-buying is the main barrier to free and fair elections in Georgia and 16% personally know someone who has been subject to vote-buying portrays a gloomy picture for Georgia’s democratic prospects. 

All this, coupled with recent international concerns regarding Georgia’s commitment to a democratic path should be troubling for Georgians. 

Note: The above data analysis is based on logistic regression models which included the following variables: age group (18-34, 35-54, 55+), sex (male or female), education (completed secondary/lower or incomplete higher education/higher), settlement type (capital, urban, rural), wealth (an additive index of ownership of 10 different items, a proxy variable), employment situation (working or not), IDP status (forced to move due to conflicts since 1989 or not), ethnicity (ethnic Georgian or ethnic minority), primary source of information (TV, internet/social media, other sources), and party identification (Georgia Dream, opposition, no party/DK, refuse to answer).

The data used in this analysis is available here

Tuesday, September 28, 2021

What do Georgians think about Tbilisi Pride?

Note: This article first appeared on the Caucasus Data Blog, a joint effort of CRRC Georgia and OC Media. It was written by David Sichinava, Research Director at CRRC Georgia, and Otto Saladze, a researcher at CRRC Georgia. The views presented in the article are the authors' alone, and do not reflect the views of CRRC Georgia or any related entity.

On 5 July, a homophobic riot broke out on the streets of Tbilisi, leading to injuries and possibly a death. While Georgia’s population is generally conservative, what do people think of the events of 5 July, and how have these views shifted since a similar riot on 17 May 2013?

On the morning of 5 July 2021, hundreds of Georgians responded to the calls of the Patriarchate of Georgia and far-right, pro-Russian, and anti-Western groups to protest against the planned Tbilisi Pride march. 

Ostensibly planned as a peaceful prayer in the front of the Kashueti Saint George Church, located on Tbilisi’s Rustaveli Avenue, violence soon broke out. Protestors, overwhelmingly male, ransacked the offices of Tbilisi Pride, the organisers of Pride Week, and of the Shame Movement, an activist group. 

The protestors turned rioters dispersed a camp of anti-government protestors in front of the country’s parliament building. The mob assaulted more than fifty journalists, one of whom passed away a week later.

The events of 5 July were reminiscent of those of 17 May 2013, when a similarly violent mob, also supported by the Georgian Orthodox Church and various far-right groups, attacked a handful of queer rights activists on Rustaveli Avenue who were marking International Day Against Homophobia, Biphobia, and Transphobia. The police’s inaction in both situations seemingly further emboldened the mobs.

But what do Georgians think about the events of 5 July? Data from CRRC Georgia’s omnibus survey shows that while most Georgians think that holding a pride march posed a danger to the country, the majority is against the violence that took place and supports the freedom of speech and expression enshrined in the country’s constitution. 

Importantly, compared to 2013, the majority of Tbilisi residents do not approve of physical violence — even against those who, in their view, threaten national values.

Awareness of the 5 July events

Eighty-five percent of Georgians have heard about the 5 July events in Tbilisi. Those that had heard about the rallies found out on TV (69%) or social media (45%). One in ten heard about the riots from acquaintances who were not there, while one in fifty claimed to have heard directly from witnesses to what happened.

The majority of Georgians who had heard about the 5 July events were unsure who the organisers of either the Pride March (65%) or the counterdemonstration (67%) were. 

Sixteen percent said that the Tbilisi Pride civic organisation organised the Pride March, while 11% named LGBTQ+ people. Some (5%) mentioned outside forces or foreigners, while 4% named the opposition United National Movement.


As for the violent counterdemonstration, 15% of those who had heard of the 5 July events said that ordinary citizens were behind it. In total, 8% reported that radical groups and leaders organised the counterdemonstration, including the Georgian March, Guram Palavandishvili, and Levan Vasadze

Seven percent named the Georgian Orthodox Church while 5% believe that the government and the ruling Georgian Dream party organised the counterdemonstration.

Would holding a march have endangered Georgia, in the public’s view?

Many politicians, including the prime minister of Georgia, Irakli Gharibashvili, refrained from supporting the Pride March. Gharibashvili even alleged that through organising the Pride March, ‘radical opposition groups’ were stirring up ‘civic unrest’ and ‘chaos’ in the country.

While half of Georgians (52%) who had heard of the 5 July events said the Pride March could have endangered Georgia, more than a quarter (26%) thought it would not have created problems. Additionally, 22% were unsure.

There was relative consensus on this across major social and demographic groups. Still, fewer young people (48%) believed the Pride March posed a danger than people aged 35–54 (57%). Similarly, young people were less uncertain and more likely to think the march would not have been a threat.

Tbilisi residents too were less likely to agree that Tbilisi Pride would have harmed Georgia (46%) than people in other settlements, and were more likely to believe that the Pride March was not a threat. 

While a similar proportion of people from across the partisan spectrum perceived danger in the Pride March, opposition supporters were more likely to disagree with this perception. 

While most (54%) still agreed that organising a pride march would have endangered the country, 35% disagreed. Supporters of the government, and those who were unaffiliated or refrained from reporting their political sympathies, were more likely to be uncertain in their views than opposition supporters.

What did the public think of the violence?

While with the church’s blessing, far-right groups violently retaliated against activists and media workers on 5 July, few in Georgia approved of such conduct. 

Ninety-one percent of Georgians who had heard about the 5 July events said that physical violence is unacceptable in any circumstance. 

Sixty-nine percent disagreed with the proposition that violence was admissible against a group that jeopardised national values. 

Three-quarters of Georgians (74%) fully or partially agreed that the country’s constitution should grant freedom of expression to anybody, regardless of their racial, ethnic, religious, or sexual identity.

How do Georgians evaluate the response of different actors?

Opinions are split when it comes to the assessment of how different actors responded to the 5 July events, with a significant proportion of the country’s population having ambiguous views. 

Forty-two percent positively evaluated the police’s work, while 30% negatively assessed how law enforcement agencies handled the situation. 

Forty percent had a positive outlook on the church’s actions, with 30% negatively evaluating the Georgian Orthodox Church’s handling of the 5 July events. 

More Georgians (36%) had positive views of journalists’ work than negative (29%). 

Roughly similar shares of Georgians had positive (33%) and negative (30%) views of the prime minister’s actions during the events.

The plurality of Georgians were ambivalent when assessing the work of president Salome Zourabishvili and foreign embassies. More Georgians think positively about Zourabishvili’s handling of the situation (25%) than negatively (21%), yet more people either viewed her response as neither positive nor negative or were uncertain about it. 

About thirty percent negatively evaluated the work of foreign embassies, as opposed to 17% who saw their actions during the 5 July events in Tbilisi positively, though again, people were mainly ambivalent or uncertain. The majority (64%) negatively assessed how the Tbilisi Pride organisation handled the situation.

How have attitudes changed in Tbilisi since the 2013 riots?

A set of similar questions were asked to Tbilisi residents in late May 2013 about the 17 May 2013 homophobic riot

In 2013, about 57% of Tbilisi residents believed that an anti-homophobia rally would have endangered Georgia, while 30% disagreed. 

After eight years, while the plurality of Tbilisians still believes in the dangers of the Pride March, more agree that such events do not threaten Georgia.

Compared to 2013, the opinions of Tbilisi residents on whether physical violence is acceptable against those endangering national values have shifted significantly. 

In 2013, half of Tbilisians said they approved of violence in such circumstances, while 46% disapproved. 

According to the omnibus data, eight years later, almost three-quarters of people living in the country’s capital disagree that physical violence is acceptable against those endangering Georgia’s national values.

The 5 July events shocked Georgia. While the country’s population is socially conservative and religious, the majority does not approve of violence, even against those who, in their view, might present a threat to national values. 

Importantly, survey results also suggest that compared to 2013, Georgians’ attitudes have shifted. While a plurality of Tbilisi’s residents still believe that LGBTQ-themed events pose a threat, the proportion of those who think so has decreased by almost ten percentage points. 

Seemingly, Georgians slowly but steadily have come to the view that violence is unacceptable, contrary to what some church leaders and politicians might have called for.

Note: This analysis makes use of a multinomial regression model predicting Georgians’ attitudes on whether holding a Pride March have endangered Georgia or not. Covariates include standard sociodemographic characteristics such as gender, age, settlement type, education, ethnic identity, partisanship, and a durable goods index. Replication of the analysis is available here.


Tuesday, September 21, 2021

Georgia’s COVID-19 cases exploded due to the 2020 parliamentary elections

Note: This article first appeared on the Caucasus Data Blog, a joint production of CRRC Georgia and OC Media. The article was written by Givi Silagadze, a Researcher at CRRC Georgia, and Dustin Gilbreath, Deputy Research Director at CRRC Georgia. The views presented in the article represent the authors' alone and do not reflect the views of CRRC Georgia or any related entity.

New analysis released in CRRC Georgia’s policy bulletin suggests that the 2020 parliamentary elections led to a massive rise in COVID-19 cases and deaths in Georgia. 

While the analysis of last year’s vote looks bleak, this is not to say that the 2 October local elections should be cancelled, which this analysis in no way addresses. However, political parties, the government, and voters need to exercise caution if a repeat of last year is to be avoided. 

The newly released policy brief estimates that approximately 1,250–1,450 of Georgia’s COVID-19 deaths and 100,000–140,000 cases are associated with Georgia’s October 2020 parliamentary elections.

To come to these estimates, a synthetic controls model was used. Synthetic controls models are a type of quasi-experimental statistical model which help to estimate what would have happened in the absence of a large-scale policy change or event. To do so, it constructs a baseline scenario from other countries which are not affected by the particular event. By comparing the baseline scenario to what actually happened, it is possible to estimate the effect of an event.

The chart below shows the results of a model for COVID-19 deaths per million people. The results suggest that around 1,450 people passed away from COVID-19 that would not have had elections not been held. Other models suggested approximately 1,250 deaths were associated with the elections.

Notably, the divergence between the baseline scenario and real Georgia starts two weeks after the elections, in line with the scientific consensus that death rates pick up approximately two weeks after COVID-19 cases start to pick up. The model suggests Georgia had elevated deaths for three months. Two additional models in the policy brief provide lower point estimates of around 1,250 deaths, but substantively similar results.

Similar models were created for COVID-19 cases per capita. The models suggest that between 100,000 and 140,000 cases are associated with the elections. As with the model above, the elevated case counts lasted for approximately two to three months.


The model’s estimates of the increase in COVID-19 cases are in line with the estimated COVID-19 per capita deaths. During this time period, approximately 1.1% of COVID-19 cases resulted in fatalities in Georgia. The deaths and cases the model attributes to the elections is in line with this figure at 1.03%–1.28%.

These results suggest that the government needs to actively work on preventing the spread of COVID-19 on election day on 2 October, and citizens need to follow safety guidelines to prevent the local elections from resembling the 2020 parliamentary elections in terms of COVID-19 spread. 

The full policy brief this article is based on is available here. The full replication code for the analysis is available here.

Wednesday, September 15, 2021

Support for gender equality in parliament is rising in Georgia

This article first appeared on the Caucasus Data Blog, a joint production of CRRC Georgia and OC Media. It was written by Eto Gagunashvili, a researcher at CRRC Georgia. The views presented in this article do not represent the views of the National Democratic Institute, CRRC Georgia, or any related entity. 

Despite the introduction of gender quotas, Georgia’s parliament remains an unequal place in terms of gender. However, the data suggests support for more women in politics is rising.

Women have been and are underrepresented in Georgia’s parliament, with only 17% of seats held by women as of March 2021. This is despite the passage of gender quotas in 2020, according to which parties must nominate at least one woman for every four candidates. 

The discrepancy stems from a mixture of the mixed electoral system and a lack of requirement to name female candidates for the first past the post or majoritarian component of the elections. The legislation passed in 2020 will slowly increase gender quotas, and assuming parliamentary elections become fully proportional, will increase the requirements to one in three candidates being of the opposite gender by 2028. 

In line with legislative changes, CRRC Georgia and NDI’s data suggests that the public has become increasingly supportive of equal representation in parliament for women and men. Notably, support does not vary significantly by partisanship.

From 2014, the CRRC/NDI surveys asked about the best proportion of men and women in parliament. The data show that the share of Georgians who support an equal share of women and men has increased from 32% in 2014 to 49% in February 2021. 

Further analyses suggests women, younger people, and those with a higher education were more likely to support an equal number of men and women in parliament, while older people and men are less likely to do so. 

Women supported equal representation 18 percentage points more often than men, on average, controlling for other factors. 

Young people were 9 and 13 percentage points more likely to do so than people 35–54 and 55+, respectively. 

People with a higher education were 6 percentage points more likely than people with lower levels of education to support an equal parliament. 

Notably, the type of settlement and partisanship were not associated with support for an equal share of men and women in parliament. 

While support for women’s equal participation in politics is on the rise in Georgia, men are less supportive of equality than women, as are older people and those without higher education. 

The data does not suggest differences between supporters of different parties, meaning that support for equality is not a partisan issue for most citizens.

Note: The above analysis is based on a logistic regression, where the dependent variable is equal support for male and female members of parliament. The independent variables include gender, age, settlement type, education, and partisanship. 

Tuesday, September 07, 2021

With local elections coming, what matters to the public?

Note: This article first appeared on the Caucasus Data Blog, a joint production of CRRC Georgia and OC Media. It was written by Dustin Gilbreath, Deputy Research Director at CRRC Georgia. The views presented in the article do not represent the views of the National Democratic Institute, CRRC Georgia or any related entity.

Local elections are set for 2 October, yet a newly released CRRC and NDI survey on Georgian politics shows that 51% of voters identify most closely with no party in particular. For parties, this presents an opportunity to try to win over the half of the public which views no party as closest to them. But what do voters care about? 

The data suggest people are most concerned about roads, the water supply, and the environment in their communities. As the expression goes, politics are local, and the data suggests the importance of different issues varies significantly by settlement.

What are the issues?

Overall, the most important public goods issue for the Georgian public is roads, with 30% of the public naming this as one of the most important issues. This is followed by water supply, with 22% mentioning this issue. In third comes pollution and the environment, with 12% of the public reporting this is the most important issue for them. 

The importance of different issues has fluctuated over time. Fewer people report that roads and the water supply are among the most important public goods issues in their community compared with in 2015. The importance of the environment has declined compared to December 2018 as well. 


Whose priorities?

The data suggests that the main factor associated with people’s views of the above issues is what type of settlement they live in. People in rural areas are six times more likely to report that the water supply is a problem in their settlement compared with people in Tbilisi, controlling for other factors. 

They are also twice as likely as people in the capital to report roads among the main public goods issues in their settlement. By comparison, people in Tbilisi are three times more likely to report that the environment and pollution are more important, controlling for other factors.

Attitudes also vary based on party support, when controlling for other factors. Opposition supporters are slightly more likely to care about the environment as well as roads. Georgian Dream supporters are slightly less likely to consider water a key concern.

The data suggest that there are no significant interactions between party support and settlement type. This means that the differences between supporters of different parties and between people living in different settlement types hold despite their settlement type or which party they support.

Aside from this, wealth is associated with whether or not someone named the environment and the water supply. 

People in the poorest households had a 22% chance of naming the water supply compared to an 11% chance in the wealthier households in the survey, controlling for other factors. Conversely, people in wealthier households had a 20% chance of naming the environment, while those in the poorest households had a 6% chance, controlling for other factors.

Older people were 11 percentage points less likely to name roads.

For political parties looking to campaign in the upcoming elections on policy rather than personality, the above data provides a few ideas. Notably, people in rural areas are more interested in roads and water, while people in Tbilisi are more interested in the environment and pollution. For parties looking to attract unaffiliated voters, promising to improve roads might be a good place to start.

Note: This analysis of which issues are most important is based on a logistic regression analysis. As control variables, it includes settlement type (Tbilisi, other urban, rural), age group (18–34, 35–54, 55+), ethnicity (minority or not), wealth (a simple additive index of durable goods a household owns), sex (male or female), education level (tertiary education or not), and political party (don’t know/no party, opposition supporter, or Georgian Dream supporter).


Tuesday, August 31, 2021

Georgia has a vaccine inequality problem

Note: This article first appeared on the Caucasus Data Blog, a joint effort of OC Media and CRRC Georgia. It was written by David Sichinava, CRRC Georgia's Research Director. The views expressed in this article are those of the author’s alone and do not in any way reflect the views of CRRC Georgia, or any related entity.

A fast and timely rollout of COVID-19 vaccines is essential for keeping the pandemic at bay. While far-reaching immunisation helps save lives, it also helps with quickly reopening the economy. Nevertheless, not everyone has access to life-saving vaccines. Rich countries have been quick to hoard doses to vaccinate their own populations, leaving poorer states lagging behind. 

But unequal access to COVID-19 vaccines within countries also threatens the effective and timely mitigation of the pandemic. Notably, even in countries boasting high rates of vaccine rollout, such as the UK and Israel, COVID-19 vaccines are less accessible to vulnerable and disadvantaged populations. As recent CRRC/NDI data shows, Georgia is no exception.

Despite initial successes in curbing the COVID-19 pandemic, Georgia has done considerably worse in managing infection rates and vaccinations than its neighbours. In the first 10 days of August 2021, the country led global league tables in infection and death rates per 100,000 residents, while simultaneously lagging far behind in immunisation.

As of 25 July 2021, when the last interviews of the CRRC/NDI study were administered, about 7% of Georgians in the survey reported receiving at least one dose of the COVID-19 vaccine. The Georgian government initially prioritised vaccinating older people, so this group is slightly more likely to be inoculated (10%) than those younger than 35 (4%) and between 35 and 54 (8%). More Tbilisi residents (16%) received at least one shot than those from other urban areas (6%) and rural areas (2%).

Notably, a respondent’s socio-economic status predicted whether they had been vaccinated. About 16% of Georgians with a higher education had received at least one dose, as opposed to a mere 4% of those with no higher education. 

About a quarter of respondents with the highest socio-economic standing in the country (as measured by an asset ownership index) had received at least one dose, compared to 6% of those with the median number of assets, and 3% of Georgians within the lowest socioeconomic bracket.

A lack of information might contribute to low immunisation rates. The research indicates that those groups who were least likely to be vaccinated also claimed that they did not have enough information on the immunisation process. For instance, only 18% in the highest socio-economic status say that they did not have enough information on the vaccination process in Georgia, compared to almost half of those within the median (48%) and lowest standing on the socio-economic bracket (46%). 

Similarly, a larger share of Georgians with no higher education (47%) stated that they did not have enough information on vaccination, than those who had attained higher education (30%).

There was also geographic variation. For example, only one-third of Tbilisians reported not having enough information about Georgia’s immunisation process, compared with 43% in other urban areas and 47% in rural areas. 

Not surprisingly, in the days of the initial phase of vaccine rollout, available vaccination time slots in the capital and larger urban areas were filled almost instantaneously. Many Tbilisians even booked available places in vaccination centres outside the capital. This may be because they had better access to information and knowledge of the online booking system: CRRC/NDI data shows that 61% of Tbilisi residents knew how to access online booking system, as opposed to 45% of Georgians from other urban areas and only 27% of rural residents.

Those who reside outside the capital are not the only group put in a disadvantaged position. Other vulnerable groups such as older people, ethnic minorities, poorer Georgians, and those with no higher education were also less likely to have knowledge of how to use the online vaccination booking system. Few among those who claimed not to have enough information on the immunisation process knew how to use the online booking system.

While in the last few weeks, Georgia has accelerated its immunisation efforts, vaccinating more than 20,000 people daily, it is likely that the factors described in this article will continue to affect the timely and equitable access to life-saving vaccines. 

Considering the lack of pro-immunisation information provided by the government and the prevalence of anti-vaccine sentiment among many Georgians, it is crucial that information be disseminated explaining the process and benefits of immunisation. As the data above shows, it’s also critical that this is done in a manner that effectively reaches all Georgians.

Note: Differences were identified using two logistic regression model predicting (a) whether the respondent had a COVID-19 vaccine, (b) whether they reported not having enough information on the immunization process in Georgia, and (c) whether the respondent knew how to use online vaccine booking system. Predictors in each of the models included the following social and demographic variables: gender, age, education, settlement type, ethnicity, partisanship, and a durable goods index. A durable goods index is a common proxy measure of a household’s economic status, which counts the number of appliances present in the household. The lowest value corresponds to the score of 0. The median value corresponds to 6, and the highest value of the index is 10. The replication code is available here.

Georgian views on increased diversity in parliament

Note: This article first appeared on the Caucasus Data Blog, a joint production of OC Media and CRRC Georgia. It was written by Dustin Gilbreath, Deputy Research Director at CRRC Georgia. The views presented in the article do not represent the views of CRRC Georgia, the Carnegie Foundation, the Levan Mikeladze Foundation, the Government of Sweden, or any related entity.

Georgia is a diverse country, with numerous languages, religions, and ethnic groups. Yet, parliament underrepresents both women and ethnic minorities relative to their total shares in the population. Moreover, there are no known LGBTQ+ parliamentarians in Georgia’s history. Data from the September 2020 Future of Georgia survey suggests that people are most positive about more women in parliament, followed by ethnic minorities and LGBT people. 

The data suggests that people are roughly three times as likely to think that there are too few female members of parliament compared with too few minority members of parliament. Very few people (6%) think there are too many female members of parliament, while roughly three times as many (15%) think that there are too many minority members of parliament. 

Similarly, substantially more people think that having more women would have a positive impact than think having more ethnic minorities would. Perhaps unsurprisingly given the homophobic riot on 5 July a large majority of Georgians (69%) think that having more LGBTQ+ people in parliament would have a negative impact, and only 4% think it would have a positive impact.

Age, sex, and education predict people’s views on whether the number of female members of parliament are adequate. Younger people (18-34) are 11-12 percentage points more likely to think that there are too few women in parliament compared to older people. People with vocational education are 8 points less likely than those with tertiary education and 12 points less likely than those with only a secondary education to report there are too few women in parliament. Women are 13 percentage points more likely to report there are too few women in parliament.

When it comes to whether having more women in parliament would be positive or negative, the data suggests that attitudes vary by age, sex, settlement type, and education type. Women are 15 percentage points more likely to think it would have a positive impact. Young people are 10 percentage points more likely to think there would be a positive impact. People in rural areas are 10 percentage points more likely to report there would be a positive impact than people in Tbilisi. People with vocational education are 7 percentage points less likely to think having more women in parliament would have a positive impact.

When it comes to the number of ethnic minorities in parliament, ethnicity and education predict people’s attitudes. While ethnic minorities have a 55% chance of thinking that there were too few ethnic minorities in parliament, ethnic Georgians only had a 13% chance. People with vocational education are slightly more likely to think that there are too many ethnic minorities in parliament, controlling for other factors.

With regard to the impact of having more ethnic minorities in parliament, the data suggests that people with vocational education are more likely to think it would have a negative impact. Ethnic minorities are significantly more likely to think it would have a positive impact.

Although relatively few people had positive views of more LGBTQ+ people being in parliament, there is some variance in attitudes. Notably, ethnic minorities are by far the least negative, controlling for other factors. People with lower levels of education also had relatively less negative attitudes as did people in Tbilisi, people under the age of 55, and non-IDPs.

The above data shows a few patterns. Women are the group that people have the most positive attitudes about in terms of representation in parliament, followed by ethnic minorities and LGBTQ+ people. Women and ethnic minorities are significantly more positive about members of their own group being represented in parliament. Ethnic minorities are also the least negative group about increased LGBTQ+ representation in parliament.

Note: The data analysis in the above is based on ordered logistic regression models controlling for respondent age group (18-34, 35-54, 55+), education level (secondary or less, vocational education, or tertiary education), sex (female or male), settlement type (capital, other urban, or rural), wealth (a simple additive index of ownership of 10 durable goods), and IDP status (IDP or not). The data used in this article are available here.