Tuesday, March 24, 2015

Neighborhoods and neighbors in urban and rural Georgia


Living in either a rural or urban area has both costs and benefits –there are a number of contrasts in lifestyle, access to goods or services, and information. This blog post looks at how urban and rural populations in Georgia relate with their neighbors, using data from the 2014 Volunteering and civic participation in Georgia survey, funded by East-West Management Institute (EWMI) / G-PAC.

One of the distinctions between different settlement types is the duration people have been living in a given neighborhood. Unsurprisingly, the data shows that residents of the capital and other urban settlements are more likely to have changed their neighborhood recently in comparison with the rural population.Those who have lived in their current neighborhood for less than six years are much more common in the capital (27%) compared with other urban (15%) and rural (8%) settlements.


Living in an urban area changes traditional forms of social behavior. In particular, the data shows that the majority of the population who live outside the capital report knowing all the families in their neighborhood, compared with only 34% of those living in the capital. Even controlling for how long residents have lived in a particular neighborhood, the population of the capital is still much less likely than the rest of the population to know all of their neighbors.

Note: The chart presents data for two extreme groups only – those who have lived in a given neighborhood for up to 5 years, and those who have lived there for more than 45 years. Information about those who have lived in a given neighborhood for between 6 and 45 years is not presented.

Those living in Tbilisi communicate with their neighbors less than those living outside the capital. While 79% of residents of rural settlements report talking with their neighbors daily, 63% of residents living in urban settlements outside Tbilisi and only 44% of Tbilisi residents do the same.


Lower engagement with neighbors in the capital could be related to the fact that nearly one-third of capital dwellers moved to their neighborhood within the last five years. This, however, is not the only possible explanation. What do you think?

To explore issues related to neighbors and social interaction further, take a look at the data using CRRC’s Online Data Analysis tool.

Monday, March 23, 2015

The CRRC’s 500th post and thoughts about the future of social research


By Hans Gutbrod

When we started this blog, quite a few years ago, we published a few posts, and didn't tell anyone about it. We weren't sure whether the venture would work – and whether it was a good fit for ourselves. Now, with this 500th post, I'm glad to see that our tentative venture took off.
The blog continues to hold a lot of material that may be of interest to readers, as it documents various aspects of work that have been done over the years. Readers, researchers, journalists and the interested public may find it useful to browse whenever they look for information on a specific issue.

An additional tool we built for that purpose is Find Policy, a tool that searches websites of all major Georgian research organizations, and also includes this blog. You can find it here: www.findpolicy.org/georgia

At the occasion of the 500th post, what are some of the issues that lie in the future? How can empirical social science be relevant to the lives of people in the South Caucasus? Here are some ideas.

Quality & Standards
Research organizations succeed because of processes. Being organized is often more important than being smart. If social researchers in the South Caucasus want to be credible, they have to deliver consistent quality, and this may sound difficult. However, there is much experience in how to structure review processes which institutions can draw on.

Such review costs time. Yet it’s an investment that pays off. If research organizations want to make a difference, putting such internal review processes in place is a key component. How to make them stick? Write them up and put them on your website, as a binding policy to commit everyone on the team. You can still override in rare emergencies, but you can’t thrive if you only operate in emergency mode.

Transparency
Fortunately, many organizations in Georgia are transparent about who funds them. In the past, these were primarily Western-oriented institutions. Lately, there is added concern about funding from Russia, seeking to further Russian interests. At first glance, this is legitimate, too, as debate typically thrives on a diversity of opinion. However, all institutions should be transparent about who funds them. They owe this to citizens, who thereby can better understand who paid for research. Organizations that are committed to having an impact should be role models in that regard. Georgia is already doing quite well – and why not become the most transparent country, in that regard, in the world? (Disclosure: I'm campaigning on this issue through an initiative called Transparify.)

Funding & Finance
Research organizations in the South Caucasus have enjoyed generous support. However, donors often do not understand what it takes to fund consistent quality. For that reason, too, transparency matters. Many research organizations in the South Caucasus arguably are better characterized as bundles of short-term projects. Such funding is valuable, but makes it harder to build up long-term expertise on particular issues. One worthwhile investment for donor money is to (continue to) give core-funding to those institutions that are genuinely committed to doing quality work. One evidence of such a commitment to quality are the standards and the transparency mentioned above.

Policy Relevance
What information should be in social research that aspires to be policy-relevant? There is no consensus on that in the South Caucasus, and arguably not even a sensible debate about some of the core components. Arguably, all policy proposals should be (a) intelligible, (b) calculate costs and benefits, on the basis of sound data, (c) consider alternatives and potential unintended consequences and (d) list major risks and corresponding mitigation strategies. These are some basic criteria that most people should be able to agree on, even while they add further suggestions.

In general, the quality of reports produced by research organizations in the South Caucasus has gone up, but I still read too many reports that fail by some of these basic standards. There also are presentations where I still struggle to understand what’s really being said. By the 1000th post, in šāʾ Allāh, it would be great if these basic problems were under control. Social research would increase its impact and help improve the lives of people in the South Caucasus.

With this happy anniversary note, I pass the ball over to you, readers, for your suggestions on what you would like to see from future social research in the region.


Hans Gutbrod was Regional Director at CRRC from 2006 to 2012, and initiated the CRRC Social Science in the Caucasus blog. He is now with Transparify. He is on Twitter

Monday, March 16, 2015

Kundera revisited: Are Armenians longing to leave their country because of unhappiness?


Although many literature lovers take their favorite novels’ quotes for granted, a hybrid literature lover and social scientist cannot resist but putting literature’s postulates to data scrutiny. In one of his most famous works, The Unbearable Lightness of Being, Milan Kundera wrote that “A person who longs to leave the place where he lives is an unhappy person.” If Kundera’s statement is taken as a hypothesis and generalized from the individual to the societal level, it could be argued that the unhappier people are, the more they will long to leave their countries, emigrating either temporarily or permanently.

Using data from CRRC’s 2010 and 2013 Caucasus Barometer surveys, this blog post tries to test Kundera’s postulate on Armenia. Armenians demonstrate higher interest in both temporary and permanent emigration compared to Azerbaijanis and Georgians. This is consistent throughout the 2008-2013 period covered by Caucasus Barometer surveys. In both 2010 and 2013, almost 1 in 3 Armenians reported that they would leave the country forever if they had the chance, compared to roughly 1 in 5 Azerbaijanis and only around 1 in 14 Georgians. Moreover, regarding temporary emigration, the same pattern emerges, with roughly 3 in 5 Armenians that would leave the country for a certain period if they had the chance, compared to 1 in 2 Azerbaijanis and almost 1 in 2 Georgians.


Note: Options “Do not know” and “Refuse to answer” are excluded from the analysis throughout this blog post.

While it is clear that, in the South Caucasus, Armenians are the most eager to leave their country either temporarily or permanently, it is difficult to point out a single reason behind this eagerness, given the socio-historic background of Armenian emigration and the well-organized diaspora communities that provide support for Armenian emigrants worldwide. Nevertheless, it is interesting to explore whether Armenians’ reported level of (un)happiness is in any way associated with their distinct willingness to leave their country.

Unhappy people in Armenia are slightly less inclined to emigrate temporarily, while there is no significant difference between happy and unhappy people in relation to permanent emigration. Thus, in 2010, 67% of those Armenians who reported to be happy also reported that they would like to leave the country for a certain period if they had the chance, while 58% of unhappy citizens reported the same. In 2013, 62% of Armenians reporting to be happy also reported that they would like to leave the country for a certain period if they had the chance, compared with 54% of the unhappy citizens that were willing to do so. In both years, though, almost the same share of happy and unhappy people would leave Armenia forever if they had the chance.


Note: Answer options to the question “Overall, how happy would you say you are?” were re-coded from a 10-point scale into a 3-point scale, so that answer options 1 through 4 were re-coded into “unhappy”, 5 and 6 into “neither happy nor unhappy,” and 7 through 10 into “happy”. 

Although literary postulates are admired and quoted for their aesthetic beauty rather than their statistical significance, this does not make them immune from data truthiness testing. Despite the sacrilege of putting Kundera’s famous quote under data scrutiny, this blog post showed that in the case of Armenia, there is no statistical association between the level of (un)happiness and Armenians’ distinct willingness to leave their country either temporarily or permanently. Maybe J.R.R Tolkien was right instead, “Not all those who wander are lost.”

What are your thoughts on Armenians’ distinct willingness to emigrate? Join in the conversation on the CRRC Facebook page or in the comments section below.

Monday, March 09, 2015

Georgian youth: EU aspirations, but lacking tolerance

Public opinion polls consistently show that the majority of Georgians want to be a part of the European Union. Young people in Georgia are especially pro-Western, often claiming to share the same values as their peers in the West, according to the survey Knowledge and attitudes toward the EU in Georgia funded by the Eurasia Partnership Foundation and conducted by CRRC-Georgia. Yet, when it comes to acceptance of specific opinions and attitudes divergent from their own, Georgian youth are not always open and tolerant. This blog post compares young Georgians’ level of tolerance and liberal attitudes with that of the youth from other European countries using the results of a survey of young people (16 to 25 years old) conducted in the framework of the Memory, Youth, Political Legacy, and Civic Engagement (MYPLACE) project, carried out in 14 European countries. In each, two settlements were chosen for survey fieldwork. In Georgia, these were Kutaisi and Telavi, and the fieldwork was conducted in fall 2012 by CRRC-Georgia.

Georgian youth assess overall respect for human rights in the country far worse than youth in Croatia, Russia, the UK, and East and West Germany (the project was carried out in East and West Germany separately). Survey results demonstrate that a large majority (up to 70%) of youth in Kutaisi and Telavi think that there is little respect for individual human rights in the country. This can be explained in part by the fact that prior to the start of fieldwork in fall of 2012, videos of torture in Georgian prisons leaked to the media. This led to mass demonstrations, and eventually, spurred on a change of government through October, 2012 parliamentary elections.

Although young Georgians were critical of the extent to which human rights were respected in the country in general, they themselves reported a lack of interest in the rights of sexual and ethnic minorities. Young people’s interest in LGBT rights was particularly low – only 13% of the youth surveyed in Georgia reported that they were interested in LGBT rights, while 68% said they were not interested. Young people in Russian survey locations showed a similar disinterest in LGBT rights, while in all other countries reported interest in LGBT rights was higher, exceeding 20% in Croatia and the United Kingdom, and 40% in both East and West Germany. The lack of interest in Georgia could be interpreted as a lack of respect for the rights of these minorities.

Note: The 11-point scale used for this question was re-coded during the analysis, with original codes 0-3 being labeled as “Not interested”, 4-6 – as “Average interest” and 7-10 as “Interested”.

In Georgia, the above interpretation was partially confirmed by events which followed several months after fieldwork. On May 17, 2013, on the International Day against Homophobia and Transphobia (IDAHO), Georgian society, including the youth, demonstrated its intolerance towards sexual minorities. Thousands of angry people led by representatives of the Georgian Orthodox Church violently attacked Georgian LGBT-rights activists gathered to commemorate the day. This violence “resulted in 17 people being injured – 12 of whom were hospitalized, including three policemen and a journalist.”

When it comes to the rights of other ethnic groups and foreign nationals – and most notably, migrants – Georgian youth seem to be more accepting than with sexual minorities. Nonetheless, the level of tolerance reported in Georgia is low compared to other countries. About 40% of young people in the Georgian survey locations “strongly agree” or “agree” with the statement that “migrants should have the same rights to welfare (social assistance/support) as people from Georgia.” On the other hand, 38% “strongly disagree” or “disagree” with this statement. Compared with other countries, only Russian young people seem to be less tolerant, with 46% disagreeing with this statement. In surveyed European Union countries, young people are more open to other nations and a higher percentage agrees with the above statement. This data demonstrates that when it comes to immigrants, young people’s way of thinking in Georgia is more in line with young people living in Russia than those living in the EU.
 

Tolerance and openness to whatever is not considered “Georgian” is often absent among Georgian youth. Therefore, it seems too early to talk about deeply rooted liberal attitudes and tolerance of the youth in Georgia – these values, rather characteristic of EU countries, have not yet developed in Georgia, and many young people are not yet ready to accept different views or to respect and support the interests and rights of minorities in the country.

To learn more about the MYPLACE project, visit the project website. To view more results of other CRRC surveys, visit our Online Data Analysis tool.

Monday, March 02, 2015

Deserving to be beaten and tolerating violence: Attitudes towards violence against women in Azerbaijan


Domestic violence counts for a considerable part of violence against women worldwide, with as many as 38% of all murders of women in 2013 being committed by intimate partners, compared with only 6% of murders of men according to the World Health Organization. The gendered character of domestic violence is a pressing issue in the South Caucasus. In Georgia, 1 in 11 married women has been a victim of physical domestic violence. Compounding the issue, 78% of women in Georgia consider domestic violence a private matter that should remain in the family, according to the United Nations Population Fund in 2010. Although, in Georgia 25 women were reported to have been killed by their husbands or partners in 2014 alone, the number is widely believed to be higher due to non-systematic practices of recording violence against women. In contrast to both Azerbaijan and Georgia, in Armenia there is still no legislation against domestic violence, with Amnesty International reporting that the numbers of women having experienced violence from their husbands or family members in 2008 was as high as 1 in 4 women. Azerbaijan presents a similarly alarming case, with 83 women that have been killed and 98 that committed suicide as a result of domestic violence in 2013, according to the Council of Europe. Against this background, it is important to have a closer look at people’s attitude towards violence against women and more specifically, towards domestic violence in Azerbaijan.

CRRC-Azerbaijan’s 2012 Social Capital, Media and Gender Survey in Azerbaijan, funded by the Swedish International Development Cooperation Agency (SIDA), provides an opportunity to explore the attitudes of different socio-demographic groups of the Azerbaijani population towards violence against women. Respondents were asked, to what extent they agree or disagree with the statements, “There are times when women deserve to be beaten” and “Women should tolerate violence in order to keep their families together.” This blog post looks into how the attitudes of the representatives of various socio-demographic groups differ towards these two statements, which are jointly referred to as “violence against women”.

In general, Azerbaijanis are more inclined to agree that women should tolerate domestic violence in order to keep their family together (40%) than to agree that there are times when a woman deserves to be beaten (22%). Thus, part of the Azerbaijani population thinks that even though women do not deserve to be beaten, they should still tolerate violence in order to keep their families together.

In Azerbaijan, men are more inclined than women to think that there are times when women deserve to be beaten and/or that women should tolerate violence in order to keep their families together. Thus, 13% more men than women think that there are times when women deserve to be beaten, and 9% more men think that women should tolerate violence in order to keep their families together. Nevertheless, it is important to notice that women themselves (16% in the former case, and an alarming 36% in the latter one) also agree with the statements. 


Note: Answers to both statements, “There are times when women deserve to be beaten” and “Women should tolerate violence in order to keep their families together,” were re-coded here and in the rest of the analysis as follows: “completely agree” and “somewhat agree” into “agree,” and “completely disagree” and “somewhat disagree” into “disagree.” Options “Do not know” and “Refuse to answer” are excluded from the analysis throughout the blog.

Attitudes towards violence against women also vary by settlement type. When moving from rural settlements to the capital, less people believe that women deserve to be beaten or that women should tolerate violence. The difference is visible when considering that 1 in 3 people in rural settlements think that there are times when women deserve to be beaten, against only 1 in 10 people agreeing with the statement in Baku. Moreover, almost every other person in rural settlements believes that women should tolerate violence in order to keep their families together, against less than 1 in 4 people that think so in Baku.


Attitudes towards violence against women also vary by economic situation. About a third (30%) of those that describe their economic situation as poor believe that there are times when women deserve to be beaten and half of them believe that women should tolerate violence, compared with 16% and 17% of those reporting their economic situation as good. Thus, it seems that the better their economic situation, the less Azerbaijanis tend to think that violence against women is justifiable.


Note: Answer options on economic situation were re-coded as follows: “very good” and “good” into “good” and “very poor” and “poor” into “poor”.

When it comes to the level of education, the most visible cleavage in relation to attitudes towards violence against women is between the people with higher education and everyone else. Not unexpectedly, people with higher education are less inclined to believe that women deserve to be beaten or that they should tolerate violence, compared to the rest of the population of Azerbaijan.


Note: Level of education was re-coded as follows: options “Vocational/technical degree”, “High school diploma (10 or 11 years)”, “Nine year diploma,” and “Did not obtain a nine year diploma” were combined into “High school/technical degree or lower,” and options “Bachelors degree/5 years diploma” and “Any degree above bachelors” were combined into “Bachelors degree/5 years diploma or higher”.


This blog post explored the attitudes of different socio-demographic groups in Azerbaijan towards violence against women, with a specific focus on domestic violence. The analysis showed that the more educated and the better off economically people are, the less they tend to believe that women should be beaten or that they should tolerate violence in order to keep their families together. The same is also true for women and people living in the urban settlements  ̶  especially in the capital  ̶  as opposed to men and people living in rural settlements of Azerbaijan.

What do you think are the attitudes of people in Georgia and Armenia towards violence against women? Join in the conversation on the CRRC Facebook page or in the comments section below. 

Thursday, February 26, 2015

Tracing regional inequalities in the Georgian education system (Part 2)


The first part of this blog post described the regional distribution of 2014 United National Exams (UNE) mean scores in Georgia. Here in the second part, we look at applicants’ gender and location (as explained below) in order to understand how mean 2014 UNE scores differ by these variables. This post also considers the role and quality of teachers in these regional disparities.

A location variable was generated for the present analysis, based on the applicants’ municipality of registration. This variable breaks down the applicants into five groups: those coming from the capital, large cities (Kutaisi, Rustavi, Batumi, Poti), municipalities in Western Georgia (including both urban and rural settlements), municipalities in Eastern Georgia (again, including both urban and rural settlements), and ‘other’ (IDPs and foreign-registered applicants). Although it is not possible to differentiate between urban and rural residents of the municipalities using UNE data, in general, municipalities included in the Eastern and Western Georgia groupings mainly consist of  rural populations.

As descriptive analysis presented in the first part of this blog post showed, applicants from Tbilisi and large cities scored the highest. Applicants coming from ethnic minority municipalities and certain mountainous areas of Western Georgia received the lowest scores. In order to check whether regional differences are systematic or random, a statistical technique called Analysis of Variance (ANOVA) was employed. ANOVA checks whether the mean score of the groups under analysis differ from each other and whether a difference is statistically significant. The ANOVA results show that the main effects of gender, F(1, 26311)= 136.43, p<0.001, and location, F(4, 26311)= 396.36, p<0.001 are significant factors in applicants’ exam scores, while the interaction of these two variables is not significant, F(4, 26311)=1.67, p=0.1531. Post-hoc analysis demonstrates that there are no significant differences between the scores of applicants from the municipalities of Western and Eastern Georgia.


As shown in the chart above, in all locations, female applicants had higher mean scores than males. Applicants from Tbilisi – both males and females – were the most successful. Residents of large urban areas performed better than applicants from predominantly rural municipalities. Finally, applicants from the ‘other’ group scored higher than those from predominantly rural municipalities.

Although, in general, female applicants scored better than males, the difference was not vast. Importantly, there are significant regional gaps between applicants, which are clearly revealed by UNE scores. A number of reasons likely contribute to this disparity.

To start, Georgia is characterized by endemic regional inequality, including uneven quality of education in the country. There is an especially large gap between large urban areas and predominantly rural municipalities. The lack of quality education and good teachers in rural areas is obvious from the results of international tests taken by schoolchildren (TIMSS, PISA, PIRLS). Although, in these tests, Georgian pupils, overall, score around or above world averages, the picture is bleaker when looking at the scores by settlement type.

In Georgia, there is generally a lack of good teachers – nationally, over 90% of teachers of certain disciplines failed their certification exams in 2013. Still, the low quality of teachers in rural areas is more pronounced. If we look at the statistics for pupils per certified teachers (i.e. teachers who have passed special exams and hence are considered better performers compared with their peers), we see that this number is highest in ethnic minority municipalities – that is, there are fewer certified teachers with more students. In Marneuli, Ninotsminda and Akhalkalaki municipalities, there are one hundred or more pupils per certified teacher, while in Sachkhere municipality in Imereti the respective number is 25.


As school education, which should be instrumental in preparing pupils for university admission exams, appears to be inadequate, university applicants (and their parents) often hire private tutors rather than attend school in the final (11th and 12th) grades. Considering that private tutors are in many cases active teachers, the availability of quality tutors in rural areas is also lower, while better private tutors are found in the capital and large urban areas. This factor also contributes to regional disparities in UNE scores.

This series of blog posts explored the results of 2014 Unified Entrance Exams, taking into consideration regional and gender factors. Both descriptive and exploratory analysis shows that there are significant disparities between applicants, especially from the geographic point of view. While UNE was an excellent opportunity for many applicants who would not have had the chance to be accepted to a higher educational institution within the previous corrupt admissions system, certain segments of the population still do not enjoy equal opportunities, not because of the UNE per se, but due to the existing endemic problems that the Georgian secondary education system faces. In spite of its impressive success, the improved university admissions system has not tackled Georgia’s deep-rooted educational inequalities.

Have other insights? Join the conversation on our Facebook page or in the comments section below.

Monday, February 23, 2015

Tracing regional inequalities in the Georgian education system (Part 1)


It has been almost ten years since United National Exams (UNE) for university admissions were introduced in Georgia, and the introduction of UNE has been named by the World Bank as one of the most successful reforms implemented since the Rose Revolution. Previously, university admissions were directly administered by the higher educational institutions, and entrance exams were often the site of highly corrupt practices. UNE ultimately led to the complete elimination of corruption and nepotism from the admissions process.

Corruption aside, fair and exclusively merit-based UNE were expected to give a better chance to applicants from outside Tbilisi, including representatives of ethnic minorities, to enroll in the best educational institutions in Georgia. Some, largely unsystematic evidence, however, suggests that this expectation has not been met. While at present, we do not possess longitudinal data which would enable us to draw comparisons between the situation before and after the reform, we do have data to look at how admitted applicants from different regions of Georgia performed on the 2014 exams. The publicly available 2014 UNE database contains scores for all exam takers (about 26,000 individuals) along with basic demographic data about them, such as date of birth, gender, and municipality where the applicant was registered at the time of exam. It should be noted that the applicants’ place of registration does not necessarily accurately reflect their actual place of residence in Georgia, since no one is obliged by law to live in their place of registration. This is especially true for IDPs, who despite being registered in Abkhazia or South Ossetia, in fact generally reside in areas controlled by Georgia, mainly in Tbilisi (40% of the whole IDP population) and Samegrelo-Zemo Svaneti (32%). However, registration data still makes sense as many people in Georgia, especially the youth graduating secondary schools, generally live in their place of registration.

The map below displays the distribution of UNE scores by applicants’ municipality in 2014. The municipalities on the map below have been assigned a color based on the standard deviation of the applicants’ mean scores. Standard deviation indicates how distant a particular data point, an exam score in this instance, is from the mean. It also “quantifies the amount of variation or dispersion of a set of data values.”  On the map, negative standard deviations indicate values less than the national mean, while positive ones indicate values above the national mean.
  

Looking at the regional distribution of mean exam scores on the map above, a number of patterns can be observed. High and low scores are concentrated territorially and form distinct geographic patterns. Applicants from the capital and large urban areas (Kutaisi, Batumi, Rustavi, Poti) on average have received the highest scores. Another area of concentration of high scores can be observed in Kakheti. The performance of representatives of municipalities from the central-western parts of Georgia was slightly worse (Racha-Lechkhumi, eastern municipalities of Imereti, as well as Khashuri and Gori). Interestingly enough, IDP contestants’ results are also quite high, especially those registered in Sukhumi municipality.

Municipalities with predominantly non-ethnic Georgian populations have the lowest mean exam scores in the country. Applicants from Marneuli, Bolnisi, Akhalkalaki, Ninotsminda and Tsalka municipalities performed the worst on average during the last UNE. Upper Adjara and Svaneti are two other areas with concentrations of low scores.

UNE scores portray a larger problem with the education system in Georgia – regional inequality of access to quality education. Applicants coming from regions and especially ethnic minority applicants are less likely to score high on exams even though they provide everyone with an equal chance. Moreover, provided that advanced knowledge of the state language – Georgian –was necessary to pass the exams, to a certain extent, the UNE discriminated against ethnic minority exam takers, especially those from Samtskhe-Javakheti and Kvemo Kartli, who are often not fluent in Georgian.

Despite the fact that the National Assessment and Examinations Center (NAEC) quickly acknowledged this latter problem and, starting from 2010, offered exams in minorities’ native languages (Armenian, Azerbaijani and Russian), as it is clear from the map above,  the disparity between predominantly Georgian-speaking and ethnic minority municipalities remains. 

This blog post described regional disparities in terms of UNE exam scores in Georgia. In the next blog post, we will investigate whether gender and settlement type impact UNE scores. Despite the above explanations for regional disparities not being exhaustive, they give some food for thought and discussion. Have other insights? Join the conversation on our Facebook page or in the comments section below.

Monday, February 16, 2015

On courts and trust: Perceptions of the judiciary in Georgia


As in many countries in transition, reform of the judiciary has been a major issue in Georgia. The country has gone through a number of reforms since the early 1990s. After the bitter September 2012 prison abuse scandal, the post-2012 election period saw a renewed attempt at reforming the judiciary by the newly elected government. This attempt involved a series of legislative changes in 2012, 2013 and 2014. While these changes might have passed unnoticed on the part of the general public, the high profile trials and indictments of former top officials, including President Mikheil Saakashvili, the Minister of Internal Affairs Vano Merabashvili, Mayor of Tbilisi Gigi Ugulava, Defense Minister Davit Kezerashvili and Chief Prosecutor and Minister of Justice Zurab Adeishvili have certainly attracted the public’s attention.

As the prison scandal, judicial reforms and trials continue to make headlines three years into the new government, it is interesting to look at the dynamics of public trust in the judiciary in Georgia and to explore factors that could be linked to it. Using data from CRRC-Georgia’s 2014 survey Attitudes towards the Judicial System in Georgia, funded by USAID through the East-West Management Institute, this blog post explores Georgian citizens’ trust towards the judiciary by looking at three factors that are commonly used in the literature to explain levels of trust in public institutions: (1) perceived performance (Askvik, Jamil and Dhakal, 2011); (2) fairness  (Rothstein, 2004; Mishler and Rose, 1997); and (3) trust in incumbents (Sztompka, 1999). As Georgian citizens indicate that courts and judges are one of the first things that come to their mind when thinking of the judiciary, we refer to courts in this post to represent the judiciary.

In order to explore how assessments of the courts’ performance are associated with trust in courts in Georgia, we look at trust in courts by perceived court performance. The latter is measured by the answers to the question asking how Georgian courts work after the 2012 Parliamentary Elections. The chart below shows that half of those that reported better performance also reported trusting courts, while roughly the same share (54%) of those who reported worse performance reported distrust in courts. Unsurprisingly, the data proves that the more people perceive that courts are performing well, the more they tend to trust them. This conclusion is also backed by correlation analysis which shows significant, but relatively weak correlation between these variables.


Note: During the analysis, the answers to the question “How much do you trust or distrust courts?” were re-coded from the 10-point scale used in the questionnaire into a 3-point scale where original options 1 through 4 were combined into “Distrust,” options 5 and 6 were combined into “Neither trust nor distrust” and options 7 through 10 were combined into “Trust.” Options “Do not know” and “Refuse to answer” are excluded from the analysis here as well as in the rest of the analysis. Answer options to the question “How did the Georgian courts work after the 2012 Elections?” were re-coded as follows: “much better” and “somewhat better” into “better”, and “somewhat worse” and “much worse” into “worse”. 

Fairness is another factor that helps to explain the level of trust in courts. It can be measured through the level of (dis)agreement with the statement “All people are equal before the law in Georgia.” Similar to the previous chart, the chart below shows that about half of those agreeing that everyone is equal before the law in Georgia trust courts, while half of the people that disagree with the statement distrust courts. Therefore, the more that Georgians agree that all people are equal before the law in Georgia, the more they tend to trust courts. The correlation between these two variables is also significant and relatively weak.


Note: The answers to the statement “All people are equal before the law in Georgia” were re-coded from the 10-point scale used in the questionnaire into a 3-point scale where original options 1 through 4 were combined into “Disagree,” options 5 and 6 were combined into “Neither agree nor disagree” and options 7 through 10 were combined into “Agree”.

Finally, the literature suggests that trust in an institution is an aggregation of trust in an institution’s incumbents i.e. the people that are employed or that represent an institution. Here, the perceived level of judges’ fairness, measured by (dis)agreement with the statement, “Overall, the judges are fair in Georgia,” serves as a window into trust in court incumbents. Unsurprisingly, 69% of those that agree that judges are fair report trusting courts, and 63% of those that disagree report distrusting them. Thus, the more people believe judges are fair, the more they tend to trust courts in Georgia. This conclusion is also backed by correlation analysis that showed significant and strong correlation between Georgian citizens’ trust in courts and their assessment of judges’ fairness.


Note: The answers to the question “To what extent do you agree or disagree with the opinion that Georgian judges are fair?” were re-coded from a 10-point scale used in the questionnaire into a 3-point scale where original options 1 through 4 were combined into “Disagree,” options 5 and 6 were combined into “Neither agree nor disagree” and options 7 through 10 were combined into “Agree”.

This blog post explored associations between levels of trust in courts in Georgia and some factors that are considered important to the level of trust in public institutions. The analysis found that all three factors discussed – perceived performance, perceived fairness and trust in incumbents – can help explain levels of trust in the judiciary in Georgia and that they can potentially serve as explanatory variables for further analysis of trust in courts. Unsurprisingly, the charts presented above display an almost symmetrical compatibility between (dis)agreement with statements and levels of (dis)trust, while correlation analysis also backed the results. Still, it would be interesting to explore the effects of political discourse, especially when emphasis is placed on “change” and “reform,” in order to see whether perceptions are affected by personal experience with institutions or by the general climate which emphasizes change in everyday public discourse.

What other factors are at play when thinking about trust in the judiciary in Georgia? Join in the conversation on the CRRC-Georgia Facebook page or in the comments section below.

Wednesday, February 11, 2015

Trust and Distrust in Political institutions in Azerbaijan

[This is a guest blog post by Anar Valiyev, Azer Babayev, Hajar Huseynova and Khalida Jafarova, prepared in the framework of the Research Beyond the Ivory Tower project of the Norwegian Institute of International Affairs (NUPI). The views expressed in this blog are those of the authors alone, and may not reflect the views of CRRC-Armenia, CRRC-Azerbaijan, or CRRC-Georgia.]

This blog post is based on research on (dis)trust in political institutions in Azerbaijan. Internationally, levels of trust in political institutions often reflect how well these institutions perform in relation to citizens’ expectations. This is not necessarily the case in Azerbaijan. Although survey results consistently show that trust in the President is high, crucial political institutions such as Parliament and local government are less trusted and, overall, the level of trust is not very high. This is important because of two implications: on the one hand, high levels of political trust can aid economic development and political stability. Distrust in political institutions, on the other hand, can lead to low voter turnout and the weakening of democratic reforms. Allegedly, it may also lead to corruption.

As in other post-Communist states, in Azerbaijan, political distrust is historically rooted. Even during the Communist regime, trust toward state institutions was not high due to high levels of corruption, nepotism and mismanagement of institutions. Since the collapse of the Soviet Union, declining trust levels and poor public management have led to political apathy and low membership in political organizations.

In Azerbaijan, which is a presidential republic, trust in the President and trust in other institutions of the executive government differ from each other. While, according to CRRC’s Caucasus Barometer survey, 56% of the population reports trust and 22% distrust in executive government, e.g. the Ministers, 84% of the population reports trusting the President of Azerbaijan. However, only 39% of the population reports trusting local government. Attitudes towards local government are also reflected in very low turnout during municipal elections – 32% in 2009, 23% in 2011, 39% in 2014. It is possible that people do not see much value in participating in these elections due to the ineffectiveness of municipalities.

In order to address the issue of distrust in political institutions, the government should take immediate action by making the work of state institutions transparent and public, educating the public on the importance of state institutions, and involving the public in the decision-making processes.

Friday, February 06, 2015

Getting to the streets: Who is more inclined to protest in Georgia?


While elections bring citizens to vote on a regular basis thus fulfilling the minimal  ̶  necessary but not sufficient  ̶  condition for democracy, as set out by Schumpeter in 1942, petitions, demonstrations and various forms of organized protests are also an effective way for citizens in democratic societies to both exercise the power of the sovereign in between elections and to express discontent with elected representatives. These activities become more popular when other forms of institutional or civic channels are absent, dysfunctional, or alien to the majority of the population.

Georgia has had quite a rich experience with protests and demonstrations after independence in 1991. These have been mainly driven at efforts to change the government, although the last couple of years have seen demonstrations of a social nature with regards to LGBT (both pro- and anti-LGBT rights) and women’s rights.  Authors like McAdams (1982) and Van Zomeran et. al (2008) use people’s perceptions of a movement’s efficacy to bring the expected/desired change, among other factors, in order to explain their willingness to participate in such movements. Thus, the more people perceive an activity as efficacious for the aimed outcome, the more they are willing to take part in it. Given the above, it is interesting to explore whether perception of efficacy of protest actions is equally characteristic for different socio-demographic groups, and if not – representatives of which groups are more inclined to perceive protests and demonstrations as efficacious and eventually take part in them in Georgia.

Using data from CRRC-Georgia’s 2014 survey Volunteering and civic participation in Georgia, funded by USAID through the East West Management Institute, this blog post explores who is more inclined to participate in demonstrations based on the perceived efficacy of actions. Efficacy is measured through agreement or disagreement with the statements, “For me, actions like holding peaceful demonstrations to demand something from the government are pointless, because the government will do whatever it wants anyway,” and “I think that holding peaceful demonstrations is important, because in this way the government is forced to take into consideration people’s demands,” which were originally two opposing statements offered to respondents. In tangent to these questions, the blog post explores how the answers of people with different levels of education, household economic situations and a background of recent participation in public meetings or political rallies differ based on perceived efficacy of peaceful demonstrations.

While there were minor differences in the level of perceived efficacy of demonstrations by genderage and settlement type, visible differences were observed by level of education. The chart below demonstrates that the higher peoples’ level of education in Georgia, the more they tend to see peaceful demonstrations as an efficacious tool to affect government decision-making. Thus, 78% of those with higher education report perceiving demonstrations as important in forcing the government to take into consideration people’s demands, compared to 64% of those with secondary or lower education.


Note: Level of education was re-coded as follows: “no primary education”, “primary education”, “incomplete secondary education” and “completed secondary education” into “secondary or lower”; “incomplete higher education”, “completed higher education” and “PhD or Post-Doctoral” into “Higher”. Both here and in the following charts in this blog post, agreement and strong agreement with any of the two opposing statements offered to the respondents were grouped during data analysis. The option “agree with none of the statements,” as well as answers “Do not know” and “Refuse to answer” were excluded from the analyses.

A poor economic situation may also lead to belief in efficacy of and, eventually, participation in protest actions. Although one may expect that people who report that money is not enough for food and/or clothes are more likely to participate in a peaceful demonstration in order to influence the government in Georgia, survey data suggests that this is not the case. In fact, the worse people perceive their household’s economic condition to be, the less they are inclined to see peaceful demonstrations as an efficacious tool to influence the government. Thus, 42% of Georgians that report money is not enough for food see protests as pointless, compared to only 19% of those that report having a very good household economic condition (those who report they can afford to buy expensive durables or anything they need).


Note: In the question on household economic situation, options “We can afford to buy some expensive durables” and “We can buy anything we need” were combined during the analysis. Options “Do not know” and “Refuse to answer” were excluded from the analysis.

Although Georgians that participated in meetings and/or rallies in the past 6 months appear to be more optimistic than others in relation to the efficacy of demonstrations, roughly one in five people that reported previous participation do not see demonstrations as efficacious in influencing decision-making. Rather than pessimistic, as would be the case with those that have not tried to engage in such activities, this segment of active citizens may better be described as disappointed.


Note: Two different questions were used to measure participation in a political rally or a public meeting. During the analysis, the answer “Yes” to at least one of these questions was classified as “I took part in a political rally and/or a public meeting in the past 6 months” and the rest were classified as “I took part in neither a political rally nor a public meeting in the past 6 months.” Options “Do not know” and “Refuse to answer” were excluded from the analysis.

This blog post has shown that those that recently participated in public meetings or rallies, as well as more educated and wealthy Georgians perceive peaceful demonstrations as more efficacious in affecting government decision-making, compared to those who have not recently participated in meetings or rallies, are less educated and are poorer. If perceived efficacy of demonstrations would define choices on whether to participate in a demonstration or not, then one can expect the rich, the educated and the people that were recently active in public meetings or rallies to be the first to get to the streets for a demonstration.

How does this match up with your understandings of protestors in Georgia? Join in the conversation on our Facebook page, here.

To learn more about the data, check out the 2014 Policy, Advocacy, and Civil Society Development in Georgia report or refer to CRRC’s online data analysis tool.

Monday, February 02, 2015

Premarital sex and women in Georgia


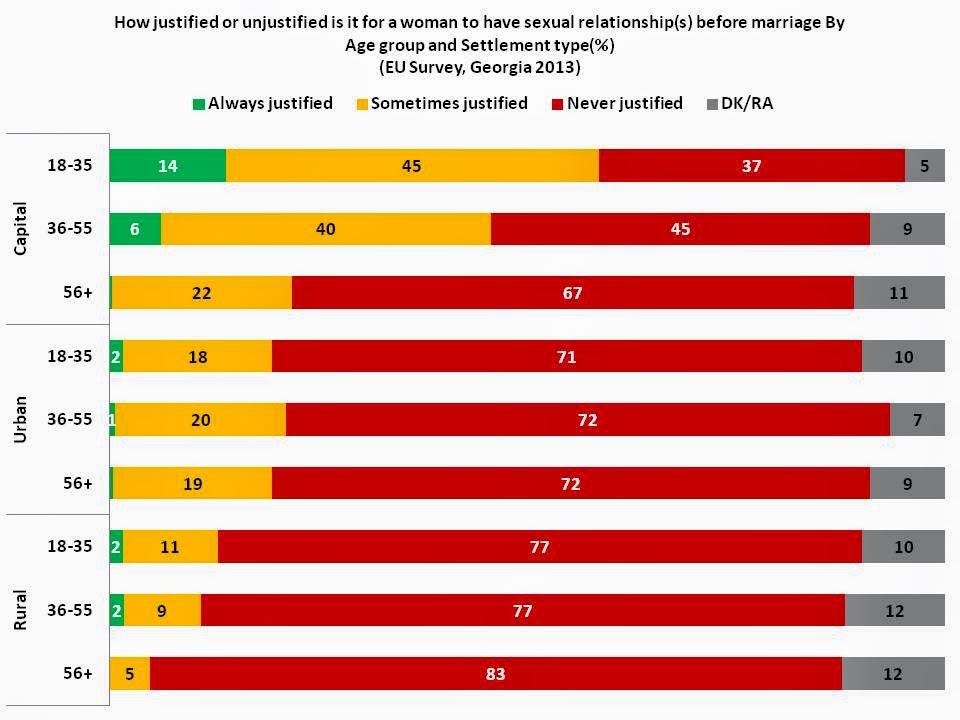
Conservative traditions have always been strong in Georgian society, and especially so when it comes to relationships. Nonetheless, men are often allowed and even encouraged to engage in premarital sex, while it is usually considered unacceptable for women. Using data from the survey Knowledge and attitudes towards the EU in Georgia (EU Survey) funded by the Eurasia Partnership Foundation and conducted by CRRC-Georgia in 2009, 2011 and 2013, this blog post looks at who reports more liberal views in regard to premarital sex in Georgia – men or women – and whether there are any differences in attitudes based on respondent age, level of education, or settlement type.

Attitudes towards premarital sex are changing in Georgia. In 2009, when asked, “How justified or unjustified is it for a woman to have sex before marriage?” 78% of Georgians reported that it is never justified. In 2013, 69% reported the same. In contrast, a much lower share of the population thinks that premarital sex is never justified for men – 39% in 2013, slightly up from 33% in 2011.

While dominant values, religion, and patriarchy engender many stereotypes about gender in Georgia, women also play an important role in maintaining them. A slightly higher percentage of women than men reported in 2011 that it is never justified for women to have premarital sex (70% and 58% respectively) while in 2013 and 2009 the percentages are almost equal.


Counter-intuitively, the younger generation (18-35 year olds) in Georgia disapproves of premarital sex for women to almost the same extent as older generations. As shown in the chart below, 18-35 year old Georgians are nearly as likely as 36-55 year olds to report that it is never justified for women to have sex before marriage. The youngest age group, however, is slightly less likely to report disapproval compared with Georgians who are 56 years old and older.


Residents of the capital are the least conservative on this issue, but rates of disapproval have declined both in and outside the capital since 2009.  In 2013, only 48% of Tbilisians thought that premarital sex was never justified for women compared with 65% in 2009. In non-capital urban settlements, disapproval declined slightly from 83% in 2009 to 71% in 2013. Rural residents are the most conservative, with 79% thinking that premarital sex for women should never be justified in 2013, but some change can be seen over the years in rural settlements as well – in 2011 and 2009, 88% of rural residents reported that women having premarital sex is never justified.


Education also plays a role in forming Georgians’ attitudes towards controversial issues. In 2013, 63% of those with higher education believed that premarital sex was never justified for women, while 81% of those with secondary technical and 84% of those with secondary or lower education reported the same.

To sum up, level of education, age and settlement type are important to consider when examining Georgians’ attitudes towards premarital sex. Although Georgians generally disapprove of women having premarital sex, attitudes appear to be changing.

Monday, January 26, 2015

Well-being of the elderly in the South Caucasus: A problem today, a bigger problem tomorrow

The world population is getting older, and this trend will likely continue as a result of decreasing mortality and declining fertility. International organizations predict that the aging of the population will cause economic problems in countries that already have difficulties in providing proper welfare for the elderly. The countries of the South Caucasus are no exception in this regard. According to the Global AgeWatch Index, by 2050, the population over the age of 60 will exceed 30% in Armenia and Georgia and reach nearly 26% in Azerbaijan, compared with, 14.7% 20.1%, and 8.8%, respectively, at present. This blog post examines the demographic composition and economic situation of the elderly in the South Caucasus countries based on 2013 CRRC Caucasus Barometer (CB) survey data. The post focuses on people who are at or above the standard retirement age (63 years old or older for men and women in Armenia, 59.5 years old or older women and 62 years old or older men in Azerbaijan, and 60 years old or older women and 65 years old or older men in Georgia), and when asked about their primary activity or situation, report that they are retired and not working. This group constitutes 12% of all respondents in CB 2013, and will be referred to as the ‘elderly’ throughout the blog post. The elderly who are at or above retirement age, but still work, are not included in the present writing. After examining the amounts and sources of income the elderly have, the blog reviews self-assessments of whether that income is enough to cover basic needs. 

In all three South Caucasus countries, citizens receive an old age pension, regardless of whether they worked or not. In Armenia and Georgia, the average pension (USD 63 and USD 81, respectively) is close to the official subsistence minimum (USD 65 and USD 79, respectively), while in Azerbaijan the average pension (USD 190) is somewhat higher than the subsistence minimum (USD 160). It should be noted that cost of living is also higher in Azerbaijan. As pensions are close to the subsistence minimums, a very low income level, the economic condition of the elderly is challenging. 

According to CB 2013, more than half of the elderly in Armenia and Azerbaijan, and two thirds in Georgia are women, which can be explained by the shorter life expectancy for males. In Azerbaijan and Georgia, more old people live in rural areas than in Armenia, and more than 40% of them in Azerbaijan and Georgia are widowed, compared with 34% in Armenia. Sixteen percent of the elderly in Georgia live alone, compared with 12% in Armenia and 7% in Azerbaijan. It is probably, in part, due to this last finding that elderly household income in Azerbaijan is higher than in other countries – the last month’s household income for more than 70% of Georgian and Armenian elderly was USD 250 or lower, while in Azerbaijan 70% had more than USD 250. Salaries were named as a source of household income by the Azerbaijani elderly more often than in Armenia and Georgia, likely because they are less likely to live alone. 

Note: The chart only shows the percentage of “Yes” responses for the five most frequently named sources of income.

When asked to rate their households’ economic situation on a ten-point scale, the majority of the elderly in all three countries named middle and low positions – codes “5” or lower. The elderly in Armenia assessed their households’ economic situation worse than in Azerbaijan and Georgia. In Armenia 52% of the elderly state that money is not enough for food while, 26% and 39% in Azerbaijan and Georgia report the same.

The poor economic situation of the elderly is further demonstrated by their need to borrow money for regular expenses. The elderly in all three countries report borrowing money for food, although, Georgians and Azerbaijanis do so less frequently than Armenians. Nearly a third of the elderly in Armenia say they borrow money for food at least monthly, while only 15% in Azerbaijan and Georgia say the same. The elderly in all three countries are less likely to borrow money to pay for utilities than to buy food.

Besides borrowing money for food and utilities, the elderly report limiting their consumption of certain products. Although such limitations are characteristic of all age groups, the elderly are more likely to do so compared to the rest of the population. Most elderly people state that they limit their consumption of meat and fish. Nearly half of Armenia’s elderly say they also limit consumption of butter and milk, while only 21% of Azerbaijanis and 31% of Georgians report the same. Armenians are also much more likely to limit consumption of fish, fruits and vegetables.

Thus, the economic condition of the elderly in the South Caucasus countries is unsatisfactory. Most of the elderly, especially in Armenia, state that their income is not enough for food and utilities. Consequently, they have to borrow money and limit consumption of certain products. This can be considered a cause for concern, especially as the share of the elderly population will increase in the upcoming decades, and the state will face further economic challenges without having worked out those of today.