Monday, September 14, 2015

The Georgian public on journalists


Over the last month, a number of scandals have emerged on the Georgian media landscape. On August 7th, Rustavi 2, a national television station often associated with the previously governing United National Movement (UNM), had its assets frozen in response to Kibar Khalvashi’s claim that he was wrongfully denied his ownership rights of the station during the UNM’s governance. More recently, cancellation of two political talk shows was announced on Imedi TV, another national station, owned by Badri Patarkatsishvili’s family. Imedi later stated that it was not cancelling the talk shows. Two weeks ago, it was announced that two more political talk shows face cancellation (see here and here). Suspicions have been voiced that these cases are related to the upcoming 2016 Parliamentary elections. Considering the recent scandals, an understanding of how Georgians view journalists is important as the public’s view of them proxies the public’s trust in the media they consume. This blog post takes a look at attitudes towards journalists reported during the May 2015 Transparency International – Georgia public opinion poll, conducted by CRRC-Georgia.

On the whole, Georgians are quite ambivalent about journalists. To start, more than half of the Georgian population reports that they neither trust nor distrust journalists. This response is more or less equally characteristic for various segments of Georgian society, with roughly half of the representatives of every education level, age group, settlement type, and gender reporting so. Slight differences are present – those with at least some tertiary education, the young, and Tbilisi residents are all slightly less trusting of journalists than those who are less educated, older, and live outside the capital. Georgians report neither trusting nor distrusting journalists more often than representatives of any of the other professions or institutions asked about on the survey, including judges, police, doctors, teachers, NGOs, the President, Parliament, Prime Minister, and local government. Slightly more Georgians, though, report trusting journalists than distrusting them (25% versus 18%).


Note: The original five-point scale was recoded into a three-point scale. “Fully trust” and “Trust” were combined into the category ‘Trust’ on the chart above, while “Fully distrust” and “Distrust” were combined into ‘Distrust.’ “Neither trust nor distrust” was not recoded. Education levels were also recoded. ‘Secondary or lower’ includes individuals with only primary education, some secondary education, and completed secondary education. ‘Tertiary education’ includes those with some higher education, Bachelor’s degrees, Master’s degrees and PhDs. ‘Secondary technical’ education was not recoded.

The wide spread “neither trust nor distrust” attitude must in part stem from the perception that journalists in Georgia lack independence and are not working with the average person’s interests in mind. Half of the Georgian population believes that “Georgian journalists, as a rule, protect the political interests of the owners of media outlets,” though different people may have different attitudes to this issue. In addition, only a third of the public agrees with the statement that “Georgian journalists, as a rule, represent the interests of people like [me]”, and 32% agree with the statement that “Georgian journalists cover events superficially”. On a bright note, however, twice as many Georgians agree with the statement “Georgian journalists are highly professional” compared with those who disagree.


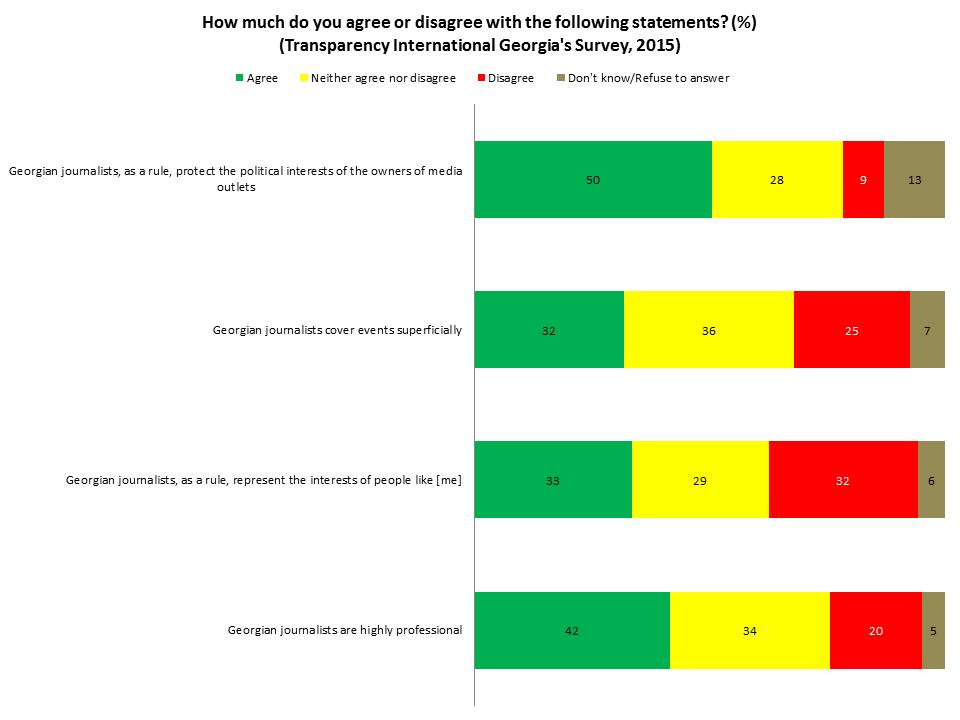
Note: Originally, the responses were recorded on a five-point scale where code 1 meant “Fully disagree” and code 5 meant “Fully agree“. For the chart above, codes 1 and 2 were combined into ‘Disagree’ and codes 4 and 5 were combined into ‘Agree.’ ”Neither agree nor disagree” was not recoded.

The findings suggest the journalists in Georgia need to work with the interests of ordinary people, not the owners of media outlets, in mind. If they do so, the population’s trust towards them will likely increase. To learn more about Georgians’ attitudes towards the media, have a look at the findings of the Media survey in Georgia here.

Monday, September 07, 2015

The public on the conflicts in the South Caucasus


On July 18, 2015 thousands of Georgians gathered in Tbilisi protesting Russia’s “creeping occupation” as South Ossetia based Russian troops continue to draw the border along the Administrative Border Line between Georgia and the occupied territory of  South Ossetia. The unresolved territorial conflicts over South Ossetia, Abkhazia, and Nagorno-Karabakh are major sources of instability in the South Caucasus. These conflicts are often referred to as ticking bombs, and despite numerous common challenges, the region is claimed to be “more divided than united” mainly because of these conflicts and because of the competing interests of regional powers – Russia, Turkey and Iran. All three South Caucasian states have different political relations with these states and towards the West.

In 2013, CRRC’s Caucasus Barometer survey asked the populations of the countries of the South Caucasus about their opinions on the territorial disputes in their own and in neighbouring countries – namely, the conflicts over Abkhazia and Nagorno-Karabakh. This blog post looks at the findings.

Assuming that the population of each country was informed about the conflict in their own country, the populations of Armenia and Azerbaijan were asked if they had heard about the conflict in Abkhazia, while the population in Georgia was asked if they had heard about the conflict in Nagorno-Karabakh. Only those who reported having heard about these conflicts were asked follow-up questions. The data shows that a larger share of the Georgian population has heard about the conflict in Nagorno-Karabakh (62%) compared to the shares of the populations of Armenia and Azerbaijan that have heard about the conflict in Abkhazia (49% and 43% respectively).

In respect to each conflict, questions about potential solutions were asked. Speaking about Armenians’ attitudes towards possible solutions of the conflict in Abkhazia, Armenians most commonly think Abkhazia should be an independent country (46%). The next most commonly held view was that Abkhazia should be a part of Russia (26%). Only 7% of Armenians would favor Abkhazia as a part of Georgia.

Note: The question was asked to the 49% of Armenians who reported having heard about the conflict in Abkhazia.

In contrast, the Azerbaijani public most commonly would favor having Abkhazia as a formal part of Georgia (77%) and 12% would support the idea of having Abkhazia as an independent country. Less than 1% would favor having it as a formal part of Russia.

Note: The question was asked to the 43% of Azerbaijanis who reported having heard about the conflict in Abkhazia.

The Georgian population is overwhelmingly in favor of having Abkhazia as a formal part of Georgia without autonomy (73%), and 33% believe it should have a high degree of autonomy within Georgia. Only 3% favors Abkhazia as an independent country.


The opinions over the conflict of Nagorno-Karabakh differ across the countries as well. Given that Armenia and Azerbaijan are the two sides involved in the Nagorno-Karabakh conflict, it is unsurprising that the populations of these countries express radically different opinions about the possible future of this conflict. Armenians most commonly would favor having Nagorno-Karabakh as a formal part of Armenia (73%). More than half (54%) would also favor having it as an independent country, but would find it absolutely unacceptable for Nagorno-Karabakh to be a part of Azerbaijan.


The absolute majority (95%) of Azerbaijanis would favor having Nagorno-Karabakh as a formal part of Azerbaijan. Notably less – only about a third of the population – would favor the scenario of having Nagorno-Karabakh with a high degree of autonomy within Azerbaijan. Unlike Armenians, Azerbaijanis do not at all favor having Nagorno-Karabakh as an independent country.


As for the Georgian public’s attitudes towards possible solutions of the conflict over Nagorno-Karabakh, slightly less than half of Georgians who reported they have heard about this conflict either could not answer the questions about the future status of this territory, or refused to answer the questions. As for the rest, more people would favor having Nagorno-Karabakh as a formal part of Azerbaijan (26%) than of Armenia (9%).

Note: The question was asked to the 62% of Georgians who reported to have known about the conflict in Nagorno-Karabakh.

This blog post looked at how public opinion on territorial conflicts in the region varies across the South Caucasian states. Overall, Georgian and Azerbaijani public opinion on the preferences about the future of Abkhazia is more similar than the public opinion in Armenia. As the opinions over the status of Nagorno-Karabakh, Azerbaijani public attitudes are sharper than the attitudes of Armenians, while Georgians largely avoid reporting their opinions, or do not have any. Yet, notably more Georgians which do have opinions about the possible solution of the conflict in Nagorno-Karabakh are in favor of having Nagorno-Karabakh as a formal part of Azerbaijan than of having it as a formal part of Armenia. Considering the geopolitical realities, these findings are not surprising. Georgia and Azerbaijan are in a quite similar situation, as both have lost territories, while Armenia de-facto controls Nagorno-Karabakh with Russia’s support. As Svante Cornell et al. (2005) argue in their work on South Caucasian conflicts, the conflict in Abkhazia has the same symbolic importance for Georgia as the conflict in Nagorno-Karabakh has for Azerbaijan, as both countries were defeated in these conflicts against a numerically much smaller enemy relying on external support, while Armenia feels less urgency to find a solution and is interested in preserving the military status quo.

To learn more about public opinion on the conflicts in the South Caucasus, take a look at CRRC’s earlier blog posts, When is a war not a war?, Nagorno-Karabakh: Prospects for difficult reconciliation (Armenia) and Engagement without recognition? and check out our Online Data Analysis platform.

Monday, August 31, 2015

Home appliances in the South Caucasus: Purchasing trends, 2000-2013


A fair share of the Armenian, Azerbaijani and Georgian population still lives in poverty and cannot afford to buy certain durable goods. According to CRRC’s 2013 Caucasus Barometer survey (CB), in Georgia, 28% of the population reported they did not have enough money for food; 33% had enough money for food, but not for clothes, and for 31% there was enough money for food and clothes, but not for durables. Only 7% of the population reported they could afford to buy durables, and a further 2% said they had enough money to buy anything they needed. The situation is similar in Armenia, but slightly different in Azerbaijan where less people report not having enough money for food (22%).

Using data from CB 2013, this blog post looks at ownership of washing machines, refrigerators and air conditioners in Armenia, Azerbaijan and Georgia, and, if the respective item was purchased in 2000 or later, when it was purchased.

Of the three durables we discuss in this blog post, refrigerators are the most widely owned (by 94% of households in Azerbaijan, 79% in Armenia and 78% in Georgia). Approximately half of the households have at least one automatic washing machine in Azerbaijan and Georgia, while the respective share is a bit higher in Armenia. Only a small share of households in Armenia and Georgia has at least one air conditioner, while the respective share is reported to be much higher in Azerbaijan (29%). Unsurprisingly, in all countries, the ownership of these appliances is higher in the capitals compared to other settlements.


Analysis of the time of purchase of these household appliances in Georgia shows growth in purchases from 2000 until 2008, followed by a decline that may be connected to the 2008 world economic crisis. In 2010, the purchases increased and then dropped again in 2011. In 2012, air conditioner purchases increased, while washing machine purchases dropped and refrigerator purchases remained stable. Less air conditioners and automatic washing machines were purchased in 2013.

Importantly, as shown in the chart below, the changes in the shares of the households purchasing these appliances coincided to a certain extent with the dynamics of GDP per capita, with the exception of 2013, when GDP per capita increased slightly compared with the previous year, while purchases of washing machines and air conditioners dropped.


Note: In 2001 and 2002, approximately the same shares of households purchased refrigerators, washing machines and air conditioners in Georgia.

In Armenia, the purchasing patterns of these appliances follow a trend similar to Georgia, with one exception: purchases of air conditioners increased in 2013.


Azerbaijan was also affected by the world economic crisis. However, GDP per capita continued to increase after 2009, while purchases of household appliances decreased. A possible explanation here might be that the GDP growth in Azerbaijan is connected to natural gas and oil sales. Hence it most likely reaches economic elites and less so the general population and its purchasing power.


To sum up, there are still many households in the region who do not own certain household appliances e.g., automatic washing machines and air conditioners. Residents of the capitals are better equipped with these appliances than people living outside the capitals.

To explore this topic more, have a look at the Caucasus Barometer data, here.

Monday, August 24, 2015

Internet and social media usage in Georgia


In April-May 2015, CRRC-Georgia carried out a representative survey of the adult population of Georgia for Transparency International Georgia. The survey contained a number of questions on Internet and social media usage, and the results show us who is online, what people are doing online, who is using social networks, and which networks people use most.

The young, educated, Tbilisi residents, and employed report using the Internet more frequently than other Georgians. Most of Georgia’s elderly (56+) never use the Internet - only 19%, 7% and 5% of them in the capital, other urban and rural settlements (respectively) report using the Internet on a daily basis. The most vociferous Internet users are by far 18 to 35 year olds with a full 81% of them in the capital, 61% in other urban settlements and 39% in rural settlements reporting using the Internet every day. Only 1% of Georgians have never heard of the Internet, lower than in previous surveys which showed that as much as 6% of Georgians had not heard of the Internet. Notably, 46% of the population reported never using the Internet.


Those who report using the Internet at least once a month – we refer to them as regular Internet users (43% of the adult population) – were asked a number of questions about what they do online. As results show, when online, most are using social networks. In a distant second, regular Internet users report searching for information or news through means other than social media. Less, but roughly equal shares of them reported their most often online activity as either emailing or downloading /listening to/watching movies, music or videos.


Note: Only those who use the Internet at least once a month were asked this question. Each respondent could select up to three answer options.

Roughly nine out of ten regular Internet users in Georgia use either Facebook, Twitter, Odnoklassniki or VKontakte – or some combination of these social networks – at least once per week. This means that approximately four in ten Georgian adults regularly use a social network. As far as specific social networks go, Facebook is by far the most popular in Georgia –79% of regular Internet users are on Facebook at least once a week. The next most popular social networking site is the Russian Odnoklassniki; rather small shares of Georgians use VKontakte and/or Twitter on a regular basis.


The data shows three major patterns of social network choice by regular Internet users in Georgia – Russian networks only, American networks only, and a mix of both. The Russian only users are the smallest share of users (9% of regular Internet users) followed by American only network users (36%). A plurality (43%) of regular Internet users are on a Russian and American social network at least once per week.

The American only users are heavily concentrated in Tbilisi (68%) compared with the mixed and Russian network only users who are more evenly distributed throughout the country. The American only users are also more affluent being both more highly educated and having higher household incomes.

What trends have you noticed on social media use in Georgia? Join the conversation here on our Facebook page.

Monday, August 17, 2015

An interesting implication of the 2014 census: Georgia is likely an upper middle income country


While Georgia has yet to be officially declared an upper middle income country by the World Bank, as a result of the 2014 census, it’s likely to be labeled one after the final census results are published in April of 2016. Interestingly, Georgia likely became one in 2013. Why is this the case and what are the implications? Let’s take a look using the 2014 preliminary census data and a population model developed by Ilia State University’s Giorgi Tsuladze published in a 2014 United Nations Population Fund (UNPF) and International School of Economics at Tbilisi State University (ISET) report.

The 2002 census was way off

In 2002, the Georgian government carried out a population census and found that there were 4.37 million Georgians. This number though was and is widely considered to be suspect. According to the 2014 UNPF report (and notably, Geostat employees at the time), the main problem with the 2002 census was its method of counting the migrant population. Specifically, the 2002 population count included 114,000 migrants who may have been permanently settled abroad rather than temporarily. This number may have been even higher considering that an estimated one million Georgians left the country between 1990 and 2002. Their family members who were interviewed for the census may have been reluctant to report that their relatives had gone abroad and instead reported them as temporary migrants or still in the country for a variety of reasons.

Not only was the census off, but so too were the civil registries which count birth and death registration. Between censuses, governments update population counts based on birth and death registrations, but because many births in Georgia happened and to a certain extent still happen outside of hospitals, births are not always registered. Also important are the lack of death registrations.

Recognizing these problems, Giorgi Tsuladze, a Professor at Ilia State University, made a downward adjustment of the population figure from the 2002 census, an upward adjustment to the birth rate, and a decrease in the estimate of the average life expectancy to estimate the population. In turn, his estimates of the population are quite close to what the preliminary 2014 census results tell us about the Georgian population – there are about 3.7 million people in Georgia (excluding South Ossetia and Abkhazia).


Geostat population estimate (thou.) Tsuladze population estimate (thou.)
2002 4,372 4,001
2003 4,343 3,966
2004 4,315 3,931
2005 4,322 3,899
2006 4,401 3,869
2007 4,395 3,839
2008 4,382 3,814
2009 4.385 3,797
2010 4,436 3,790
2011 4.469 3,786
2012 4,498 3,777
2013 4,484 3,768

Source: Tsuladze, G.; N. Maglaperidze and A. Vadachkoria. 2002. Demographic Overview of Georgia. Tbilisi, UNFPA. Cited in
Hakkert, Ralph, Gulnara Kadyrkulova, Nata Avaliani, Eduard Jongstra, Lasha Labadze, Maka Chitanava, and Nino Doghonadze. Population Situation Analysis (PSA) 2014. Rep. Tbilisi: United Nations Population Fund, 2015. Print.

Income classifications

The second important part of this story is understanding how countries are classified into income groups. The World Bank classifies countries by Gross National Income per capita (slightly different than Gross Domestic Product per capita – see here for exact definitions).

Countries with a per capita GNI of less than $1,045 are considered low income countries. Countries with greater than $1045, but less than $4,125 GNI/capita are classified as lower-middle income countries. Countries below $12,736 but above $4,125 GNI/capita are considered upper middle income countries, and countries above the $12,736 mark are considered to be upper income countries.

Since, a country’s income classification is based on the size of its population, and as we saw above, Georgia’s official population size was inflated by a fairly sizable margin for the past twelve years, Georgia’s GNI per capita (as well as GDP per capita) was underestimated.

Georgia probably moved from the lower-middle income to the upper-middle income grouping in 2013 when GNI per capita moved from from $3914 in 2012 to $4240 in 2013 (based on Tsuladze’s population estimates). In 2014, using the preliminary census data, Georgia’s GNI was $4489/capita. Hence Georgia has very likely moved income groups, barring a major miscount of the preliminary census data of roughly 330,000 people.


Why does this matter?

Well, it is good and bad news for Georgia.

To start with the bad, aid is sometimes distributed based on a country’s economic status. There are many other important factors at play (see here for a discussion of the subject), but nonetheless it is often considered in aid decisions. Hence, Georgia may expect lower levels of aid in the coming years as its per capita economic statistics are adjusted upward following the finalization of the 2014 census in 2016.

When it comes to the good news for the country, Georgians are doing better than the numbers suggested. This does not change the facts on the ground and widespread poverty experienced in Georgia, but in the long run it can lead to a number of benefits. For instance, foreign private capital flows may increase as the country may be perceived as a more enticing investment environment, having moved to a higher income category.

The upward adjustment will also be important for Georgia’s Euro-Atlantic integration prospects. One of the key factors which the EU has identified as a barrier to prospective membership for countries in its neighborhood is low income levels, and as Georgia’s income level gradually increases, it will make Georgia a more attractive partner country. Notably, the lower population also means that per capita income is increasing at a higher rate than previously thought. In the short term, it may also help ease fears over migrant flight from Georgia (which is likely an inhibiting factor at present for Georgia in the EU visa liberalization process). It is important to note that if income inequality persists in Georgia, economic growth is unlikely to deter migrants from attempting to make their way to the EU, though a fuller treatment of this subject is beyond the scope of this post.

On the grand scheme of things, the adjustment is good as well. While not necessarily good for Georgia, countries in more dire straits may receive more aid that would have been aimed at Georgia. Better decisions about what kind of aid the country receives may also result from the more accurate data and income categorization.

Although we should not expect to see the official income categorization change to upper-middle until after Geostat has published the final census numbers and adjusted its population estimates for 2002-2014, it should occur in the next few years.

To take a look through the preliminary 2014 census results, take a look here, and for the estimates of the population size which this blog is based on as well as other interesting data and analysis on Georgia’s demographic situation, take a look at the UNPF/ISET report, here. Notably, Georgia is not the first and surely not the last country to have a major economic indicator readjustment based on something besides economic growth. Ghana and Nigeria both have had large changes to their economic indicators in recent years caused by how GDP was calculated rather than growth with interesting implications. Listen to this Planet Money story to find out more.

Saturday, August 08, 2015

What do CB interviewers’ ratings of respondents’ intelligence tell us?


CRRC’s Caucasus Barometer (CB) surveys regularly collect information about how the interviewers assess each of the conducted interviews – so called paradata that provides additional insight into the conditions surrounding the interviews (e.g., whether someone besides the respondent and the interviewer was present during the face-to-face interview), as well as interviewers’ subjective assessments of, for example, level of sincerity of the respondents. This type of knowledge is especially important not only because the populations of the South Caucasus countries often distrust polling and pollsters (Hayes et al., 2006), but also because the conditions during the face-to-face interviews are rarely perfect in the region. The latter usually stems from objective reasons, like, for example, crowded dwellings (especially in the winter, when families normally heat only a few rooms, where all household members tend to gather). This blog post looks at the information provided by CB 2013 Interviewer Assessment Forms in Armenia, Azerbaijan and Georgia, trying to determine whether there is a bias in interviewers’ assessments. Specifically, we will have a look at interviewers’ ratings of respondents’ intelligence.

Overall, CB interviewers tend to rate the majority of respondents as average to (moderately) intelligent, but rarely as “very intelligent”. Interestingly, Georgian interviewers’ ratings are more skewed towards the positive edge of the scale, compared to those in Armenia and Azerbaijan.


Note: The data was not weighted for the analysis performed for this blog post. 

These figures, of course, in no way provide objective assessments of the intelligence of the respondents – neither was it the aim of this exercise. We will now look at how these assessments correlate with respondents’ answers on their basic socio-economic characteristics, including gender, age and level of education.

In all countries, there is a strong positive correlation between interviewers’ assessment of intelligence of the respondents and the two variables measuring respondents’ level of education - highest level of education achieved by the respondent, and the years s/he spent in formal education. The strength of correlation is somewhat stronger in Azerbaijan (.549 for the first variable) and somewhat weaker in Georgia (.455) and Armenia (.468).

Azerbaijan is the only country where, according to CB 2013, there is a relatively weak, but significant correlation between interviewers’ assessment of respondents’ intelligence and the respondents’ gender (-.192), suggesting that there is a systematic tendency to rate male respondents’ intelligence higher than that of females’. This finding is all the more interesting since a bit over half of CB2013 interviewers in Azerbaijan were female (22 male interviewers, 24 female interviewers). In all countries, there is a tendency to rate the intelligence of those living in the capital cities higher than those living in other settlements – the respective correlation coefficients are not high (-.094 in Azerbaijan, -.119 in Georgia and -.155 in Armenia), but are significant. There is, however, no correlation between these assessments and respondents’ age.

Interviewers’ ratings of respondents’ intelligence do not seem to be straightforwardly related to the attitudes towards democracy, or reported trust towards major social and political institutions, although respective findings differ by countries. It’s only in Georgia that we can see weak, but negative correlation between trust towards the president of the country and assessment of respondent’s intelligence by interviewer (-.141), while the correlations between these variables are not significant in Armenia and Azerbaijan.  

What other variables might, in your opinion, affect an interviewer’s assessment of a respondent’s intelligence?

You can have a look at CB’s Interviewer Assessment Form at the end of each CB questionnaire, e.g., here; and, of course, you can learn all about CB data on CRRC’s Online Data Analysis tool.


Sunday, August 02, 2015

Citizenship in action in the South Caucasus


Citizenship is a difficult concept to define as its definition changes over time, depending on social, legal, and political contexts. Importantly, it not only encompasses structural (legal and institutional) aspects, but also the everyday practices through which people relate to the state and other citizens. This blog post examines some of the perceptions as to what makes a good citizen across the South Caucasus and the extent to which people’s actions match up with their stated opinions on good citizenship.

CRRC’s 2013 Caucasus Barometer survey asked people in Armenia, Azerbaijan and Georgia to rate the importance for good citizens to take various actions, such as voting, obeying laws, following traditions and volunteering, on a scale from 1, not at all important, to 10, extremely important.

There are similarities between what people prioritize in all three countries. In Armenia, the three actions people considered to be most important (i.e. those with the highest mean score) were voting in elections, following traditions and helping those who are worse off, while Azerbaijanis prioritized always obeying laws, following traditions and voting. For Georgians, the top two actions were following traditions and voting, immediately followed by supporting people who are worse off and always obeying laws. It is important to note that people in these countries usually tend towards positive ratings when offered these types of scales during surveys, hence very high average scores observed in the chart below are not very surprising – while relatively low mean scores (e.g. in the cases of doing volunteer work and being critical towards the government) strongly indicate that public opinion considers these qualities unimportant or even irrelevant.


Note: Answer options “Don’t know” and “Refuse to answer” are excluded from the analysis through this blog post.

The Caucasus Barometer also asked respondents about their activities over the last six months, some of which correspond to the actions that were rated as highly important for being good citizens, including voting, volunteering and helping those who are worse off. Let’s see how much the population of each of the countries reports engagement in these activities.

With voting, strong support – in terms of considering it very important for being a good citizen – in all three countries is backed up by a high proportion of people who report casting a vote in the last national elections. However, it should be kept in mind that participation in elections is traditionally overestimated in survey results, most probably due to social desirability bias, and in this case the same bias is likely to have influenced answers to the question on the importance of voting.

For actions that involve greater participation and commitment, such as volunteering, the story is more complicated. Georgia, where the highest proportion of people said it was extremely important for good citizens to volunteer, in fact had the lowest proportion of people who had volunteered in the past six months: 19% compared to 31% in Armenia and 23% in Azerbaijan. However, those who rated volunteering as being important for being a good citizen were slightly more likely to have volunteered. A similar trend is observed in Armenia and Azerbaijan.


Note: Only the answers of those who reported to have volunteered in the last six months are shown. A 10-point scale was used to record respondents’ answers to the question, “How important or unimportant is it for a good citizen to do volunteer work meeting the needs of the community without expecting any compensation?” Code 1 corresponded to the answer “Not important at all,” and code 10 corresponded to the answer “Extremely important.” For the analysis, this scale was re-coded into a 2-point one, with original codes 1 to 7 corresponding to “less important or unimportant,” and codes 8, 9 and 10 – “important”.

As for the final activity, helping people who are worse off, there was no exact match among the questions asking about activities over the last six months. However, answers to the question whether people had contributed to charity, including giving money to beggars, can provide a rough approximation to whether they have helped someone who is worse off. It may be because of not having an exact matching question that this was one activity that showed a big difference between what was reported as important but practiced only by fewer than half of the population in each country who reported having contributed to charity, with Armenia having the highest proportion of people who did so.

The findings discussed in this blog post suggest that there are certain discrepancies between the actions that people say are important for being good citizens and whether they themselves engage in those activities. This is especially so for those activities that require a larger commitment, such as volunteering.

You can find full data from the Caucasus Barometer surveys on our Online Data Analysis tool.

Monday, July 27, 2015

Finding work in Armenia and Georgia


With official unemployment rates in 2014 running at 17.6% and 12.4% in Armenia and Georgia respectively, a World Bank analysis in both countries suggests that the labor markets of these countries suffer from a skills shortage. The World Bank’s STEP Skills Measurement Program gathers information on the supply and distribution of people’s skills, and the demand for these skills in low-income countries’ labor markets, interviewing a representative sample of adults aged 15 to 64 living in urban areas. This blog post looks at the World Bank’s STEP data for Armenia and Georgia, which CRRC collected in 2013, to see how people are finding work, their confidence that they have the skills needed to find work, and how they feel their education prepares them for work.

Interestingly, in both countries, a plurality of employed people reported relying on their social networks (friends/relatives/other) to find a job (37% in Armenia and 45% in Georgia). Also reflecting the informal nature of the job market in both countries, the next most common method was to contact the employer directly: 26% in Armenia and 18% in Georgia.


Note: The chart presents only answers of those who reported they had worked in the previous 7 days and shows the percentage of those reporting having used a given method.

Both employed and unemployed were asked whether they thought they possessed various qualities or knowledge that would help them when looking for work. People appear to be very confident in respect to certain skills – for example, 92% of Armenians and 81% of Georgians thought they would perform well in a job interview. However, the share of those who felt they had the necessary work experience was much lower – 60% Armenians and 58% Georgians thought so. In both countries, few believed they had the means to start their own business: 7% in Armenia and 13% in Georgia.


Note: The chart shows only the percentage of those reporting having a given skill or resource.

A very important issue the World Bank reported about for both Armenia and Georgia was the high level of unemployment in these countries despite a (formally) highly educated workforce. Indeed, in both countries, around half of those who have a bachelor’s degree had not worked. The World Bank report for Georgia concludes that the highly educated population does “not have the skills needed in the labor market … many Georgian employers complain that hiring workers with the required skills is difficult.” Similarly, for Armenia, the WB notes that “despite the high availability of labor and these high educational levels, Armenia’s employers are struggling to find the right workers, which seems to point to a problem of skills in the labor force.”


Note: The chart only shows the answers of those that answered ‘No’ to the question “During the past 7 days, did you work for at least an hour for wage or salary in cash or in kind OR work on your own account for profit or family gain OR work in a family business or on a farm?”

Only around half of those who had worked in the week preceding the survey (42% in Armenia and 37% in Georgia) think their formal studies were “very useful” for their job. The rest, however, are not so sure about this.


Note: The chart only shows the answers of those that answered ‘Yes’ to the question “During the past 7 days, did you work for at least an hour for wage or salary in cash or in kind OR work on your own account for profit or family gain OR work in a family business or on a farm?”

Further analysis of the World Bank data could help to uncover whether this is because people’s skills are being underutilized – for example, by having to take jobs that are at a lower skill level than they are qualified for – or if they believe their education does not provide job-relevant skills. Potentially, there could have been other reasons as well.

The full STEP survey datasets for Armenia and Georgia are available from the World Bank website.


Thursday, July 16, 2015

The population of Georgia on the ideal number of children per family

Many factors determine the size of families, including economic, cultural and social influences. Not surprisingly, people’s considerations about its “ideal” size do not often match the reality. In this blog post, we shall have a look at whether Georgians’ views about the ideal number of children per family meet the reality, and how these views differ according to people’s sex, age and settlement type, using data from CRRC’s Caucasus Barometer survey in 2013.

In response to the question, “What do you think is the ideal number of children per family in Georgia?” there is no statistically significant difference in responses by sex: 47% of women and 45% of men consider three children to be ideal. 

Although the same is true for representatives of all age groups, younger people are more likely to think that smaller family sizes are better. Among the 18-35 age group, 21% say two children is the ideal number, compared to 11% for 36-55 year olds and just 6% in the 56+ age group. On the other hand, twice as many over-55s prefer four children than do 18-35 year olds (34% compared to 16%), and just 4% of both 18-35 year olds and 36-55 year olds think the ideal family has five children, whereas 10% of over-55s do so, with a further 3% thinking six or more children would be best.


Note: Responses “Don’t know” and “Refuse to answer” were excluded from the analysis throughout this blog post. 

The Caucasus Barometer data also shows that attitudes to family size change based on where people live, with a slight preference for bigger families in rural settlements, while in the capital and other urban settlements more than half of people think three children is ideal. 


There is also a strong preference for two or three children among women aged between 18 and 35 – the main childbearing age group, – of whom 77% think so. 


How do actual family sizes match up to this? Figures from Geostat, Georgia’s national statistics office, show that although the number of first children being born has been decreasing in Georgia since 2009, there is an overall rising number of births, that should be attributed to an increase in the numbers of second and third children per family. For instance, in 2006, the share of families’ first children’s births was 61%, second children’s – 28% and third children’s – 9%. By 2014, when the total number of births was much higher, the share of first children’s births had fallen to just 43% of the total, while second and third children’s births comprised 38% and 14%, respectively – the highest levels in any year covered by this data.

This suggests that family size – and, specifically, the actual number of children per families – is edging towards the levels that Georgians say they consider ideal. 

Do you think we’ll soon have most of the Georgian families having three children? Share your thoughts with us here or on our Facebook page

More data from the Caucasus Barometer surveys is available on our Online Data Analysis site. 

Wednesday, July 08, 2015

How do Georgians spend their leisure time?

How much free time people have – and how they choose to spend it – is influenced by multiple factors, with some of the most important being work, family and a person’s stage of life (Roberts et al, 2009; Parker, 1975). CRRC-Georgia’s 2011 Media survey, funded by the Norwegian Ministry of Foreign Affairs, allows us to delve into how Georgians spend their leisure time. To find this out, an open question was asked: “Please tell me how you usually spend your free time in your day-to-day life?” The number of answers respondents could provide was not limited. This blog post looks at how answers differ by age, sex, income and settlement type.

The most popular activities named were watching TV (83%) and spending time with friends or family (49%). A small proportion of the population (5%) said they had no free time at all.


For some, but not all, activities, the survey showed clear differences in the responses of representatives of different age groups. For example, 58% of 18-30 year olds mentioned that they spend their free time with their families, compared to 33% of the over-60 group. The situation is reversed when it comes to gardening, however: just 7% of the youngest age group said they gardened in their spare time, whereas 26% of the oldest age groups (46-60 and over-60s) take care of their yard or garden. Stark differences are also seen in the use of the internet and listening to music. Not much difference is apparent, though, when it comes to reading books, hanging out, sleeping and shopping.


Differences can also be seen in how men and women report spending their spare time. The graph below shows leisure time activities with the biggest differences between men and women. Men are more likely than women to say they spend their free time hanging out (28% compared to 5%), sleeping (16% compared to 10%) or exercising (7% compared to 1%), while women are more likely to report reading books (23% versus 14%) and shopping (11% vs 6%).


The data also enables us to see whether there are any differences in the preferred way of spending free time by household income. As might be expected, the share of those who spend time with friends/family, use the internet and read books is higher when the household income is relatively high, while gardening, for example, is more common in cases of households with a lower income. A previous CRRC blog showed that employed people are more likely than the unemployed to participate in activities which involve socializing, meeting new people and helping others. Those, on the other hand, who said they had no household income are more likely to hang out than any other group.


Activities also differ widely between those living in and outside the capital, Tbilisi. When it comes to going to the cinema or theatre, this could be due to the lack of such an opportunity outside the capital, as theatres and cinemas can be less accessible. Internet access is also more common in the capital, helping explain the difference in use of the internet (34% in Tbilisi vs 14% in the rest of the country). People living outside the capital were less likely to read books than those living in Tbilisi, but more likely to watch TV and read newspapers.


This blog post has looked at the Georgian population’s involvement in particular leisure activities, and how this involvement varies by age, sex, income and settlement type. Further analysis could consider whether these demographic characteristics affect activities that people undertake in their free time that are not commonly categorized as leisure – such as helping neighbors, cleaning public space, or volunteering at church.

For more data, have a look at CRRC’s Online Data Analysis tool.

Sunday, July 05, 2015

How's your internet?


A guest blog post by Dustin Gilbreath and Hans Gutbrod

If you are reading this, maybe your internet isn’t so bad. Maybe it took some time to load this page and while waiting for the page to load, you thought, “It’s bad.” The quality of internet service is a frequent topic of conversation in Tbilisi, where access to the Internet is the highest in Georgia, and satisfaction with the service varies widely. This has motivated a quick online poll – undertaken by Dr. Hans Gutbrod, in March 2015 – on assessments of internet service in Tbilisi. While not a proper random survey, such a poll (conducted with Google Forms) can still be informative, though it will primarily provide the views of people that have time and feel strongly enough to fill out the survey. The questionnaire was distributed on the Megobrebs listserv, newsgroup and via twitter, and was administered in English only. A total of 52 people based in Tbilisi filled out the survey.

What then are the findings?

Thirty four respondents reported experiencing problems with their home internet access, with 16 complaining about regular short interruptions in service; 9 about crawling internet, 10 about outages lasting longer than 5 minutes, and 13 having trouble connecting with multiple devices.

Overall, respondents’ satisfaction with internet service, measured by their willingness to recommend the service to a neighbor, was medium, with a mean of 2.92 points on a five-point scale, with code ‘5’ meaning not willing and code ‘1’ meaning willing to recommend. With all the caveats mentioned above, the numbers seem to suggest that Caucasus Online customers appear to be more satisfied than Silknet subscribers. The latter were slightly over half a point (0.63) less willing to recommend their internet service provider (ISP) to a neighbor willing to pay the same service fee, indicating a lower level of satisfaction. Caucasus Online subscribers also rated the customer service they had received in instances where they encountered a problem 0.74 point higher on average compared with Silknet subscribers.


Note: Respondents’ answers were recorded using five-point scales. For the first question on the chart above, code ‘5’ corresponded to very bad service and code ‘1’ – to very good service. For the second question, code ‘5’ corresponded to the answer ’not willing to recommend the [respective] service to a neighbor’ and code ‘1’ – to the answer ‘willing to recommend the service to the neighbor’.

Interestingly, satisfaction with customer service varies by language used by the respondent to communicate with the company. The 9 respondents who only spoke with their ISP in English rate the service almost a point higher than those who communicated with the ISP in Georgian (19 respondents). The 18 respondents reporting using a combination of languages (Georgian, Russian or English) fall in between the two. Hence, Georgian speakers appear to be the least satisfied with their ISP’s customer service.


ISPs should be wary of the problems. Analysis of the data suggests that those who are less satisfied with their internet service, measured either by satisfaction with customer service or by willingness to recommend the ISP to their neighbors, are also more likely to be considering switching their service provider (Correlation coefficients of r=.47 and r=0.42, respectively). This also indicates that those who experience poor customer service are slightly more likely to leave their service provider compared with those who would not recommend their internet service provider to a neighbor.

The rise of mobile internet provided by cell phone companies in the Caucasus adds yet another angle to the story and is likely to further drive competition in the internet market, which in theory should spur on service improvement. While mobile internet is not a fully substitutable good for land-line services for everyone, it will soon be for many. On the 2013 Caucasus Barometer (CB) survey, the activity Georgians most frequently report doing online was social network usage, something which can easily be done on even a very modest model of a smart phone. While CB 2013 indicated that only 12% of Georgian households had internet access on their mobile phone, the share has undoubtedly increased since, and will continue to increase, in line with the global trend in smart phone ownership in recent years and taking into consideration relatively low prices of mobile internet in Georgia.

It is important to remember the above presented provisional impressions from a quick poll that does not claim to be representative of internet users in Tbilisi. It would take a full-scale survey (at the price of a new car) to get representative and comprehensive findings. For now, the key take away message appears to be that customers who experience poor service – both in terms of quality of internet provision and customer service – are more likely to think about switching their provider. While service providers would be wise to improve their customer service, competition stemming from the rise of mobile internet will also likely lead to increasing quality of service as providers compete for subscribers. Improving customer service in Georgian language should be a priority for companies like Silknet and Caucasus Online, as Georgian speaking customers generally rate their service worse than those who receive service in English.

What has your experience with the internet in Tbilisi (and beyond, throughout the Caucasus) been? Join in the conversation on the CRRC-Georgia Facebook page.

The opinions expressed in this blog post reflect those of the authors alone, and do not necessarily represent the views of the organizations which Dustin and Hans work for.

Thursday, July 02, 2015

Perceptions of court proceeding transparency

[Note:  Social Science in the Caucasus is publishing the work of six young researchers who entered CRRC-Georgia’s Junior Fellowship Program (JFP) in February 2015. This is the sixth blog post in the series. Click here to see the first, secondthird, fourth, and fifth posts in the series.]

By Mari Mekhrishvili

Transparent courts are essential to ensuring the accountability of the judiciary and to sustaining society’s confidence in the judicial system. The current version of the Organic Law of Georgia on Common Courts, after important amendments made in 2013, is designed to ensure the transparency of the courts. The courts are now obliged to record court sessions and provide records to all interested parties upon request. In addition, the Public Broadcaster is authorized to record and broadcast court sessions except in cases when sessions are closed either in part or in whole, and to provide records to other media outlets upon request. The law also guarantees that the prosecution, defense, and any person present at the trial can record court sessions. 

To find out to what extent the legislative changes about photo, video and audio recording during the court sessions works in practice, the Georgian Young Lawyers Association surveyed 26 Georgian media outlets. According to the results of this survey, court proceedings are truly transparent in Georgia, as all media requests to receive court session records were granted from the Public Broadcaster when carried out in compliance with law. 

In this context, this blog post looks at Georgian citizens’ perceptions of court transparency in 2014 using CRRC-Georgia’s 2014 Attitudes towards the Judicial System in Georgia survey, funded by East-West Management Institute and the United States Agency for International Development.

Respondents were asked whether, in their opinion, Georgian court proceedings were transparent (a) before and (b) after the milestone 2012 Parliamentary Elections. Only 13% reported that courts were transparent before 2012. This is the period, when only the courts had the authority to record and stenograph court sessions, which could still be banned by the judge’s “reasoned decision”. 34% reported the same for the period after 2012 elections.


Note: The answers to the question, “To what extent do you agree or disagree with the opinion that court proceeding are transparent in Georgia?” were re-coded from a 10-point scale used in the questionnaire into a 3-point scale, where original options 1 through 4 were combined into “Disagree,” options 5 and 6 were combined into “Neither agree nor disagree,” and options 7 through 10 were combined into “Agree.”

Differences in attitudes are evident in different settlement types. Only 7% of Tbilisi residents reported that the courts were transparent before 2012, compared with 13% of urban settlements besides the capital and 17% of rural residents. Perceptions of court proceeding transparency after the 2012 Parliamentary Elections followed a similar pattern with 20% of capital residents, 33% of residents of urban settlements besides the capital, and 44% of rural residents agreeing with the statement that court proceedings were transparent. Rural residents generally appear to believe most in transparency of courts, though, as it is well known, rural residents always report higher levels of trust in institutions.


Hence, people’s perceptions of court transparency in Georgia differ when assessing the situation before and after 2012 Parliamentary Elections, but in both cases the rural and urban populations have very different assessments. 

Take a look at the 2014 Attitudes towards the Judicial System in Georgia survey, here.


Wednesday, July 01, 2015

Perceived happiness and the strength of social ties

[Note:  Social Science in the Caucasus is publishing the work of six young researchers who entered CRRC-Georgia’s Junior Fellowship Program (JFP) in February 2015. This is the fifth blog post in the series. Click here to see the first, secondthird, and fourth posts in the series.]

By Mariam Londaridze

Findings of a 2002 experimental study of University of Illinois students suggests that being a part of a strong social network might not guarantee happiness, but is one of the necessary conditions for being happy. Another study showed that both strong (family and friends) and weak (random acquaintances) social ties can contribute to happiness. This blog post examines how Georgians’ reported level of happiness differs by a number of measures of social ties, using data from the 2014 Volunteering and Civic Participation in Georgia survey funded by USAID and East-West Management Institute. Although this is a slightly oversimplified approach, throughout this blog post we refer to those who report being happy as “happy” people and those reporting being unhappy as “unhappy”.

There is a notable difference of 31% between happy and unhappy people reporting whether they enjoy meeting new people or not, amounting to 80% and 49%, respectively.


Note: A 10-point scale was used to record respondents’ answers to both questions. On the scale for the question “Overall, how happy would you say you are?” code 1 corresponded to the answer “very unhappy”, and code 10 corresponded to the answer “very happy”. For the analysis, the original scale was re-coded into a 3-point one, with original codes 1 through 4 corresponding to “unhappy”, codes 5 and 6 – “neither happy nor unhappy” and codes 7 through 10 – “happy”. The scale measuring answers to the statement “I enjoy meeting new people” was re-coded identically.


Happy people report there are “plenty of people” around them they can rely on when they have problems more often than unhappy people. While 61% of happy Georgians report having such people around, only 29% of unhappy ones report the same. The same tendency is observed when asked, “If you were ill, are there people besides those in your immediate household who would look after you without expecting any compensation?” While 79% of happy people reported “yes”, 60% of unhappy people did the same.


While 51% of unhappy people report that they have “helped their neighbor or a friend with some household chores or childcare” during the past 6 months, 77% of happy people report the same. It might not come as a surprise that 70% of happy people in Georgia report feeling being helpful to many people outside their family, while only 38% of unhappy people report the same.


Even though this post did not use a comprehensive measure of strength of social ties, the findings presented suggest that people who report being happy have stronger social ties compared to those who are unhappy. Hence, the findings we referred to in the beginning of this blog post likely hold true for the population of Georgia.
For more on happiness in the South Caucasus, you can find an earlier blog post on Happiness in Georgia, and have a look at the data using CRRC’s Online Data Analysis tool.