Wednesday, April 26, 2023

Life Satisfaction And What People Teach Their Children

Note: This article first appeared on the Caucasus Data Blog, a joint effort of CRRC-Georgia and OC Media. It was written by Dr. Tamar Khoshtaria, a Senior Researcher at CRRC-Georgia. The views presented in the article are of the author alone, and do not necessarily reflect the views of NDI, CRRC-Georgia, or any related entity.


Data from the European Values Study (EVS) of 2017 suggests that values commonly taught to children in different countries appear to be linked to how satisfied communities are with their lives. CRRC Georgia has compared the results between Russia, Georgia, Armenia, Azerbaijan, and a handful of European countries.

Most people in the world seek satisfaction with their lives; however, whether one experiences it is a matter of numerous potential factors.

One plausible contributor to life satisfaction could be the values parents or society instil in young people.

Data from the European Values Survey suggest that countries where larger shares of the public are satisfied with their life are more likely to teach their children about tolerance, respect, and independence.

Hard work tends to be associated with lower levels of life satisfaction, a trait commonly reported in the South Caucasus and Russia.

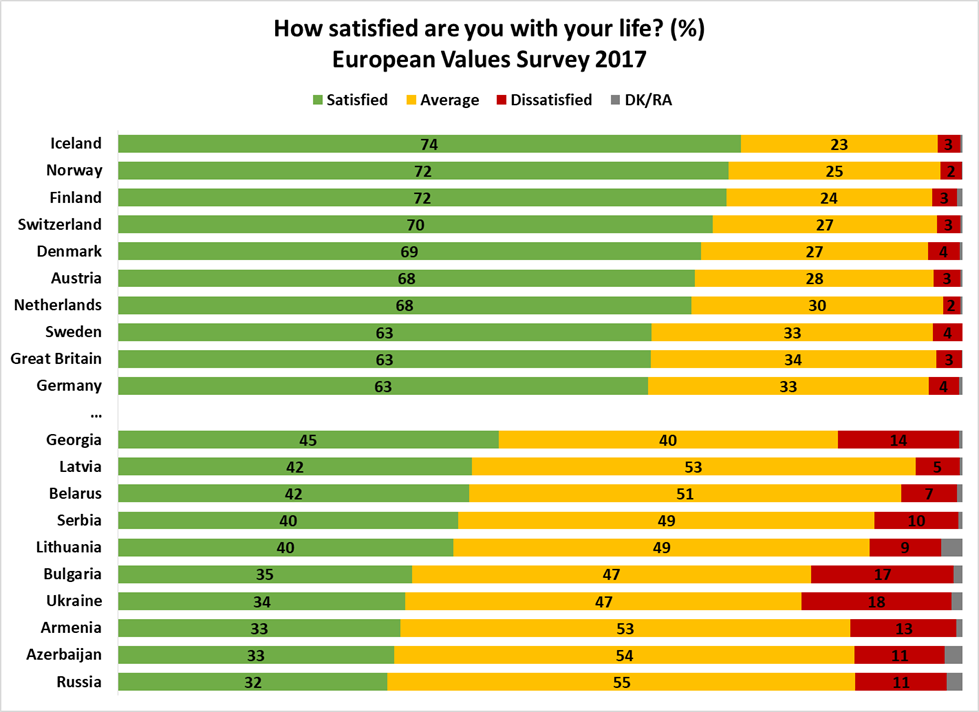
The European Values Survey suggests that Northern European countries reported the highest level of happiness and life satisfaction: data from 2017 suggested that over 90% of respondents living in Iceland (95%), Norway (94%), and Sweden (94%) say they are ‘very’ or ‘quite happy’. In addition, of the 36 countries covered in the survey, Iceland (74%), Norway (72%), and Finland (72%) reported the highest levels of satisfaction with life.

In contrast, only about one-third of people in Armenia (33%), Azerbaijan (33%), and Russia (32%) reported they were satisfied with life. Georgia stands somewhere in between, with 45% of its respondents claiming to be satisfied.

After Ukraine (18%) and Bulgaria (17%), Georgia has the highest share of people who say they are dissatisfied with their lives (14%).

Note: Respondents assessed life satisfaction on a 10-point scale, where 1 meant dissatisfied and 10 meant satisfied. Responses 1, 2 and 3 are labelled as dissatisfied on the chart above. Responses 4, 5, 6, and 7 are labelled as average, and 8, 9 and 10 are labelled as satisfied. The above chart does not include all countries in the survey due to space limitations. The graph above presents the 10 most and least satisfied countries in the study.


When looking at countries that are most and least satisfied with their lives and comparing them to Georgia, we see that these countries tend to have different ideas on what qualities are the most desirable for their children to learn.

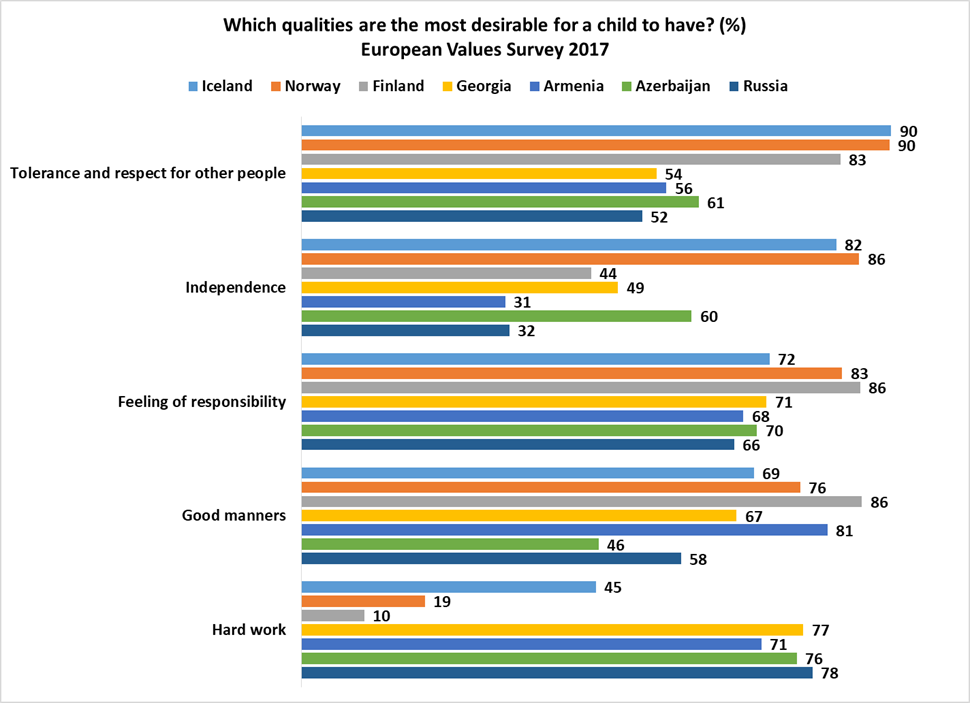
In the countries most satisfied with their lives — Iceland, Norway, and Finland — tolerance and respect for other people were named by over 80% of respondents. This share is significantly lower in Georgia (54%) as well as in the countries where people are least satisfied with their lives — Armenia (56%), Azerbaijan (61%), and Russia (52%).

In Iceland and Norway, though not in Finland, independence is named by over 80% of the public as a highly desirable quality for a child. The share of people naming this quality as most desirable is significantly lower in Azerbaijan (60%) and Georgia (49%) and even lower in Armenia (31%) and Russia (32%).

While over 70% of respondents name hard work as the most desirable quality which a child should have in the South Caucasus and Russia, the percentage is significantly lower in Iceland (45%), Norway (19%), and Finland (10%).

Some qualities were deemed desirable in all seven countries, such as having a sense of responsibility and being well-mannered.


Several patterns also stand out for specific countries. For example, 62% of people in Finland think determination and/or perseverance are desirable qualities, while religious belief is more desirable in Georgia (50%) than in all other countries.

Being able to save money and thrift was valued the most in Russia at 49%.  A number of other characteristics show relatively little in terms of distinctive patterns. 


The above data show that the most satisfied people in Europe live in Iceland, Norway, and Finland, while the least satisfied live in Armenia, Azerbaijan, and Russia. Georgia stands somewhere in between.

People who are most satisfied with their lives are more likely to teach their children qualities such as tolerance and independence, while the least satisfied communities are more likely to emphasise the importance of hard work.

Responsibility and good manners are generally valued in all of these countries, while religious faith is more important in Georgia than in the other seven countries explored in this article.

The data used in this article is available here.

Tuesday, April 11, 2023

Who Do Georgians Blame For Russia's War in Ukraine?

Note: This article first appeared on the Caucasus Data Blog, a joint effort of CRRC Georgia and OC Media. It was written by Dustin Gilbreath, a non-resident Senior Fellow at CRRC-Georgia.The views presented in the article are of the author alone, and do not necessarily reflect the views of NDI, CRRC-Georgia, or any related entity.

In the face of conflicting narratives about the causes of the war in Ukraine, most Georgians see Russia and Putin as responsible for the conflict, but a substantial minority lay the blame with the West. Since Russia invaded Ukraine slightly over a year ago, a war of words has erupted over who is to blame for the war, with the general consensus being that Russia needlessly invaded Ukraine.

In contrast to this consensus, the Russian government has spread propaganda blaming Ukraine for the war, accusing the country’s Jewish president of being a Nazi and stating that the country needed to be ‘de-Nazified’.

Against this backdrop, and in light of Georgia’s history with Russia, what does the Georgian public think?

Data from CRRC-Georgia and the National Democratic Institute’s regular polling in Georgia suggests that most blame Russia as a whole, but an increasing proportion of the public blames Vladimir Putin specifically for the war. And while the majority of the public report that the war is Russia or Putin’s fault, one in six Georgians report that some Western actor is at fault for the war, while one in twelve blame Ukraine.

The share of Georgians blaming Russia and Putin for the war shifted in the year following the war, with the share blaming Russia declining from 67% in March of 2022, to 54% in December of 2022. There was a simultaneous rise in the share blaming Putin specifically, from 11% in March 2022 to 25% in December of that year.

A smaller but substantial proportion of the public considers the West to be responsible for the war in Ukraine. While relatively small shares blame NATO (2-3%) and the European Union (2-4%), a relatively high percentage blame the US. One in eleven (9%) blamed the United States in March, which rose to and stayed at 15% in July and December respectively.

Similarly, relatively few Georgians blame Ukraine for the war. This share stood at 5% in March 2022, rose to 11% in July 2022, and then moved to between these shares at 8% as of December 2022.

The remainder of the public is either uncertain about who to blame for the war (14-17%) or names some other factor (2%).


It is important to note that respondents could name up to three responses. Therefore, the shares do not necessarily sum to 100% on the chart above. In the first wave of the survey, Vladimir Putin was not specifically asked about, but respondents still named him. In subsequent waves of the survey, Vladimir Putin was added as a response option.

In the most recent wave of the survey, 59% of the public named only Russia or Vladimir Putin as responsible for the war. One in nine (11%) suggested that only Western actors were at fault for the war. A further 7% named at least one Western actor and one Russian actor. The remainder were mostly either uncertain on how to respond (15%) or refused to answer (1%). Other respondents blamed Ukraine as well as some combination of Russian and Western actors.

Who blames who?

The data suggest that men, people belonging to ethnic minorities, and Georgian Dream supporters are more likely to consider the West (including the US, EU, and NATO) at least somewhat responsible for the war, than are women, ethnic Georgians, and those that do not support Georgian Dream.Ethnic Georgians, opposition supporters, those that claim they support no particular party, and people living in urban areas are more likely to blame Russia and/or Putin, compared to ethnic minorities, Georgian Dream supporters, and people in rural areas.

Ethnic Georgians, opposition supporters, those that claim they support no particular party, and people living in urban areas are more likely to blame Russia and/or Putin, compared to ethnic minorities, Georgian Dream supporters, and people in rural areas.

Men and Georgian Dream supporters are more likely to believe that Ukraine is at fault for the war than women and opposition supporters. 


Women, people with vocational education, those outside Tbilisi, poorer people, and people who support Georgian Dream are more likely than men, people with secondary education, those in Tbilisi, wealthier people, and those who support the opposition to be uncertain about the causes of the war.


The data do not suggest that any particular group is more or less likely to name at least one Russian actor and one Western actor for the war.

While Russia’s fault in the war is questioned by relatively few in Georgia, the data do show that some groups are more likely than others to believe that Western actors or Ukraine itself is partially or fully at fault. A substantial share also remains uncertain.


Note: The social and demographic breakdowns shown in the article above were generated from a regression analysis. The analysis had someone’s belief about who was at fault for the war as the dependent variable, including naming Russia/Putin or not, naming any Western institution or not, naming both a Western and a Russian actor or not, and naming Ukraine or not. The independent variables included age group (18-34, 35-54, 55+), sex (male or female), settlement type (Tbilisi, other urban, or rural), education level (secondary, vocational, tertiary), wealth (an index of durable goods owned by the respondents’ household), ethnicity (ethnic minority or ethnic Georgian), employment (working, unemployed, or outside the labor force), and party support (Georgian Dream, United National Movement, other opposition, refuse to answer/don’t know/no party). This article only reports on statistically significant differences between groups.

Tuesday, April 04, 2023

Shifting Tides: Changing Dynamics of Social Capital in Georgia and Armenia

Note: This article first appeared on the Caucasus Data Blog, a joint effort of CRRC Georgia and OC Media. This article was written by By Milord Shengelia, a Junior Researcher at CRRC Georgia. The views expressed in the article are the author’s alone and do not reflect the views of CRRC Georgia or any related entity. 

Both Georgia and Armenia are known for being close-knit, but levels of social ties and trust vary both between the countries and between demographics. And while levels of trust have increased in Armenia in the last decade, in Georgia, the opposite is true.

Past research has suggested that both Georgia and Armenia have high levels of bonding social capital — levels of trust within a family and community — but low levels of bridging social capital — the ability to make bonds with people outside one’s immediate circle.

However, recent data from the Caucasus Barometer shows that while in Armenia some measures of bonding social capital have risen significantly in the decade between 2011 and 2021, the same characteristics have remained largely stagnant in Georgia.

One measure of social capital is whether people feel that they have people that they can rely on when they have problems.

The share of the Georgian population who say that they have people they can rely on has varied slightly over the years, but remained between 34% and 40% between 2008 and 2021. The exception was a low of 29% in 2009, a year which is a relative outlier for Georgia.

In Armenia, however, respondents have increasingly felt that there are people that they can rely on, with this share doubling from 31% in 2011 to 60% in 2021.


The data show a similar pattern with regard to the statement, ‘There are many people I can trust completely’.

In 2008, 31% of the Georgian public reported that this described them, compared to 18% in Armenia. Since then, however, the situation has reversed, with 25% of the public in Georgia reporting this in 2021, compared with 48% in Armenia.


The relative levels of social capital which people report is associated with a number of demographic characteristics in Georgia and Armenia.

A regression model shows that in both Georgia and Armenia, people outside of the capital cities are more likely to say that in times of trouble, they have many individuals they can turn to than those living in Tbilisi and Yerevan. Similarly, wealthier people are more likely to believe they have people to rely on in both countries.

In Georgia, women are more likely to report they have plenty of people to turn to when faced with problems. In Armenia, gender is not associated with responses to this question.

In Georgia, ethnic Georgians were more likely to agree compared to ethnic minorities. Due to the small number of people of ethnic minority descent in Armenia, only a small number were present in the sample. Consequently, the same association was not tested in Armenia.

Employed people in Armenia, but not Georgia, are more likely to feel there are people they can rely on. Age and education are not associated with responses to this question in either country, controlling for other factors.

Regarding how much people feel they can trust others, in Georgia, this is associated with both where someone lives and their sex.

Men are more likely to say that there are many people they can trust completely compared to women, while people who live in Tbilisi are less likely to report people can be trusted, compared with people in other urban and rural areas. There were no differences associated with age, education, employment, or ethnicity on this question.

In Armenia, wealth is a significant predictor of trusting others. Wealthier respondents were more likely to indicate that there were many people they could trust completely. In Armenia, no other variable was associated with this statement.


Over the last decade, the dynamics of social capital in Armenia have undergone a transformation, while in Georgia they have remained stagnant. While Georgian people had more social capital in the past, today Armenians are more likely to have stronger bonding social capital.

Note: The results presented in the above chart came from regression model of the CB 2021 wave. The regressions included the following variables: sex (male or female), age group (18–34, 35–54, 55+), settlement type (capital, urban, rural), ethnic group (ethnic majority or ethnic minority), educational attainment (secondary or lower, secondary technical, higher than secondary), employment (working, not working), wealth (ownership of 14 different durable goods, a common proxy for wealth).

The views expressed in this article reflect the views of the author alone, and do not necessarily reflect the views of CRRC Georgia, or any related entity.