Tuesday, June 28, 2022

Knowing a queer person increases tolerance

Note: This article first appeared on the Caucasus Data Blog, a joint effort of CRRC Georgia and OC Media. It was written by Dustin Gilbreath, a Non-Resident Senior Fellow at CRRC-Georgia. The views presented in the article are of the author alone, and do not necessarily reflect the views of CRRC Georgia, the Council of Europe, or any related entity.

Overall, according to the survey —  which CRRC Georgia conducted for the Council of Europe   8% of the public reported knowing an LGBT person, and 87% reported they did not. A further 5% were uncertain, and 1% refused to answer.

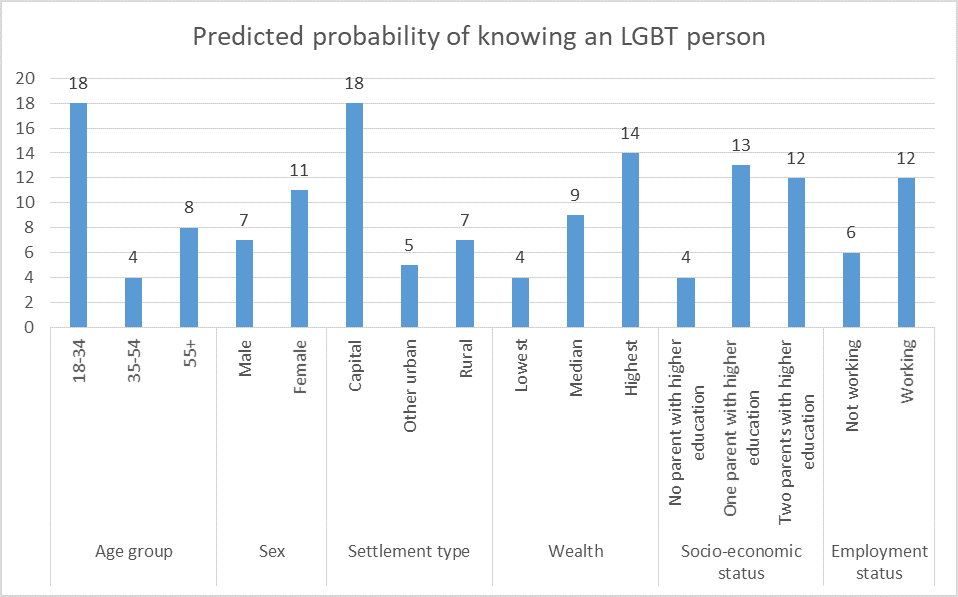
The data shows young people are significantly more likely to know an LGBT person. So are people in Tbilisi, wealthier people, people who are employed, and those with a higher socio-economic status. Women are slightly more likely to report knowing an LGBT person than men. Ethnic minorities, those with different levels of education, IDPs, and people with children in their household are no more or less likely to report knowing an LGBT person than ethnic Georgians, non-IDPs, and those without children in their households.

To understand whether people who know an LGBT person are also more tolerant of LGBT people in general, a matching analysis was conducted. This method identifies statistically similar people who know and do not know an LGBT person and then compares their attitudes. The goal is to understand whether knowing an LGBT person might also be associated with tolerance for LGBT people more broadly.

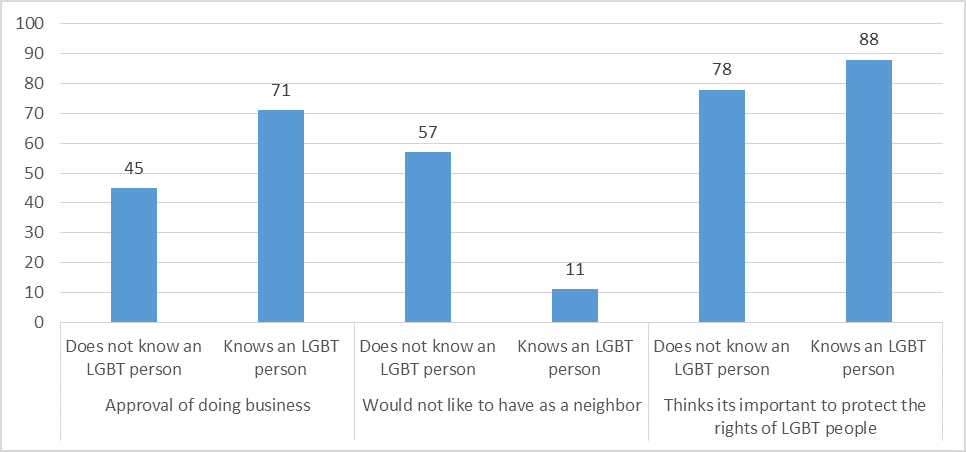
The analysis shows that people who know LGBT people are significantly more tolerant. 

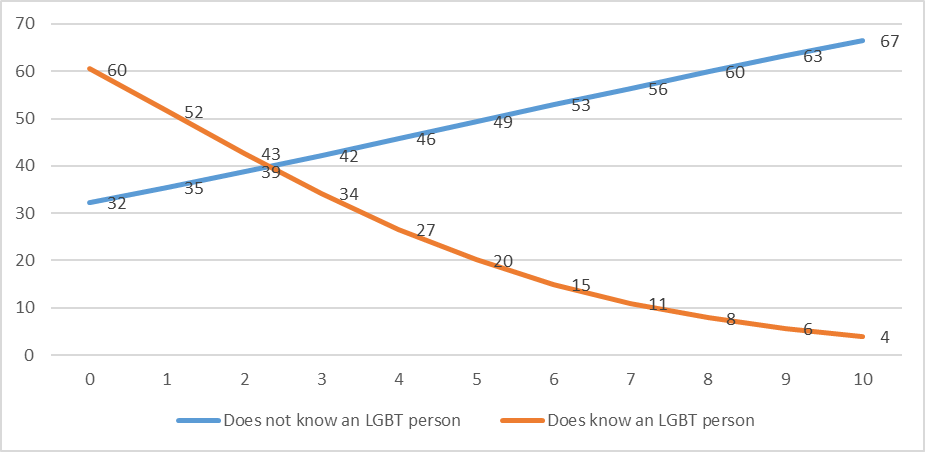
People who know an LGBT person are 26 percentage points more likely to approve of someone like them doing business with a homosexual person, compared with those who have otherwise statistically similar demographic characteristics. They are 10 percentage points more likely to think it is important to protect the rights of LGBT people. People who know an LGBT person are 46 percentage points less likely to say they would not want an LGBT person as a neighbour.

The effect of knowing someone who is not a heterosexual varies significantly with a number of social and demographic characteristics with regard to approval of doing business and approval of having an LGBT neighbour. However, it does not vary with regard to views on the importance of protecting the rights of LGBT people.

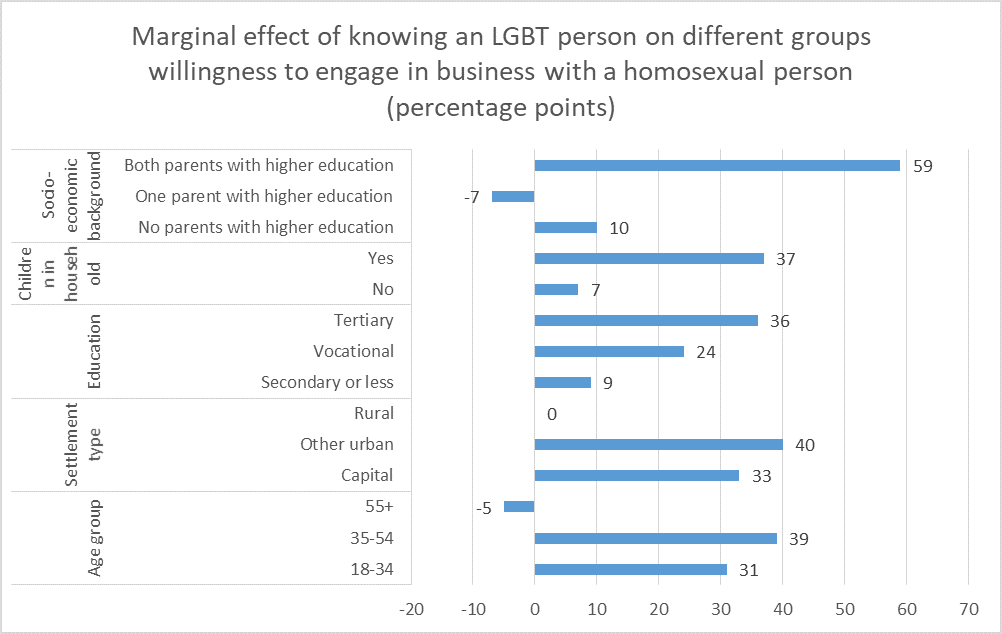
With regard to acceptance of doing business, the effect of knowing someone varies by age, settlement, wealth, socio-economic background, and whether or not a person lives in a household with children. 

The data shows that the effect of knowing an LGBT person is particularly large for people with children at 37 percentage points, compared to only 7 percentage points for people without children.

The data also indicates that there is no effect in rural areas, while there are substantively large effects in urban areas. 

The effect is also null for older people. By comparison, for people under the age of 54, the effect is rather larger at 39 percentage points for 35 to 54-year-olds and 31 percentage points for 18 to 34-year-olds.

The more education a person has, the greater the effect of knowing an LGBT person on their attitudes.

The data further shows that the effect is substantially larger for people from richer socio-economic backgrounds. To proxy people’s socio-economic backgrounds, the respondent’s parents’ education levels are considered, a common approach to understanding someone’s family background. 

The effect of knowing someone is substantial if both of the respondent’s parents had higher education. In contrast, people with one or no parents with higher education experience little effect from knowing an LGBT person.

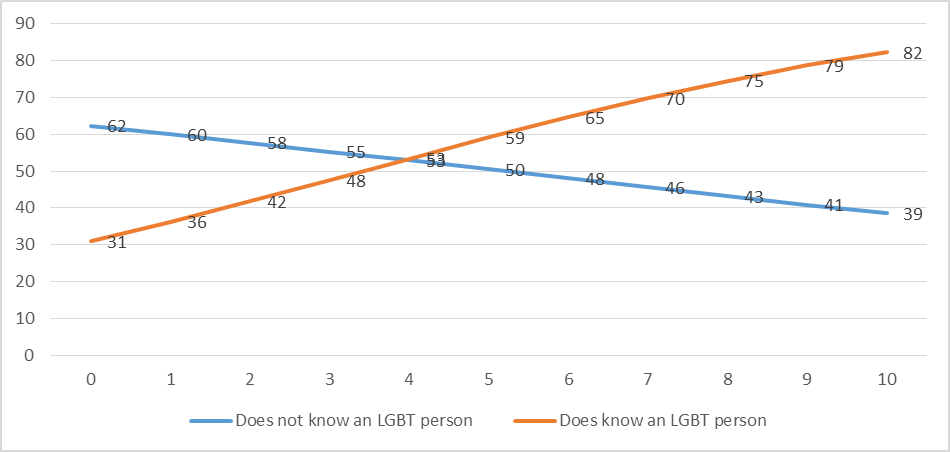
Current wealth also shows a striking pattern with regard to the impact of knowing an LGBT person. People living in poorer households are significantly less likely to approve of someone like them doing business with a homosexual if they know an LGBT person. In contrast, people living in wealthy households are significantly more likely to approve of someone like them doing business with a homosexual if they know an LGBT person.

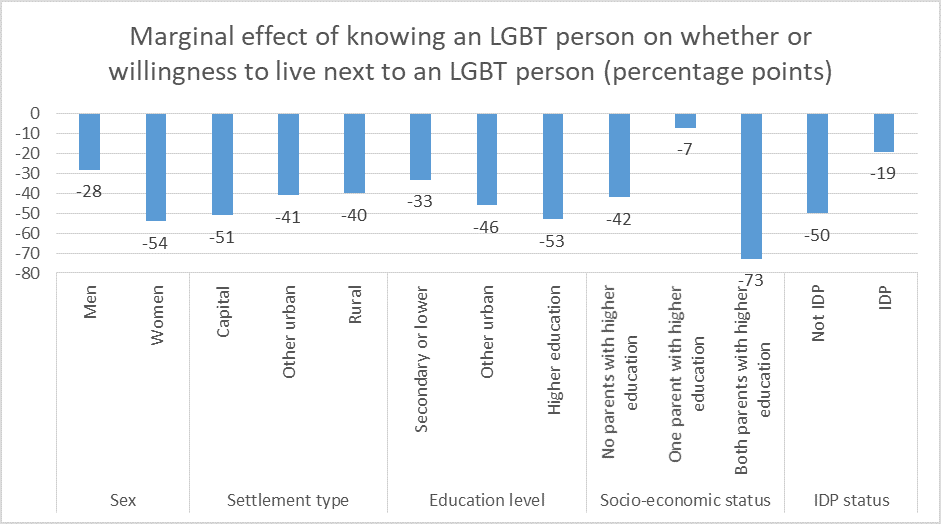
The size of the effect of knowing an LGBT person on willingness to live next to an LGBT person also varies with an individual’s sex, the settlement type they live in, their education level, whether or not they are an IDP, and their socio-economic status.

The effect is substantially larger for women than men (54 percentage points versus 28). The effect is larger in Tbilisi compared with other urban areas and rural areas. The effect is also larger for people with higher education and smaller for IDPs.

With regard to socio-economic status, the data shows that the effect is largest again for people with two parents that had higher education. People without parents that have higher education also experience a large effect. However, people with only one parent with higher education show no significant effect as a result of knowing someone who is LGBT on their willingness to live next to an LGBT person.

The data paint a similar picture of the effects on people in poorer and wealthier households of knowing an LGBT person on willingness to live next to an LGBT person. People in relatively well-off households are significantly more likely to be willing to live next to an LGBT person if they also know one. The reverse is true of people in poorer households.

In contrast to the willingness to do business with and to live next to an LGBT person, there were no significant variations in the size of the effect of knowing an LGBT person on different social and economic groups. 

The above data calls for further research. While on average there are statistically significant and substantially large effects of knowing an LGBT person on average, the effects vary significantly between groups. People living in wealthy households and from relatively better-off backgrounds appear to respond strongest to knowing an LGBT person. Other groups also experience substantial impacts from meeting LGBT people. However, these tend to be relatively small. Future research should aim to understand the causal mechanism by which these impacts could take place.

Tuesday, June 21, 2022

Despite the war, Georgians differentiate Russia and Russians

Note: This article first appeared on the Caucasus Data Blog, a joint effort of CRRC Georgia and OC Media. It was written by Elene Ergeshidze, a Researcher at CRRC-Georgia, and Nino Mzhavanadze, an Independent Researcher. The views presented in the article are of the authors alone, and do not necessarily reflect the views of CRRC Georgia, or any related entity.

After Russia’s invasion of Ukraine, a large-scale migration of Russians to Georgia led to a debate in Georgian society. 

Many perceived the rising number of Russians entering Georgia as a security threat, and a majority wanted visa restrictions to be introduced for Russian citizens. Others empathised with Russians fleeing Putin’s Russia. 

In this context, there were widespread concerns about anti-Russian sentiment and the potential for hate crime and hate speech against Russians in Georgia. 

[Read on OC MediaRussian émigrés face chilly reception in Georgia]

Despite the concerns, data from CRRC and NDI’s polling from March 2022 shows that a majority of Georgians have a positive attitude towards Russian people and a negative attitude towards the Russian state. This maintains a pattern of public opinion that has been present in most surveys which CRRC Georgia has conducted which allow an exploration of the issue, including in multiple waves of the Caucasus Barometer survey and more recently a survey on foreign policy which CRRC conducted for the Georgian Foundation for Strategic and International Studies

On the March 2022 CRRC and NDI survey, a majority of Georgians (85%) reported an unfavourable attitude towards the Russian government. A majority (59%) also reported a positive attitude towards Russian people. 

Further analysis suggests that settlement type and ethnicity are correlated with holding unfavourable attitudes towards the Russian government. 

People in Tbilisi were six percentage points more likely to have unfavourable attitudes towards the Russian Government compared to people living in rural areas. Ethnic Georgians were seven percentage points more likely to express unfavourable attitudes towards the Government of Russia than ethnic minorities. 

Note: These charts were generated from a regression model. The model includes gender (male, female), age group (18–34, 35–54, 55+), settlement type (capital, urban, rural), education (secondary or lower, secondary technical, tertiary), ethnicity (Georgian, ethnic minority), party respondent names as closest to his/her views (Georgian Dream, opposition party, did not name a party (Don’t know, Refuse to answer, No party)), and an additive index of ownership of different items, a common proxy for wealth.

Analysis shows that favourable attitudes towards Russian people also vary across demographic groups. 

Men were seven percentage points more likely to express favourable attitudes towards Russians compared to women. People over the age of 35 held more positive attitudes towards Russian people. Ethnic minorities living in Georgia were 28 percentage points more likely to report favourable attitudes than ethnic Georgians. Supporters of the ruling party were 14 and 9 percentage points more likely to hold favourable attitudes towards Russian people compared to opposition supporters and those who do not support any party, respectively. 

Note: These charts were generated from a regression model. The model includes gender (male, female), age group (18–34, 35–54, 55+), settlement type (capital, urban, rural), education (secondary or lower, secondary technical, tertiary), ethnicity (Georgian, ethnic minority), party respondent names as closest to his/her views (Georgian Dream, opposition party, did not name a party (Don’t know, Refuse to answer, No party)), and an additive index of ownership of different items, a common proxy for wealth.

While there was widespread discussion about whether the Georgian public would become more hostile to Russian people following the war in Ukraine and large-scale Russian migration to Georgia, the data shows that people have maintained a distinction between Russia and Russians, with negative attitudes towards the former and positive attitudes towards the latter. 

Tuesday, June 14, 2022

The optimism of pro-EU Georgians

Note: This article first appeared on the Caucasus Data Blog, a joint effort of CRRC Georgia and OC Media. It was written by Julia-Maria Xavier, an International Fellow at CRRC-Georgia. The views presented in the article are of the author alone, and do not necessarily reflect the views of CRRC Georgia, Europe Foundation, or any related entity.

The  2021 CRRC and Europe Foundation Knowledge of and Attitudes toward the EU in Georgia also shows that a strong majority of the Georgian population supports the country joining the European Union.

The survey asked respondents whether they would vote for membership in the European Union if a referendum were held tomorrow. Overall, 77% reported they would vote for membership, 8% that they would not, and 6% that they would not vote. A further 9% reported that they were uncertain and 1% refused to answer.

To measure optimism about the future, people were asked whether the situation in Georgia would never improve or whether, eventually, everything would be fine. In total, 18% reported that things will never improve, while 77% reported that eventually everything will be fine and 5% either did not know or refused to answer.

The data shows that people who would vote for EU membership are more hopeful about the future of Georgia. People who would vote for membership in the European Union were nine percentage points more likely to be optimistic about the country’s future than people who reported that they would vote against EU membership. People who reported that they would not vote were the most pessimistic, being a full 28 percentage points less likely to report optimism for the country’s future. 

People who were employed were nine percentage points more likely to have a positive outlook than people who were not working. There were no meaningful differences in support between men and women, people residing in different settlement types, or in different age groups, controlling for other factors.

The reverse is also true: people who are optimistic about the country’s future would be more likely to vote for EU membership. People who are optimistic about the country’s future are 10 percentage points more likely to report that they would vote for the country’s membership in the European Union, controlling for other factors.

Ethnicity also predicts voting intentions. Ethnic Georgians are 21 percentage points more likely to support joining the EU than ethnic minorities. 

Employment status also predicts voting intentions, with employed people being 12 percentage points more likely to report that they would vote for EU membership. 

There were no meaningful differences in support between men and women, people residing in different settlement types, or in different age groups, controlling for other factors. 

While the data shows that Georgians who would vote for EU membership are more optimistic about the country’s future more broadly, whether those hopes will be dashed awaits a decision on whether Georgia receives EU candidacy status later this month.

Note: The above analysis is based on logistic regression models that include age (18-35, 35-54, 55+), settlement type (capital, urban, rural), sex, employment, optimism about the future, ethnicity (ethnic Georgian, ethnic minority). Willingness to vote for the European Union and optimism about the future were assessed in separate models, which also included these controls. The data this article is based on is available here.

Wednesday, June 08, 2022

Youth in Georgia have little trust in unions

Note: This article first appeared on the Caucasus Data Blog, a joint effort of CRRC Georgia and OC Media. It was written by Nino Zubashvili, a researcher at CRRC-Georgia, and David Sichinava, Research Director at CRRC-Georgia. The views presented in the article are of the authors alone, and do not necessarily reflect the views of CRRC Georgia, or any related entity.

Worker strikes in recent years in Georgia, such as the 2018 metro operators’ strike, the 2019 social workers’ strike, and the 2021 delivery workers’ strike, among others, have led to focus on unions and their role in the country.

However, due to Georgia’s Soviet heritage and neoliberal policies, among other factors, some argue that unions in Georgia have lost the trust of workers, having been unable to successfully fight for fair working conditions since the 1990s.

Similar to Georgia, in other countries with experiences of Soviet rule, where unions were the instruments of state power during the communist period, they do not enjoy high trust, and workers have only recently started to return to them. And though it was not by any means frequent, several independent unions in Georgia have indeed had successes since the 2010s. 

In spite of this small-scale resurgence, recently released data from the Survey on Youth Civic and Political Engagement and Participation in Peacebuilding, which looks at trust in unions, among other institutions, suggests that public trust remains anaemic. 

The survey results, which feature data that is representative of Georgia’s youth (aged 18-29), suggest that trust in unions is quite low (10%) compared to trust in other institutions. However, this stems from a high level of uncertainty, rather than active distrust. Two fifths (38%) of young people are uncertain about their level of trust in unions, which may stem from low levels of awareness. 

Trust in unions differs across several social and demographic groups. Regression analysis suggests there are no significant differences across gender, age, employment situation, the experience of job loss due to the pandemic, current perceived economic rung, status as an internally displaced person (IDP), or ownership of durable goods. However, trust differs across settlement type, ethnicity, educational attainment, party affiliation, and level of generalised trust. 

While young people living in the capital are significantly less likely to trust unions, they are also significantly and notably less likely to be undecided (53%) compared to young people living in other urban (71%) and rural areas (67%). This pattern is not unique though for the unions. 

This pattern falls in line with young people’s trust in other non-public institutions across settlement types. Young people living in the capital tend to trust other non-state institutions, including NGOs and religious institutions they belong to less than young people living in other cities and rural areas.

Ethnic minority youth are significantly and notably more likely to trust and less likely to be undecided about unions (29% and 57%, respectively) compared to ethnic Georgian youth (8% and 65%, respectively). Similarly, ethnic minority youth are significantly more likely to trust other non-state institutions, including political parties, the media, and religious institutions. 

Those with higher education are more likely to distrust unions (33%) and less likely to be undecided (55%), compared to those with secondary or lower education (21% and 70%, respectively). This pattern is distinctive to unions, as educational attainment is not associated with trust in other non-state institutions. 

Young people that support opposition parties are more likely to distrust unions (35%) and less likely to be undecided (58%) compared to supporters of the governing party (17% and 68%, respectively), no party (21% and 74%, respectively), or the uncertain (14% and 61%, respectively). Those undecided about party affiliation are the most likely to trust unions. The pattern for individuals that do not support any particular party is similar for other non-state institutions including political parties and religious institutions. 

Youth with greater degrees of trust in general also express less distrust in unions. However, being neutral or undecided is also more common among youth believing that most people can be trusted (68%), compared to those who believe that one cannot be too careful in dealing with people (56%). This pattern resembles the general pattern for trust in political parties and the media. 

In line with the general trend in the post-Soviet space, young people in Georgia have low levels of trust in unions, although a majority neither trusts nor distrusts them. Rather, a plurality is uncertain of how much they trust unions, potentially indicating a low level of awareness. Trust in unions is lowest in the capital, among ethnic Georgians, those with higher education, and people who trust other people less in general. In contrast, undecidedness is highest among youth living in urban areas, without tertiary education, people who have higher trust in people generally, and among ethnic Georgians.  In general, these demographic breakdowns mirror patterns of trust in institutions more broadly.

Note: The data used in the article can be found on CRRC’s online data analysis tool.

Thursday, June 02, 2022

Georgians are split on election quality

Note: This article first appeared on the Caucasus Data Blog, a joint effort of CRRC Georgia and OC Media. It was written by Milord Shengelia, a junior fellow at CRRC-Georgia, and Makhare Atchaidze, a researcher at CRRC-Georgia. The views presented in the article are of the authors alone, and do not necessarily reflect the views of CRRC Georgia, or any related entity.

Data CRRC Georgia collected before the 2021 municipal elections for ISFED and after the elections for NDI shows that supporters of the ruling party and opposition were and are divided over the quality of elections in Georgia.

Views prior to the elections

Prior to the elections, roughly half the public (46%) thought that the Central Election Commission (CEC) counted votes correctly. A regression analysis suggests that people who support the Georgian Dream were 66 percentage points more likely than opposition supporters to report thinking so, controlling for other factors. 

People who report that no party is closest to them, don’t know, or refuse to answer, had a 52% chance of saying that the CEC was counting votes correctly, which is more than the opposition, but far less than the corresponding share among Georgian Dream supporters.  

Aside from partisanship, where one works is also associated with trust in the CEC. People who work in public service were 17 points more likely to positively evaluate the vote count than people not working and people working in the private sector.

Another indicator of the quality of elections is faith in the secrecy of the ballot. 

Prior to the elections, 44% of the public said that the secrecy of the ballot could be violated in Georgia, again with a strong partisan divide in terms of views. A regression model suggests that perceptions about voting privacy are also associated with party preference. 

Opposition supporters were 36 percentage points more likely to report that it was possible for someone in Georgia to know who another person voted for than Georgian Dream supporters. 

People who did not report a party preference held views in between. 

Aside from party support, young people were less likely to think voting secrecy was protected in Georgia. 

Respondents were also asked how the 2021 local government elections would be conducted. Almost 60% of respondents mentioned that the election would be conducted with either major or minor violations. While 23% said there would not be violations.  

A regression model indicates that opposition supporters were more pessimistic about the quality of elections than supporters of Georgian Dream. Controlling for other factors, opposition supporters had a 44% chance of saying that the elections would be conducted with major violations, 37 percentage points more than Georgian Dream supporters.  

Aside from partisanship, private sector workers and those who do not work were more pessimistic about election quality prior to the vote. More specifically, people who worked in the private sector and those who dido not work had a 21% chance of saying that the elections would be conducted with major violations, while 12% of public service workers reported the same.

Note: The results presented in the above charts came from regression models. The regressions included the following variables: sex (male or female), age group (18–35, 35–55, 55+), settlement type (capital, urban, rural), ethnic group (ethnic Georgian or other ethnicity), educational attainment (secondary or lower, secondary technical, higher than secondary), workplace (Working in the public sector, Working in the private sector, Not working), party preference (Georgia Dream supporter, opposition supporter, or supports no party/DK/RA), wealth (an additive index of ownership of 10 different items).

Views following the elections

Data from NDI and CRRC Georgia’s regular polling efforts suggested that pessimism about the CEC’s performance has grown over time. In December 2021, seven times as many people (35%) assessed the CEC’s performance as poor compared with in April 2014 (5%). 

While positive assessments have fluctuated slightly over the years, neutral performance assessments have roughly halved. 

Note: In some cases in the above, graphs may not sum to 100%. This is generally due to rounding error.

A regression analysis suggests that a number of factors were associated with CEC performance assessments following the elections, including settlement type, ethnicity, partisanship, and wealth.

A regression analysis shows that the largest difference in people’s views stems from their political preferences. Georgian Dream supporters were almost 8 times more likely than opposition supporters to rate the CEC’s performance positively and around 3.7 times more likely to do so compared to those who do not report a party preference. 

Correspondingly, those who are not Georgian Dream supporters were significantly more likely to assess the CEC’s performance as poor. 

Aside from partisanship, a number of factors predicted people’s views. People in Tbilisi and other cities were slightly more likely to assess the CEC’s performance poorbadly than people in rural areas. 

Ethnic Georgians were more likely to have negative attitudes towards the CEC’s performance than ethnic minorities. The wealthier a household is, the less likely it was to evaluate the CEC's work badly. 

The above analysis is based on an ordinal regression model. The model includes age groups (18-34, 35-54, 55+), sex (male, female), settlement type (capital, urban, rural), education (secondary or lower, technical, tertiary), ethnicity (Georgian, ethnic minority), wealth (ownership of 10 different items, a proxy variable), and party preference (Georgian Dream supporter, opposition supporter, or supports no party/DK/RA).

The above analysis shows that regardless of the objective quality of elections in Georgia, there is a clear problem with regards to elections being viewed as legitimate across the political spectrum.

The data used in this article is available here. Replication code for the above analysis is available here.