Tuesday, May 30, 2023

Is Georgia's Gen Z More Politically Engaged Than Young Millennials?

Note: This article first appeared on the Caucasus Data Blog, a joint effort of CRRC-Georgia and OC Media. It was written by Zachary Fabos, an International Fellow at CRRC-Georgia. The views presented in the article are the author’s alone and do not necessarily represent the views of CRRC-Georgia, Caucasian House, or any related entity.


Public discourse in Georgia has in recent months raised the idea that Georgia’s young people, and particularly Gen Z, are politically interested and active, particularly following the March foreign agent protests. CRRC data suggests that a majority of 18-29-year-old Georgians are politically engaged, although the older age bracket are somewhat more interested.

In the conversation around Georgia’s foreign agent law protests, which took place in March, Gen Z — people born between the late 1990s and early 2000s — have featured heavily. Many of the protests’ most striking moments were attributed to those recently having reached voting age, as was some of their creativity and momentum.

The legislation in question found itself between contesting visions of Georgia’s political future, with protestors suggesting it would ruin Georgia’s hopes of Western integration, and Georgian Dream arguing that the law was necessary for transparency.

But prior to their engagement in the protests, what were Gen Z’s attitudes towards politics and how did they choose to participate? Data from CRRC-Georgia and Caucasian House’s 2021 Survey on Youth Civic and Political Engagement and Participation in Peacebuilding suggests that both Georgia’s Gen Z and millennials are interested in and engaged with the country’s politics, though Millennials are slightly more interested in politics.

For the purpose of this analysis, 18-25 year-olds are considered part of Gen Z, while the survey’s older participants, those aged 26-29, are referred to as millennials despite only covering the youngest of those born between the late 1980s and mid-late 1990s.

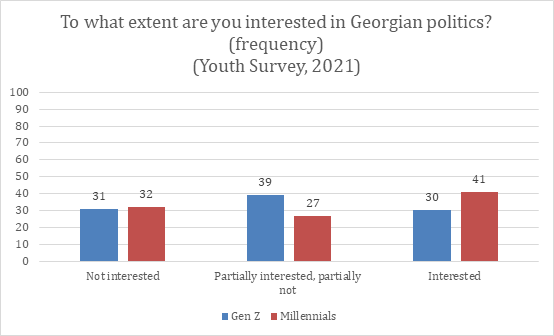
Data from the survey suggests a majority of both age groups are partially interested or interested in the country’s politics. However, more millennials were interested, with 41% reporting interest compared to 30% of Gen Z. By comparison, Gen Z was more likely to indicate partial interest, with 39% claiming to be somewhat interested and somewhat not and 27% of millennials stating the same.


When the data is broken down by social and demographic groups including gender, ethnicity, settlement type, and education level, a number of patterns emerge.

In terms of settlement type, young people in rural areas are six points more likely to be interested in politics than people in Tbilisi. People in urban areas other than Tbilisi are interested at a rate somewhere between the two.

When it comes to gender, women are seven points more likely to be interested in Georgian politics than men.

Finally, people with a higher education are twenty-six and thirty-seven points more likely to report they are interested in politics than people with secondary education or vocational education, respectively.

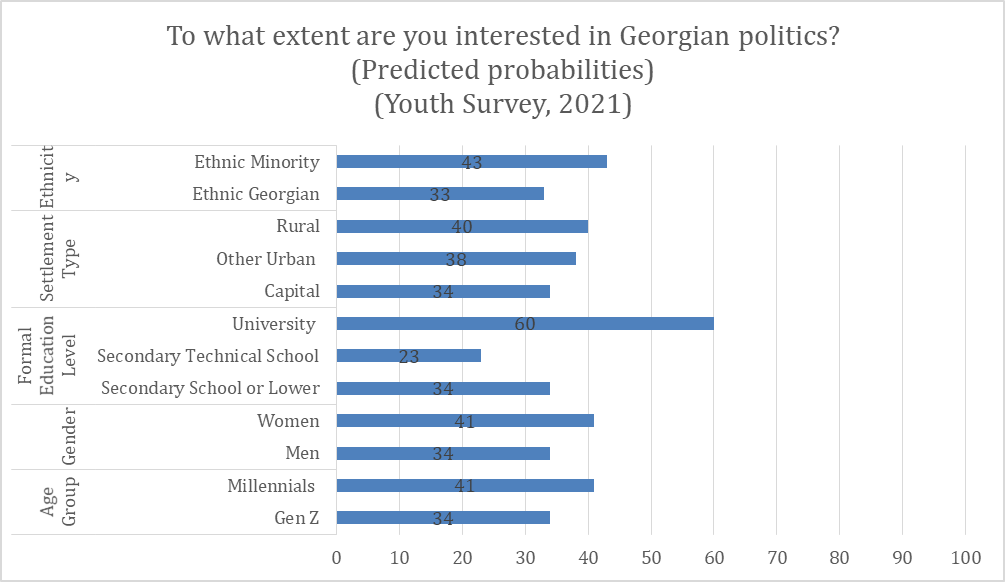
Note: Interest is coded as expressing at least partial interest.


Aside from general interest, the survey asked young people if they ever engaged in a range of political actions including membership in a political party, donating to a political party, participating in a political campaign, attending a meeting with a party member or candidate, taking part in a protest, or having voted in the 2020 parliamentary elections.

For the purpose of measuring engagement in politics among Gen Z and Millennials, the six activities were grouped together to create a political participation index, with six being all activities and zero being engagement in no activities. Overall, roughly half of respondents reported engaging in one activity, a third no activities, and the remainder two or more.


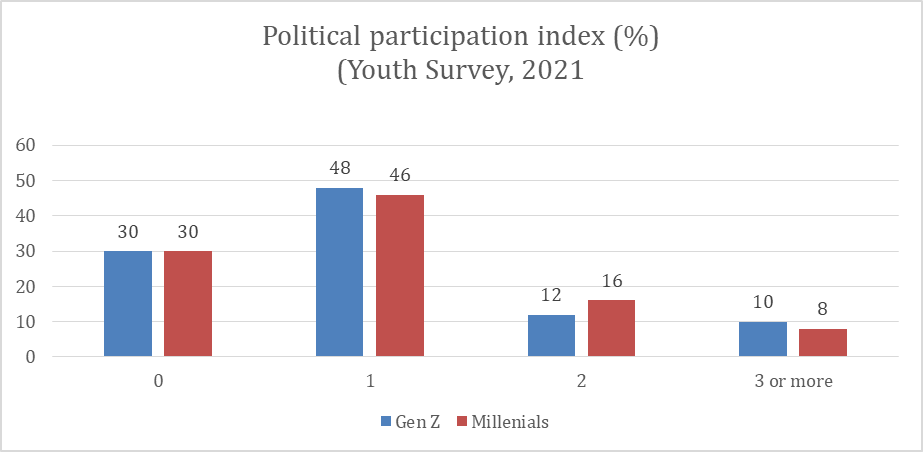
The survey data suggested that both generations engage in political activities at about the same rate, with a plurality having taken part in at least one action: 48% of Gen Z and 46% of millennials.

Breaking this down, education and ethnicity were the strongest predictors of how many political activities someone had taken part in.

Young people with a university education on average engaged in approximately one half of one activity more than those with other levels of education, controlling for other factors.

In contrast to perceptions in Georgia that ethnic minorities are politically unengaged, the data showed that ethnic minorities engaged in approximately one third more actions on average, controlling for other factors. While the data does not provide a clear explanation for this pattern, it may stem from the fact that this data focuses on young people, who may be more politically active than older people who are not ethnic Georgians. Alternatively, it could point towards an incorrect perception of ethnic minority political engagement more broadly.

Aside from one’s education level and ethnicity, the model demonstrated that other demographic factors were not associated with the types of civic engagement young people were engaged in.


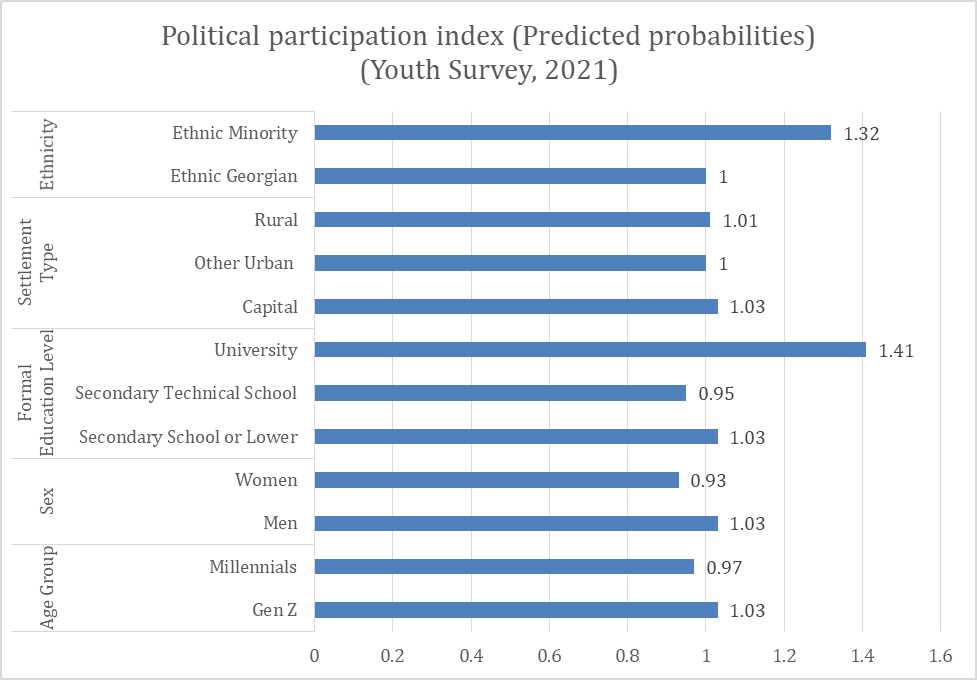
Note: The chart above was generated from a regression model. The model includes ethnicity (ethnic Georgian, ethnic minority), settlement type (capital, other urban, rural), education (tertiary, secondary technical school, secondary school or lower), gender (female, male) and age group (18-25, 26-29).

The results of the youth survey suggest that among young people, interest in politics is slightly higher among millennials than among Gen Z. Within those groups, participation in political activities is more associated with education and ethnicity than most other factors. However, the data does confirm that Gen Z was interested in politics and as likely as millennials to have engaged in political activity prior to the protests against the foreign agent law in March.

Note: The analysis in this article makes use of logistic regression analysis. The analysis included gender (male, female), age group (18-25, 26-29), settlement type (capital, urban, rural), education (secondary or lower, secondary technical, tertiary), and ethnicity (ethnic Georgian, ethnic minority), as predictor variables. The data used in this article is available here.

Tuesday, May 23, 2023

What Makes People Feel Insecure in Georgia?

 Note: This article first appeared on the Caucasus Data Blog, a joint effort of CRRC Georgia and OC Media. It was written by Dustin Gilbreath, a Senior Non-Resident Fellow at CRRC Georgia. The views presented in the article are of the author alone, and do not necessarily reflect the views of NDI, CRRC-Georgia, or any related entity.


A CRRC analysis found that Georgians who feel insecure in Georgia mostly attribute this to economic insecurity, but also express concern about a wider array of harder security issues.

Georgia has faced numerous crises in recent years; from the pandemic, to the results of the war in Ukraine, via political controversy and uncertainty.

It is consequently perhaps unsurprising that almost half the public is uncertain about how they will fare economically in five years’ time. This is reflected in recent data, which shows that economic insecurity is the main reason why Georgians feel insecure in Georgia. However, a wide array of harder security issues also contribute to people feeling insecure in the country.

In the December 2022 NDI and CRRC Survey, the public was asked whether they felt insecure or secure living in Georgia. A third reported that they felt either very insecure living in Georgia (8%) or more insecure than secure (26%). By comparison, about half of the public reported that they were more secure than insecure (47%). One in five (19%) felt that they were very secure living in Georgia.

Why do people feel insecure?
Amongst those who felt insecure living in Georgia, economic issues were the main reasons given for their sense of insecurity.

The top three issues named were poverty, inflation, and unemployment, with between 34% and 39% of respondents naming one of these options.

Crime was identified as the main reason for feeling insecure by a third of relevant respondents, and political instability by one in five. Healthcare and the high price of drugs were named by 7% and 10% of relevant respondents, respectively. Harder security issues such as the war in Ukraine, and instability in the Caucasus were named by relatively few; 5% and 1%, respectively. 


Note: Because respondents could name up to three responses to this question, the data does not sum to 100%.

The above issues were grouped into economic, hard security, and social policy related issues. Economic issues included poverty, inflation, and unemployment. Crime, violence, political instability, territorial integrity, the war in Ukraine, actions by Russia towards Georgia, and instability in the Caucasus were grouped into hard security issues. All other options were grouped together into social policy issues.

While the most commonly cited issues are mainly economic, people’s concerns were multifaceted. The data found that 66% of those who felt insecure named at least one economic issue, 62% named at least one hard security issue, and 32% named one social policy issue, suggesting that similar shares of people are concerned about at least one economic issue and at least one hard security issue. 

WHO FEELS INSECURE?

Given the dominance of economic issues as a reason for feeling insecure, it is perhaps unsurprising that people living in poorer households are more likely to feel insecure, and cite economic issues more than people living in relatively well-off households.

A number of other patterns are also present.

Women are ten points more likely to feel insecure in Georgia, controlling for other factors, than men. 

People in Tbilisi are 11 points more likely to feel insecure than people outside Tbilisi. 

Ethnic Georgians are 23 points more likely to feel insecure in Georgia than ethnic minorities.

Supporters of the United National Movement, Georgia’s main opposition party, are 24 points more likely to feel insecure in Georgia than supporters of the ruling Georgian Dream party. People who support other parties or report not supporting any party are 18 points more likely to feel insecure in Georgia than supporters of Georgian Dream.


The above data shows that a third of Georgians feel insecure in the country. While recent large-scale instability in Georgia has related more to hard security issues, such as the war in Ukraine, the data shows that economic insecurity remains the greatest concern for people who feel insecure in the country.

Note: The social and demographic breakdowns shown in the article above were generated from a regression analysis. The analysis had whether or not someone felt insecure as the dependent variable. The independent variables included age group (18-34, 35-54, 55+), sex (male or female), settlement type (Tbilisi, other urban, or rural), education level (secondary, vocational, tertiary), wealth (an index of durable goods owned by the respondents’ household), ethnicity (ethnic minority or ethnic Georgian), employment (working, unemployed, or outside the labor force), and party support (Georgian Dream, United National Movement, other opposition, refuse to answer/don’t know/no party). This article only reports on statistically significant differences between groups.

The data used in this article is available here.

Tuesday, May 16, 2023

What Do The 'Tragic Consequences' Of Colour Revolutions Actually Look like?

Note: This article first appeared on the Caucasus Data Blog, a joint effort of CRRC Georgia and OC Media. It was written by Givi Silagadze, a Researcher at CRRC Georgia.The views presented in the article are of the author alone, and do not necessarily reflect the views of NDI, CRRC-Georgia, or any related entity.

While Russia regularly warns against the supposed negative consequences of ‘colour revolutions’, data from the Varieties of Democracy project suggests that anti-regime protests leading to changes of government in former Soviet countries have led to lower corruption, cleaner elections, and more vibrant civil society.

Fearing unrest in their region, Russia’s President Vladimir Putin and the Russian government often refer to the threat of ‘colour revolutions’ dislodging the existing government in neighbouring countries, maintaining that the West is working hard to engineer such a turn of events.

Most recently, Russia’s Foreign Minister Sergey Lavrov, claimed that the 7-9 March protests in Tbilisi were ‘of course being orchestrated from abroad’, and noted that they looked ‘very much like the Kyiv Maidan’.

The outcomes of such protests are clearly implied to be damaging, an idea occasionally explicitly stated: in 2014, Putin, commenting on a popular uprising in Russia, claimed that colour revolutions led to ‘tragic consequences’.

But what do these tragic consequences look like? Data shows that colour revolutions in Armenia (2018), Georgia (2003), and Ukraine (2004, 2014) were associated with reduced corruption, decreased clientelistic relationships between politicians and voters, freer and more vibrant civil society, cleaner elections, and greater freedom.

However, Kyrgyzstan’s Tulip revolution does not appear to have prompted such a clear post-revolutionary improvement on any of these measures.

The Varieties of Democracy (V-Dem) project relies on expert surveys to annually assess 450+ measures of democracy in almost all countries of the world.

One indicator measures how routinely public sector employees grant favours in exchange for bribes, kickbacks, or other material rewards. In all the selected countries except Kyrgyzstan, the post-revolutionary periods showed decreases in corruption in the public sector. The improvement was the most visible and substantial for Georgia.

Another


Another measure is of regime corruption, which aims at addressing the question: to what extent do political actors use a political office for private or political gain? On this measure, the picture is similar — revolutions in Armenia, Georgia, and Ukraine were associated with a decline in the magnitude of regime corruption. Exceptions to the pattern were the 2004 Orange Revolution in Ukraine and the 2005 Tulip Revolution in Kyrgyzstan, which did not appear to lead to any changes in regime corruption in the countries.

Another indicator of healthy political life is the absence of clientelism. Clientelism refers to a relationship between political actors and voters in which voters’ political support is contingent on targeted rather than public distribution of resources such as jobs, money, and services. The chart below suggests that revolutions in Armenia, Georgia, Ukraine, and Kyrgyzstan were associated with a decline in the extent to which politics was based on clientelistic relationships. 


A free and vibrant civil society is a necessary and important component of a well-functioning democracy. The data suggests revolutions led to improved scores, with a decrease in government repression of civil society organisations.


Moreover, the revolutions in Armenia, Georgia, and Ukraine were clearly associated with greater civil society participation, which implies a larger involvement of people in CSOs. As for Kyrgyzstan, it took several years before the country registered improved scores for greater civil society participation.


Revolutions also often promise cleaner elections: that is, elections with less registration fraud, systematic irregularities, government intimidation of the opposition, vote buying, and election-related violence. While Ukraine after 2014 and Kyrgyzstan after 2005 did not see such improvements, Georgia and Armenia did gain cleaner elections.


However, the electoral democracy index (a composite index aiming at assessing to what extent a political system satisfies the core value of making rulers responsive to citizens) measured substantial improvements in the post-revolution periods of all four selected four countries, suggesting that political leaders were more responsive to the needs of their population following a revolution.


As for freedom of expression and alternative sources of information, post-revolution improvements were seen in all four countries. However, it must be noted that in Georgia, the Rose Revolution did not result in immediate improvements. Georgia’s scores for freedom of expression and alternative sources of information significantly improved only after 2012, when the first peaceful transition of government took place in the country.


Finally, when it comes to civil liberties, the revolutions in the four countries led to better scores. Civil liberties are understood as the absence of physical violence committed by government agents and the absence of government constraints on private liberties and political liberties.


So what Putin describes as the ‘tragic consequences of colour revolutions’ appear, on closer examination, to be less corrupt state institutions, healthier and more democratic political processes, greater participation of civil society, and better-respected freedoms and liberties; perhaps not so tragic after all.

Tuesday, May 02, 2023

Who Wants To Leave Georgia?

Note: This article first appeared on the Caucasus Data Blog, a joint effort of CRRC Georgia and OC Media. This article was written by Elene Ergeshidze, a Researcher at CRRC-Georgia. The views expressed in the article are the author’s alone and do not reflect the views of CRRC Georgia or any related entity.

CRRC data suggests that every fifth person was considering leaving Georgia for work in 2023, with men, younger people, people with poorer economic standings, and supporters of the opposition reporting that emigration is a better option than staying in Georgia.

Emigration has become a hot topic in everyday discourse in Georgia; the media is rife with stories about people who have decided to leave their jobs and families in search of better opportunities in the West, with many migrants taking significant risks through illegal emigration to Mexico in search of the American Dream.

Data published by Mexico indicates that 9,468 Georgians crossed the border between 2021 and 2023. A recent report from Georgia’s National Statistics Office shows that 125,269 people emigrated from Georgia in 2022, the vast majority of whom were Georgians. This is a 25.3% increase compared to statistics from 2021.

Data from CRRC and NDI’s regular surveys suggests that a significant share of the public was considering migrating for work in 2023.

The survey, conducted in December 2022, showed that every fifth person in Georgia reported that it was very likely (3%) or likely (16%) that they will go abroad for work in the next 12 months.

The data show that a number of groups are more likely to be considering migrating for work than others.

Men are ten percentage points more likely to report they are willing to go abroad for work than women, controlling for other factors. 

People under 55 are substantially more likely to be interested in going abroad for work. While 18–34-year-olds are 24 percentage points more likely to report they are interested in going abroad in the next 12 months, 35–54-year-olds are 21 percentage points more likely to say they want to leave than people 55 and older.

After controlling for other factors, a quarter of the people in Tbilisi (27%) are considering emigrating abroad, compared with one in six residents of other urban (21%) and rural areas (16%).

Ethnic minorities were eight points more likely than ethnic Georgians to be interested in emigration.

Opposition supporters are ten percentage points more likely to be interested in migrating abroad for work than Georgian Dream supporters, controlling for other factors.

When it comes to economic factors, those who reported that their household either doesn’t have enough money for food or is only able to buy food but not clothes were more likely to report wanting to emigrate than those who are better off.

There was no statistically significant difference between employed and unemployed people in terms of migration interest.

Note: The chart above was generated from a regression model. The model includes gender (male, female), age group (18–34, 35–54, 55+), settlement type (capital, urban, rural), education (secondary or lower, secondary technical, tertiary), ethnicity (Georgian, ethnic minority), party respondent names as closest to his/her views (Georgian Dream, opposition party, did not name a party (Don’t know, Refuse to answer, No party)), employment status (Employed, unemployed), and a household’s economic situation.

Despite the difficulties associated with emigration, many people see going abroad for work in 2023 as a better option than staying in Georgia. This applies especially to men, younger people, residents of Tbilisi, ethnic minorities and those who report having poorer economic standing. Time will tell how this attitude will be reflected in actual migration statistics.


This article was written by Elene Ergeshidze, a researcher at CRRC-Georgia. The views expressed in this article are the author’s alone and do not necessarily reflect the views of CRRC-Georgia, NDI, or any related entity.

The data used in this post are available here.