Showing posts with label Poverty. Show all posts

Tuesday, May 23, 2023

What Makes People Feel Insecure in Georgia?

 Note: This article first appeared on the Caucasus Data Blog, a joint effort of CRRC Georgia and OC Media. It was written by Dustin Gilbreath, a Senior Non-Resident Fellow at CRRC Georgia. The views presented in the article are of the author alone, and do not necessarily reflect the views of NDI, CRRC-Georgia, or any related entity.


A CRRC analysis found that Georgians who feel insecure in Georgia mostly attribute this to economic insecurity, but also express concern about a wider array of harder security issues.

Georgia has faced numerous crises in recent years; from the pandemic, to the results of the war in Ukraine, via political controversy and uncertainty.

It is consequently perhaps unsurprising that almost half the public is uncertain about how they will fare economically in five years’ time. This is reflected in recent data, which shows that economic insecurity is the main reason why Georgians feel insecure in Georgia. However, a wide array of harder security issues also contribute to people feeling insecure in the country.

In the December 2022 NDI and CRRC Survey, the public was asked whether they felt insecure or secure living in Georgia. A third reported that they felt either very insecure living in Georgia (8%) or more insecure than secure (26%). By comparison, about half of the public reported that they were more secure than insecure (47%). One in five (19%) felt that they were very secure living in Georgia.

Why do people feel insecure?
Amongst those who felt insecure living in Georgia, economic issues were the main reasons given for their sense of insecurity.

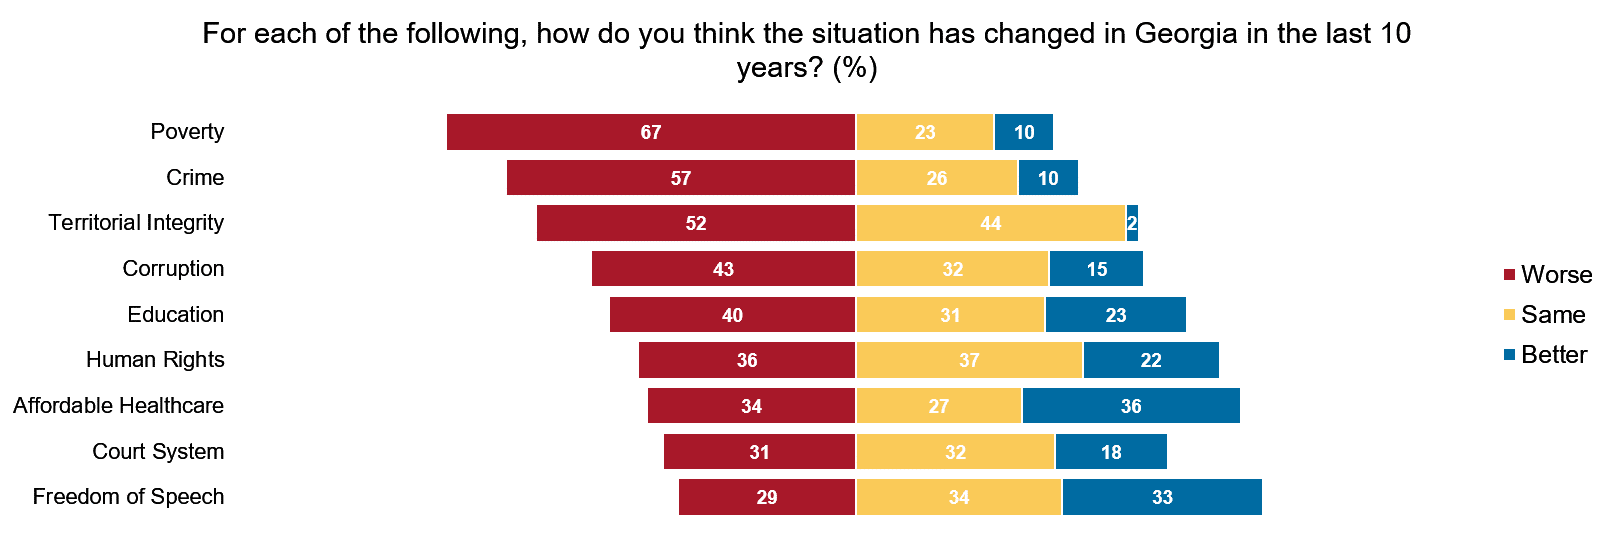
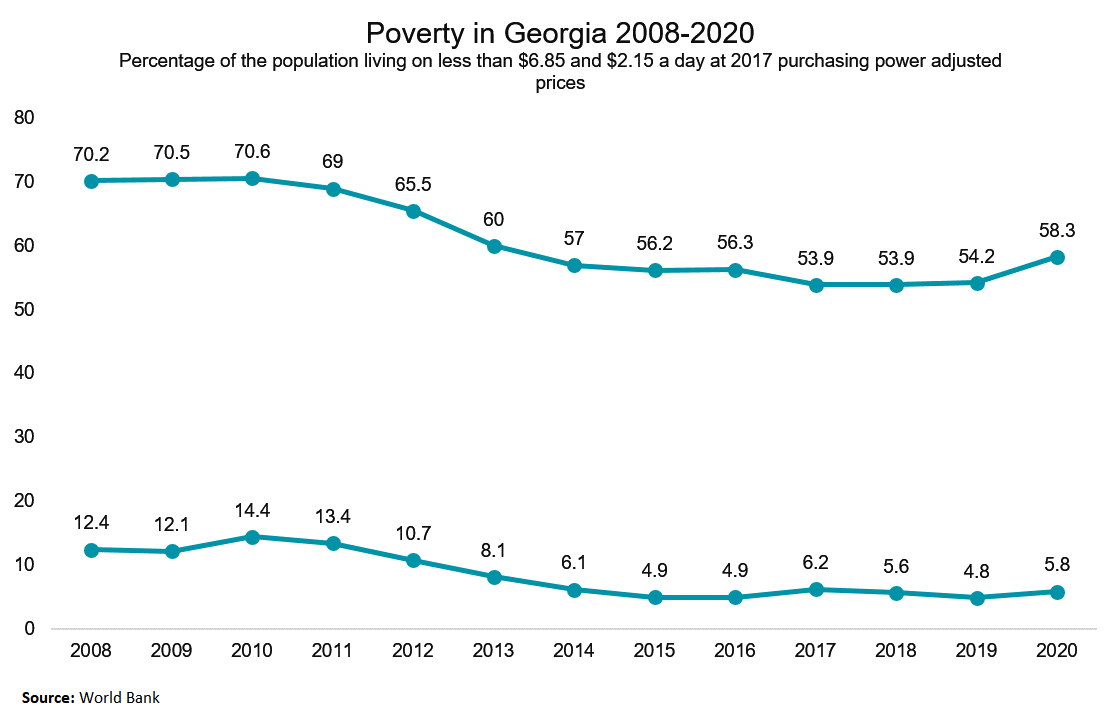
The top three issues named were poverty, inflation, and unemployment, with between 34% and 39% of respondents naming one of these options.

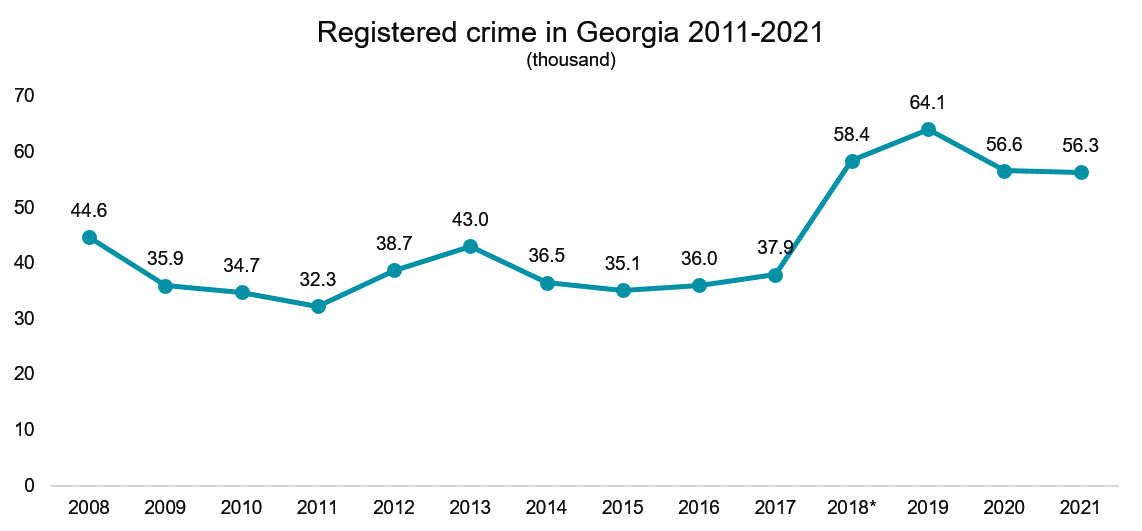
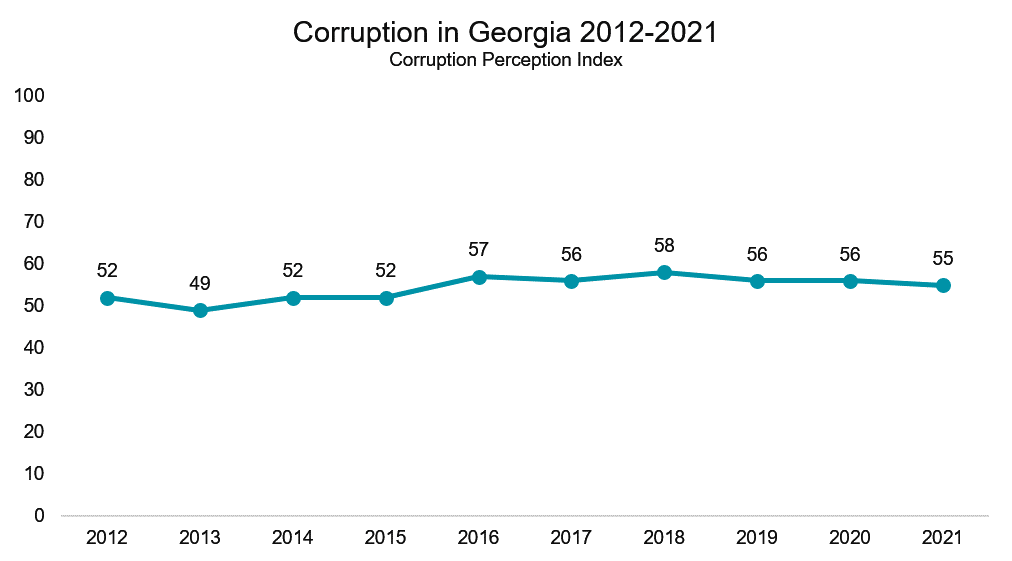
Crime was identified as the main reason for feeling insecure by a third of relevant respondents, and political instability by one in five. Healthcare and the high price of drugs were named by 7% and 10% of relevant respondents, respectively. Harder security issues such as the war in Ukraine, and instability in the Caucasus were named by relatively few; 5% and 1%, respectively. 


Note: Because respondents could name up to three responses to this question, the data does not sum to 100%.

The above issues were grouped into economic, hard security, and social policy related issues. Economic issues included poverty, inflation, and unemployment. Crime, violence, political instability, territorial integrity, the war in Ukraine, actions by Russia towards Georgia, and instability in the Caucasus were grouped into hard security issues. All other options were grouped together into social policy issues.

While the most commonly cited issues are mainly economic, people’s concerns were multifaceted. The data found that 66% of those who felt insecure named at least one economic issue, 62% named at least one hard security issue, and 32% named one social policy issue, suggesting that similar shares of people are concerned about at least one economic issue and at least one hard security issue. 

WHO FEELS INSECURE?

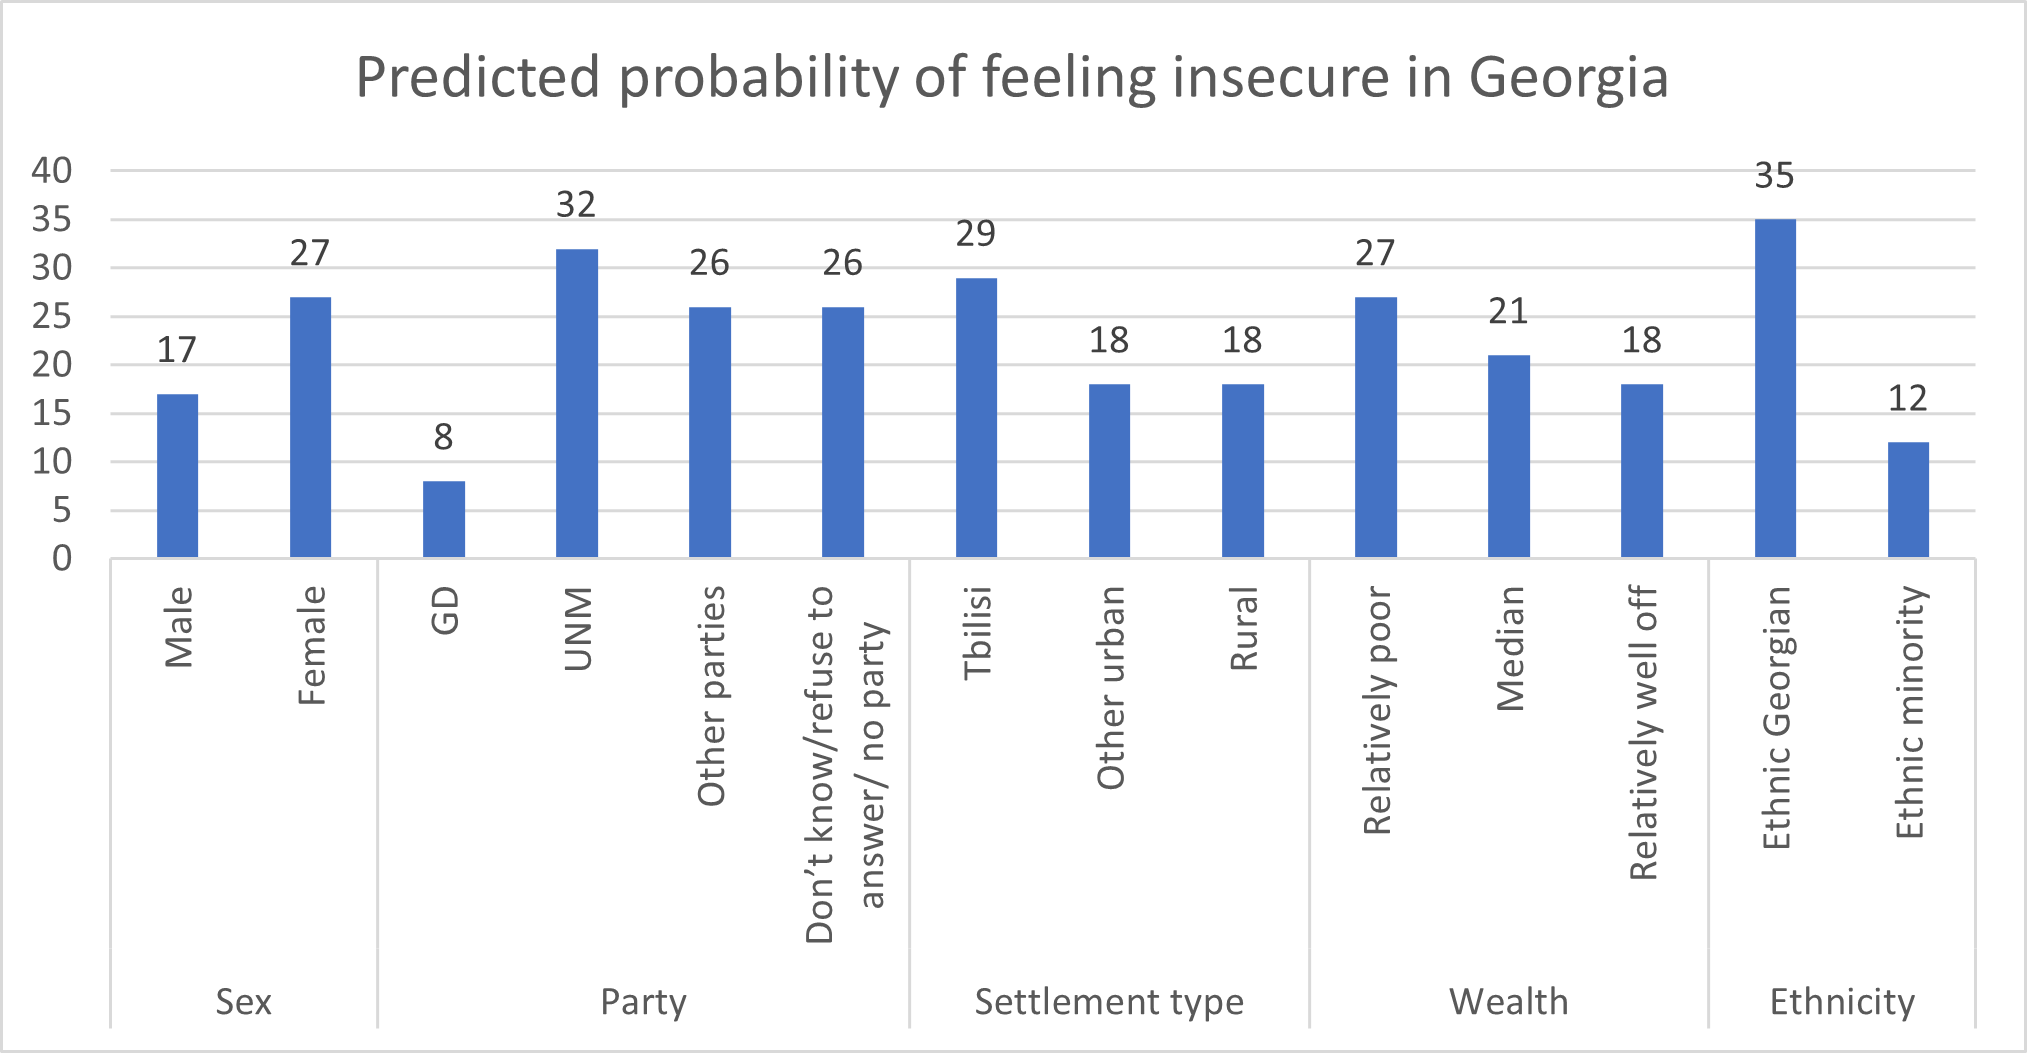
Given the dominance of economic issues as a reason for feeling insecure, it is perhaps unsurprising that people living in poorer households are more likely to feel insecure, and cite economic issues more than people living in relatively well-off households.

A number of other patterns are also present.

Women are ten points more likely to feel insecure in Georgia, controlling for other factors, than men. 

People in Tbilisi are 11 points more likely to feel insecure than people outside Tbilisi. 

Ethnic Georgians are 23 points more likely to feel insecure in Georgia than ethnic minorities.

Supporters of the United National Movement, Georgia’s main opposition party, are 24 points more likely to feel insecure in Georgia than supporters of the ruling Georgian Dream party. People who support other parties or report not supporting any party are 18 points more likely to feel insecure in Georgia than supporters of Georgian Dream.


The above data shows that a third of Georgians feel insecure in the country. While recent large-scale instability in Georgia has related more to hard security issues, such as the war in Ukraine, the data shows that economic insecurity remains the greatest concern for people who feel insecure in the country.

Note: The social and demographic breakdowns shown in the article above were generated from a regression analysis. The analysis had whether or not someone felt insecure as the dependent variable. The independent variables included age group (18-34, 35-54, 55+), sex (male or female), settlement type (Tbilisi, other urban, or rural), education level (secondary, vocational, tertiary), wealth (an index of durable goods owned by the respondents’ household), ethnicity (ethnic minority or ethnic Georgian), employment (working, unemployed, or outside the labor force), and party support (Georgian Dream, United National Movement, other opposition, refuse to answer/don’t know/no party). This article only reports on statistically significant differences between groups.

The data used in this article is available here.

Tuesday, December 06, 2022

How has Georgia changed in the last decade?

Note: This article first appeared on the Caucasus Data Blog, a joint effort of CRRC Georgia and OC Media. It was written by Givi Silagadze, a Researcher at CRRC-Georgia, The views presented in the article are of the author alone, and do not necessarily reflect the views of CRRC-Georgia, or any related entity.

A recent survey suggests that Georgians tend to believe that poverty, crime, and corruption have increased in the last decade, while affordable healthcare has become more accessible. However, available public data does not always match these assessments. 

Recent public opinion surveys suggest that Georgians feel increasingly worried about where the country is headed. As of August 2022, less than a quarter of the electorate believed that Georgia was going in ‘the right direction’. 

While the overarching assessment is quite negative, the public’s views on specific issues is more variable, adding nuance to the picture. 

The August 2022 CRRC/NDI survey asked respondents how they thought things had changed over the last decade in Georgia, in nine key policy areas. According to the data, at least half of the public think poverty, crime, and territorial integrity have worsened over the last decade.  In contrast, the public was most positive about progress in terms of affordable health care and freedom of speech, with roughly a third of the public believing the situation had improved for both issues.

While two thirds of the public think that poverty has worsened, World Bank data suggests that poverty in Georgia has declined over the past decades. Although there are ups and downs in the data over the years, there has been a decline in the share of Georgians living on under $6.85 (converted into purchasing power parity) a day, from 66% in 2012 to 58% in 2020. The percentage of Georgians living in poverty did, however, increase in 2020, likely in response to the pandemic. A similar trend is present for the $2.15 poverty line (converted into purchasing power parity), with declines from 11% to 6%.

Roughly three in five Georgians (57%) believe that crime has worsened over the last decade. Official statistics seem to confirm people’s negative views, with Georgia registering 56,300 crimes in 2021, compared to less than 40,000 ten years prior. However, in 2018 the Ministry of Internal Affairs changed its crime recording methodology in a way that meant that a greater range of crimes were recorded. As a result, it is not possible to unequivocally claim that crime has substantially increased over the last 10 years.

Two in five Georgians think that corruption (43%) has worsened in the last decade. However, the Corruption Perception Index (CPI) suggests that corruption has not varied much over the last decade, with a slight improvement from 2013-2018 and slight decline since.

With regards to education, 40% of the public feel it has worsened. But data from the Programme for International Student Assessment (PISA), a study intended to evaluate national education systems, suggests that Georgia has slightly improved its scores in the last decade, albeit with a slight decline since 2015. 

Some of the most positive public assessments were for affordable healthcare. About a third of the public (36%) believe that the situation around affordable healthcare has improved in the last decade. Data from the World Health Organisation appears to corroborate this, as it suggests that domestic private health expenditure in Georgia has declined as a share of total health expenditure from 77% to 59% of spending. However, it must also be noted that lesser private and greater public expenditure is no guarantee of better quality health care services. 

In terms of freedom of speech, a third of Georgians believe that it has improved over the last ten years. Data from the Varieties of Democracy project suggest that Georgia’s scores did improve in 2012-2013, but have declined since 2016. 

As for the court system, roughly one in three people (31%) think it has worsened over the last decade, but the Varieties of Democracy project suggests that Georgia’s score on the rule of law index has not changed since 2008. 

The public tends to think that the situation in Georgia in terms of poverty, crime, and territorial integrity has worsened over the last decade, while feeling most positive about freedom of speech and access to affordable healthcare. However, these sentiments are not reliably supported by publicly available data on the issues.

Monday, February 26, 2018

Debt in Georgia: People living in worse-off households report having personal debt more often

According to CRRC’s 2017 Caucasus Barometer (CB) survey, 46% of the population of Georgia report having personal debt. Although having debt is not necessarily a bad thing, since it can enable investment to help improve a person’s economic conditions, a close look at the CB 2017 data suggests that many people in Georgia take on debt to cover basic expenses.

In addition to the question about personal debt, CB 2017 asked whether households borrowed money to buy food and to pay for utilities in the past six months. Those who reported their household borrowed money to buy food reported having personal debt more often. The same is true of people who reported their household borrowed money to pay for utilities in the past six months. Importantly, the comparison of variables measuring personal-level and household-level information has methodological limitations and the results should thus be treated with caution.

Note: Answer options to the questions “In the past 6 months, how often has your household borrowed money to buy food / to pay for utilities?” were recoded for this chart. Options “Each week”, “Each month”, and “Every other month” were combined into the category “At least every other month”. For all questions, answer options “Don’t know” and “Refuse to answer” (less than 3% if combined) are not shown on the charts in this blog post. 

Another CB question asked respondents to place their household on an imaginary 10-step ladder reflecting the economic standing of all households in the country. Similar to the above, those who indicated lower rungs reported having personal debt more often. Interestingly, approximately a third of those reporting better economic conditions of their households also reported having personal debt.


Note: A 10-point scale was used for the question, “Let’s imagine there is a 10-step ladder reflecting the economic standing of all households in Georgia today. The first rung of this ladder corresponds to the lowest economic position in society, while the 10th rung corresponds to the highest position. On which rung of this ladder do you think your household currently stands?” For this chart, the original scale was recoded into a 3-point scale, with codes ‘1’, ‘2’, ‘3’, and ‘4’ combined into the category “Low”; codes ‘5’ and ‘6’ combined into the category ”Middle”; and codes ‘7’, ‘ 8’, ‘9’, and ‘10’ combined into the category “High”. 

People living in worse-off households report having personal debt more often than those living in better-off households. However, people living in better-off households are not debt-free either.

To have a closer look at CRRC’s Caucasus Barometer data, visit our Online Data Analysis portal.

Monday, May 15, 2017

Debts and Loans in Georgia (Part 2)

The first part of this blog post showed that people who report being in a worse economic situation are more likely to have debts in Georgia. In the second part of this blog post, a new variable is added to the analysis, “Does anyone owe you any money?”

While 46% of the population of Georgia report having debt, only 20% report that someone owes them money. In the latter, group, there are no differences by gender and settlement type, but there are differences by age. People between 36 and 55 years of age are more likely to say that someone owes them money. As seen in the first part of this blog post, people in this age group are also most likely to report they have personal debts.

The cross tabulation of the questions about having debt and being owed money shows that people who are owed money are slightly more likely to have debts.


A new variable, “Debts and Loans,” was created to group people into four categories based on the two CB questions discussed above.


Forty four percent of the population of Georgia are part of the largest group who report neither having debts nor being owed any money. These people are neither better off nor worse off compared to the population on average. The second largest group has debts but no one owes them money. They appear to be in the worst economic situation, with the greatest share of people saying they do not have enough money for food and for clothes in comparison to other groups. The two smallest groups are people who say someone owes them money. The two groups who have no debts appear to be in a relatively good economic situation, with the largest shares of people saying they can afford expensive durables.


Based on the findings presented in both parts of this blog post, debts are approximately twice as common in Georgia as being owed money. Yet, the largest share of the population of the country are those who report neither having debts, nor being owed money.

To look at these issues in more detail, explore the Caucasus Barometer data at CRRC’s Online Data Analysis platform.

Thursday, May 11, 2017

Debts and Loans in Georgia (Part 1)

In Georgia, where, according to the World Bank, a third of the population live on under USD 2.5 per day, poverty and unemployment are consistently considered the most important issues facing the country. For those who are struggling financially, borrowing is a widespread coping mechanism. While access to credit can have benefits, debt can also have psychological costs, such as increased stress and anxiety. CRRC’s 2015 Caucasus Barometer (CB) data show interesting patterns about having personal debts in Georgia. The first part of this blog post focuses on the characteristics of those who report having personal debts in Georgia, while the second part looks at the money lending patterns, as well as reported well-being of people who are owed money or who borrow it.

In response to the question, “Do you currently have any personal debts?” which asks about all types of debt a person may have, 46% of the population report having debts and 53% say they do not have any. There are no large differences by settlement type. People between 36 and 55 years of age report having debts more frequently than people in other age groups. Men report they have debts slightly more often than women.


Note: The charts in this blog post do not include answer options “Don’t know” and “Refuse to answer,” which constituted 1% of responses.

People reporting a more difficult economic situation in their household are more likely to say they have debts. While 55% of people who state they do not have enough money for food report having debts, 28% of people who have enough money for durables report the same.


Note: Answer options “We can afford to buy some expensive durables like a refrigerator or washing machine” and “We can afford to buy anything we need” were combined into the category “Can afford to buy expensive durables” on the chart above.

In the second part of this blog post, which will be published on Monday, patterns of both borrowing and lending money will be discussed.

To have a closer look at the Caucasus Barometer data, visit CRRC’s Online Data Analysis platform.

Monday, November 09, 2015

Household income and consumption patterns in Georgia


After the collapse of the Georgian economy in the 1990s, the country slowly started to recover, and between 2000 and 2014, the gross national income grew from $3.4 billion to $16.7 billion (in current USD). According to the National Statistics Office of Georgia, the official unemployment rate in Georgia was 12.4% in 2014, but according to numerous surveys the rate is much higher. Compounding matters, the low salaries of the majority of those who are employed make it difficult for many families to make ends meet. According to World Bank statistics in 2012, 15% of Georgians still live below the national poverty line, which is slightly under $1.25 a day.

Classic micro-economic theory tells us that consumption depends on income levels, but also on the type of good. Normal goods, a good example of which in Georgia would be an Opel Astra if we are talking about cars, are consumed less when income falls. Inferior goods, on the other hand, are consumed when consumers do not have enough money to buy something better – with cars, one would choose a Zaporozhets instead of an Opel. Or, when a family’s budget is tight, they might buy no-name sports shoes rather than Nikes, or a standard mobile phone rather than a smart phone. Finally, demand for luxury goods (a Land Rover instead of an Opel) increases more than proportionately as incomes increase.

Recently, we saw that most people in Armenia, Azerbaijan, and Georgia cannot afford to buy certain durable goods. But, when income is scarce, it also obviously influences everyday choices, such as what to eat for dinner, when to turn on the heater, and whether to buy your child that chocolate bar she really wants.  

So how does the consumption of everyday goods differ by income level in Georgia? The chart below shows the percentage of households in Georgia which report restricting consumption of certain foods because of their limited income.


Note: The original scale measuring household income was recoded for this chart. GEL was converted into USD. The income groups “USD 401-800”, “USD 801-1200” and “More than USD 1200” were combined into “More than USD 400” and the groups “USD 0”, “Up to USD 50” and “USD 51-100” were combined into  “Up to USD 100”. Only “yes” answers are reported. Error bars indicate a 95% confidence interval.

As expected, the percentages of households limiting consumption differ by income group, with households in the highest income group limiting their consumption the least. Importantly, this trend is obvious in spite of the fact that we did not control for the size of households for this blog posts, i.e. did not take into account per capita income of the household members, or number of children or elderly in the households.

Even in the group with the highest household income, about one in four households limits consumption of beef – and reports doing so solely due to budgetary difficulties. In the $251-400 income group, between 8% (potatoes) and 54% (beef) of Georgians say they restrict consumption of certain goods. In households with an income between $101-250 these shares increase to 14% and 76%. In the poorest households, with less than $100 income per month, four out of five households report limiting consumption of beef and one out of five limits even the consumption of staple foods like potatoes.

In each income group, the highest percentage of households limits consumption of beef and sweets/chocolate, while the smallest percentage limits consumption of potatoes. Milk and vegetables are somewhere in between. In addition to the obvious explanation suggesting that higher shares of households limit consumption of beef and sweets/chocolate simply because these are relatively expensive, this trend might also be explained by what economist call income elasticity of demand. The concept is a measure of how sensitive consumption is to changes in income. Among food products, beef and sweets are probably seen more as luxury rather than absolute necessities, because of comparatively high prices and potential substitutes.

Hence, how Georgians limit their food consumption differs by both income group and type of food. Yet, looking at this issue only from the monetary income perspective does not take into account cases when, in rural settlements, families produce their food themselves.

Interested in this or a similar topic? Browse the Caucasus Barometer and other CRRC survey data here.

Monday, January 26, 2015

Well-being of the elderly in the South Caucasus: A problem today, a bigger problem tomorrow

The world population is getting older, and this trend will likely continue as a result of decreasing mortality and declining fertility. International organizations predict that the aging of the population will cause economic problems in countries that already have difficulties in providing proper welfare for the elderly. The countries of the South Caucasus are no exception in this regard. According to the Global AgeWatch Index, by 2050, the population over the age of 60 will exceed 30% in Armenia and Georgia and reach nearly 26% in Azerbaijan, compared with, 14.7% 20.1%, and 8.8%, respectively, at present. This blog post examines the demographic composition and economic situation of the elderly in the South Caucasus countries based on 2013 CRRC Caucasus Barometer (CB) survey data. The post focuses on people who are at or above the standard retirement age (63 years old or older for men and women in Armenia, 59.5 years old or older women and 62 years old or older men in Azerbaijan, and 60 years old or older women and 65 years old or older men in Georgia), and when asked about their primary activity or situation, report that they are retired and not working. This group constitutes 12% of all respondents in CB 2013, and will be referred to as the ‘elderly’ throughout the blog post. The elderly who are at or above retirement age, but still work, are not included in the present writing. After examining the amounts and sources of income the elderly have, the blog reviews self-assessments of whether that income is enough to cover basic needs. 

In all three South Caucasus countries, citizens receive an old age pension, regardless of whether they worked or not. In Armenia and Georgia, the average pension (USD 63 and USD 81, respectively) is close to the official subsistence minimum (USD 65 and USD 79, respectively), while in Azerbaijan the average pension (USD 190) is somewhat higher than the subsistence minimum (USD 160). It should be noted that cost of living is also higher in Azerbaijan. As pensions are close to the subsistence minimums, a very low income level, the economic condition of the elderly is challenging. 

According to CB 2013, more than half of the elderly in Armenia and Azerbaijan, and two thirds in Georgia are women, which can be explained by the shorter life expectancy for males. In Azerbaijan and Georgia, more old people live in rural areas than in Armenia, and more than 40% of them in Azerbaijan and Georgia are widowed, compared with 34% in Armenia. Sixteen percent of the elderly in Georgia live alone, compared with 12% in Armenia and 7% in Azerbaijan. It is probably, in part, due to this last finding that elderly household income in Azerbaijan is higher than in other countries – the last month’s household income for more than 70% of Georgian and Armenian elderly was USD 250 or lower, while in Azerbaijan 70% had more than USD 250. Salaries were named as a source of household income by the Azerbaijani elderly more often than in Armenia and Georgia, likely because they are less likely to live alone. 

Note: The chart only shows the percentage of “Yes” responses for the five most frequently named sources of income.

When asked to rate their households’ economic situation on a ten-point scale, the majority of the elderly in all three countries named middle and low positions – codes “5” or lower. The elderly in Armenia assessed their households’ economic situation worse than in Azerbaijan and Georgia. In Armenia 52% of the elderly state that money is not enough for food while, 26% and 39% in Azerbaijan and Georgia report the same.

The poor economic situation of the elderly is further demonstrated by their need to borrow money for regular expenses. The elderly in all three countries report borrowing money for food, although, Georgians and Azerbaijanis do so less frequently than Armenians. Nearly a third of the elderly in Armenia say they borrow money for food at least monthly, while only 15% in Azerbaijan and Georgia say the same. The elderly in all three countries are less likely to borrow money to pay for utilities than to buy food.

Besides borrowing money for food and utilities, the elderly report limiting their consumption of certain products. Although such limitations are characteristic of all age groups, the elderly are more likely to do so compared to the rest of the population. Most elderly people state that they limit their consumption of meat and fish. Nearly half of Armenia’s elderly say they also limit consumption of butter and milk, while only 21% of Azerbaijanis and 31% of Georgians report the same. Armenians are also much more likely to limit consumption of fish, fruits and vegetables.

Thus, the economic condition of the elderly in the South Caucasus countries is unsatisfactory. Most of the elderly, especially in Armenia, state that their income is not enough for food and utilities. Consequently, they have to borrow money and limit consumption of certain products. This can be considered a cause for concern, especially as the share of the elderly population will increase in the upcoming decades, and the state will face further economic challenges without having worked out those of today.

Tuesday, March 04, 2014

Health in the South Caucasus

With the recently concluded Olympics in Sochi and the controversies surrounding them, one might be interested in understanding how populations in the South Caucasus think about health and sport. What factors are related to perceptions of health in Armenia, Azerbaijan and Georgia? This blog explores perceptions of health, economic well-being, as well as whether a household limits its consumption of beef as one of many indicators related to a household’s economic situation.

South Caucasians who say they exercise for at least two hours a week are more likely to rate their health better than those who do not exercise at least two hours per week. The following graph depicts this trend in Armenia, Azerbaijan, and Georgia, and consistently shows that those who believe they are in good health are much more likely to say they exercise for at least two hours a week compared to those who report poor health.


Note: In this and following charts, the original five-point scale for the question, “Overall, how would you rate your health,” has been collapsed to a three-point scale by merging “very poor” and “poor”, and “very good” and “good.”

Additionally, people who consider their households to be on a higher economic rung in society tend to rate their health more positively. Respondents were asked to imagine there is a 10-step ladder reflecting the economic standing of all households in their country, such that the first rung corresponds to the lowest possible economic position in society, while the highest rung refers to the highest possible position. The following graph demonstrates this trend in the South Caucasus. In Georgia, where the trend is most pronounced, only 27% and 34% of families who report being on either the first or second rung report being in good health, whereas 91% and 59% of families who reported being on the fifth or fourth rung respectively, reported being in good health. This trend can be seen throughout the South Caucasus and suggests that the higher economic rung a family perceives itself to be on, the more likely they are to report good health.


Note: The first rung corresponds to the lowest possible economic position in society, while the highest rung refers to the highest possible economic position in society. Results were collapsed from an original 10-point scale.

Whether a family owns or consumes a number of consumer goods is a common indicator of well-being. The following graph looks at whether a household limits its consumption of beef and perceptions of health. As the graph indicates, families that are less likely to limit the amount of beef they eat are also more likely to report being in good health. Furthermore, the trend also largely holds for the consumption of many other foods and consumer products, as well as whether a family owns certain durable goods such as a personal computer.


This blog shows that health and perceptions of one’s household economic situation are related. Higher perceived economic status is related to more positive feelings about one’s health in the South Caucasus. What other factors might be at work when looking at how healthy one feels and how often one exercises? We encourage you to explore our data to find out more about health and exercise in the South Caucasus with our online data analysis tool here.


Tuesday, February 04, 2014

Income Levels in Georgia from 2008 to 2013

Following the world financial crisis of 2007-2008 and the global recession of 2008-2009, GDP growth slowed and unemployment increased in many countries. From a peak of 12.34% GDP growth in 2007, Georgia’s GDP contracted by 3.78% in 2009, leveling out to an average of 6.4% GDP growth over 2010 to 2012. Official unemployment in Georgia also worsened over that period, starting at 13.3% in 2007, peaking at 16.9% in 2009 and falling down to 15% by 2012. However, over the same period of time, GDP per capita in Georgia increased from USD 2,920 in 2008 to USD 3,490 in 2012. Household monetary income and ownership of consumer goods, in particular, have noticeably increased since 2008 in Georgia.
Comparing data from CRRC’s Caucasus Barometer (CB) 2008 and 2013, the percentage of Georgian households earning under USD 100 per month has decreased by 10% since 2008, and 15% more households now earn over USD 100 per month. The greatest decrease occurred in the USD 51-100 bracket (down 6%) and the greatest increase occurred in the USD 101-250 bracket (up 10%) indicating that the greatest shift in income occurred from Georgian households crossing the USD 100 per month threshold. Household income is higher in urban than in rural areas in Georgia; 51% of urban households have monthly incomes of under USD 250, but 72% of rural households do.


Household spending is also up. In 2008, 30% of households spent under USD 100 per month and 54% over USD 100. In 2013, only 18% of households spent under USD 100 per month and 72% spent over USD 100 per month, including 37% that spent over USD 251 per month.
Supporting this income and spending data is the increase in household ownership of consumer goods from 2008 to 2013. The most dramatic increases from 2008 to 2013 have been in automatic washing machine ownership (27% to 51%) and cell phone ownership (65% to 89%). Aside from car ownership, urban household ownership of consumer goods is 10-30% higher than that of rural households, depending on the item in question.


Households have also had to limit their consumption of food, utilities and transportation due to budget difficulties less frequently. Electricity is the only item that appears to have remained constant with respect to households’ need to limit their consumption. There is no statistically significant difference between urban and rural households in their limiting of consumption in the mentioned areas.


Some indicators have not shifted significantly since 2008. The frequency of households borrowing money for food or utilities has not changed significantly, and the perceived relative economic condition of Georgians has notably decreased since 2008. Also, considerably more Georgians consider themselves poor or very poor relative to other Georgians than they did in 2008.


Only 19% of Georgians believe that up to USD 400 is the minimal monthly income for a normal life, yet 76% of Georgian households earn under USD 400 monthly. However, 61% of Georgians believe that their children will be financially better off at their age, against only 5% viewing their children as the same or worse off. Georgians consider education (28%), the country’s economic situation (16%), and the ability to work hard (15%) to be the three most important factors that will contribute to their children being better off. For more information on income levels in Georgia please view CRRC’s online data analysis tool.

Monday, August 19, 2013

Material deprivation and quality of life in the South Caucasus

Quality of life and life satisfaction has been a central topic in social science research, as well as an increasingly popular area of interest for many policy makers. Balanced development is especially important in developing societies where political and economic changes can impact social inequality, as well as material wealth and health. This post uses data from the Caucasus Barometer (CB) 2012, as well as the Life in Transition (LIT) 2010 survey (carried out jointly by the European Bank for Reconstruction and Development and the World Bank) to explore issues detrimental to the general quality of life in the South Caucasus region. These issues include the material situation of households (as reflected in the consumption of goods and services), and its impact on health-related indicators and general life satisfaction across the region.

According to the 2010 LIT survey, the average amount of monthly savings was 1628 dram ($4) in Armenia, 7 manat ($9) in Azerbaijan and 10 lari ($6) in Georgia. However, the standard deviation from the mean was high for all 3 countries, which means there were substantial differences between the amounts of money saved by different individuals. This is also reflected in relatively high values of the GINI coefficient for income in these countries. The coefficient measures inequality in income distribution within a population. Across the region the values of the GINI index were 31.3 for Armenia (2010), 33.7 for Azerbaijan (2008) and 42.1 for Georgia (2012), as reported by the World Bank.

Unequal income distribution and material deprivation are also apparent in differences in food consumption across all households included in the CB 2012. The survey asked about which of the following products households limits due to financial reasons: bread and pasta, butter and milk, poultry, beef, pork, fish, fruit and vegetables, potatoes, sweets and chocolates. From this list, 80% of households in Armenia, 66% in Azerbaijan and 74% in Georgia cut down on the consumption of at least one type of food products due to financial constraints.


In terms of the purchases of goods and services such as electricity and gas, slightly more than half of Armenians (55% and 58%, respectively) and Georgians (52% and 55%, respectively) limit their consumption of these items due to financial reasons. Azerbaijanis seem slightly less likely to do so with 49% cutting down on electricity or gas use, yet the difference between the values reported for Azerbaijan and Georgia is within the margin of 3% error. 

Material deprivation, both in the case of limited food consumption or utilities (electricity, gas) is significantly higher in the rural areas. These differences are highest in Armenia and lowest in Azerbaijan, where the difference between material deprivation in the capital and other urban areas is non-significant. 

Living conditions, including material difficulties, can have a substantial impact on overall life satisfaction. An examination of the effect of food limitations on life satisfaction, while controlling for type of settlement (urban, rural and capital), gender, and age shows that across all three countries the necessity to cut down on food consumption has a significant negative impact on the general quality of life. Multivariate regression analysis shows that a cut in each additional food item results in a significant drop in the average life satisfaction level. No cutback on food is used as a reference category in the model, while the other options included 1 to 9 indicating the food items. Gender is not found to affect the level of life satisfaction in any of the countries. Settlement type has an impact in Armenia and Azerbaijan where people living in the capitals declare, on average, significantly higher levels of life satisfaction than in the countryside.


Life satisfaction is not the only variable strongly related to material conditions. Depending on the economic situation of the household (e.g. those that need to limit food consumption, or other expenditures), the subjective assessment of individual health varies. People from poor households are significantly more likely to consider themselves to be in very poor or poor health. Causality is not established here though as poor health might be both the result as well as the reason for material deprivation.


The relationship between health and material deprivation is not a surprise and it has been well-researched in the social science. However, it deserves strong emphasis, taking into account the high number of households that needs to restrict their food and utilities consumption in the South Caucasus.

Monitoring changes in the material situation of households is thus of major importance. Analysis of a LIT 2010 question “My household lives better nowadays than around 4 years ago” shows substantial regional differences in this respect. According to the subjective individual assessment, the quality of life in Armenia and Georgia seems to have deteriorated rather than improved compared to around 4 year ago, whereas in Azerbaijan the assessment of the change in the household situation was more positive. 


As the most recent LIT data come from 2010, the situation and standards of living in Armenian, Azerbaijani and Georgian households might currently be different. Yet, as the CB 2012 shows, most households still face material problems that force them to limit consumption of basic products such as food. Since there is a significant positive relationship between the financial situation of a household and individual health and wellbeing, all of these factors require special attention and long-term monitoring in the region.

For more information on the current social and economic situation in the South Caucasus see our online database


Friday, July 13, 2012

Perceived Poverty in Georgia: Results of the 2011 Caucasus Barometer

The 2011 Caucasus Barometer asked the Georgian population, “Relative to most of the households around you, would you describe the current economic condition of your household as very good, good, fair, poor or very poor? The results revealed that 24% of Georgians rate their households’ economic condition relative to most households in Georgia as poor or very poor. 68% say it is fair and only 8% rate it as good or very good. Analysis shows that people in these three groups differ from each other, not only in terms of their perceived economic status, but also in a wide range of activities and feelings such as reading printed media, participating in social and cultural activities, and having feelings of happiness and good health.


Source: Caucasus Barometer 2011, Georgia
Note: In this and following charts the original five-point scale is collapsed to a three-point scale by merging “very poor” (1) and “poor” (2) as poor=1, and “very good” (5) and “good”(4) as good=3. The original score of 3 has been changed to 2 for fair. 

As the chart shows, people who consider themselves poor compared to most households in Georgia are less likely to read newspapers, spend time with friends, go for a walk, visit the theatre/cinema, do sports or exercise, or go to a public meeting than those who consider their economic status as fair or good. These data indicate that people who perceive their economic condition as good compared to most households in Georgia are forerunners in adopting a healthy life style and much more involved in social and cultural activities.

Moreover, the data show that there are some differences between these three groups in their health status, or to be more precise, in how they rate their health. The next chart shows that approximately one third (31%) of those who perceive themselves as poor compared to most households in Georgia rate their health as poor. This share decreases to 13% in the group of people who consider their economic status to be fair and to 4% for those who perceive their economic situation as good.

Source: Caucasus Barometer 2011, Georgia


Perceived poverty, less involvement in recreational activities and poor health status may be reflected in feelings of happiness. Indeed, data from the Caucasus Barometer indicate that people who perceive themselves as poor compared to most households in Georgia are more likely to say they feel unhappy.

Source: Caucasus Barometer 2011, Georgia


The chart shows that approximately one quarter (24%) of people who perceive themselves as poor are unhappy, while this share decreases to 3% in those who consider themselves to be in a better economic situation compared to most households in Georgia.

To conclude, the 2011 Caucasus Barometer data show that people in Georgia who consider themselves to be poor compared to most households in Georgia are less likely to spend time with friends, participate in different social and cultural events, or follow a healthy lifestyle (sports, exercise, hiking, etc.) than those who describe their economic condition as fair or good. These people are also less likely to consider themselves happy and rate their health as poor. 

The 2011 Caucasus Barometer offers more interesting data which is available and free on CRRC’s Online Data Analysis tool. Try it out!


Wednesday, November 02, 2011

A Further Look at Material Deprivation

Continuing to explore standards of living in the South Caucasus, this blog looks at the between four sources of household income and material deprivation using data from the 2010 Caucasus Barometer. Each of the four sources of income (salaries, pensions or government transfers, sales from agricultural goods, and remittances) are categorized by their importance to the household and then cross tabulated with material deprivation. The findings suggest that families reliant on salaries and remittances are better off, while families receiving pensions and government transfers, or those who sell agricultural products as their primary source of income have higher than average rates of material deprivation.

Salaries and pensions/government transfers are by far the most important sources of income, mentioned by around 50% of people in all three countries. Agriculture is mentioned as an income source by over 25% of respondents in Azerbaijan and Georgia, but is reported by only 17% of Armenians, where remittances are the third most common source of income. Twenty percent of Armenians and 17% of Georgians report income from remittances, but family transfers are relatively rare in Azerbaijan, with fewer than 7% reporting receiving remittances.
Chart 1


In the South Caucasus as a whole, people who list salaries as their household’s primary source of income have half the average material deprivation rate of 32%. By taking the ratio of the average rate of material deprivation (blue bar) and the material deprivation rate for salaries as the primary source of income (red bar), Chart 2 shows that households primarily relying on salaries for income have less than half (44%) the average material deprivation rate in Armenia. This figure is 52% of the average material deprivation rate in Georgia, and 63% of the average material deprivation rate in Azerbaijan. Furthermore, households in the South Caucasus that did not report salaries as an income source are 1.4 times as likely to be materially deprived.
Chart 2
Pensions and government transfers are the second most important source of income in the South Caucasus. Chart 3 shows that households where government transfers are the primary source of income have more than 1.5 times the average rate of material deprivation, while those where pensions and government transfers are the second source of income have three-fourths the average rate of material deprivation. This suggests that government transfers throughout the South Caucasus are not large enough to live without poverty, but can effectively supplement a main income. The trend is most extreme in Armenia where households relying on the government for their primary source of income are over two times as likely to be materially deprived, while households where government funds are a secondary source of income have three-fifths the average rate of material deprivation. In Azerbaijan, government transfers have a much weaker correlation with material deprivation. In fact, data from graphs 2 and 3 shows that households receiving government transfers as their primary source of income are twice as likely to be materially deprived as households dependent on salaries in Azerbaijan, three times as likely in Georgia, and five times as likely in Armenia.
Chart 3
As chart 4 shows, income from sales of agricultural products is correlated with higher material deprivation rates across the South Caucasus, supporting previous findings showing that material deprivation is concentrated in rural areas. Armenia has the lowest percentage of households reporting income from the sale of agricultural goods, and also the smallest changes in material deprivation based on income from agriculture. Georgian households dependent on agriculture for either their primary or secondary source of funding are around 1.4 times more likely to be materially deprived than the country average, while Azerbaijani households are almost 1.8 times as likely. In Armenia and Georgia, relying on pensions and government transfers is the strongest indicator of material deprivation, while in Azerbaijan it is dependence on sales from agricultural products.
Chart 4
Only 13% of respondents in the South Caucasus report receiving money from remittances, but chart 5 shows that households most reliant on remittances are less likely to be materially deprived. The trend is especially strong in Georgia, where households dependent on remittances as the primary source of income have 58% of the country’s average material deprivation rate.
Chart 5

Although overall trends are consistent across all three South Caucasus countries, the importance of each income source on standard of living varies rather widely. Material deprivation in Azerbaijan seems to reflect a large divide between urban and rural areas, with family transfers, salaries, and government transfers much less strongly correlated to changes in material deprivation than in Georgia or Armenia. In Georgia more people mention government transfers than salaries as an income source, and for those reliant on state transfers, the material deprivation rate is over 70%. Although Armenia has by far the lowest material deprivation rate, at under 19%, it has a huge disparity between households with salaries as their primary source of income and households dependent on government transfers.

Thursday, October 09, 2008

South Caucasus Data 2007 on Unemployment

Unemployment clearly is one of the pressing issues in the South Caucasus. But there is a lack of reliable data on people being without and looking for a job. This blog, based on CRRC’s Data Initiative 2007, provides a snapshot on these numbers.

According to CRRC’s dataset, about 25% of the adult population in Armenia and Georgia, and 20% of Azerbaijan’s citizens say they are unemployed. Further analyzing these numbers shows that 18% in Georgia, 14% in Armenia and 12% in Azerbaijan are actually interested in looking for a job.

[Note: excluded are “students", "housewives", "disabled" or "retired" - even if they are looking for a job.]

Yet the data shows sizeable differences across the countries, depending on whether you ask in rural areas, urban environments, or the capital. Let's look at what people say when asked whether they consider themselves to be employed. Note that housewives, pensioners, disabled and students are also considered "not employed".

Do you consider yourself to be employed? This employment may be part-time or full-time, you may be officially employed, informally employed, or self-employed, but it brings you monetary income.


If you analyze the data of by settlement type, it reveals that of those that describe themselves as not employed a relatively low number of people look for work in Baku (22%), compared with Tbilisi (29%) and Yerevan (32%). Besides, about the same share of people (again, of those describing themselves as not employed with monetary income) in the three countries look for a job in rural areas (nearly 30%).

However, the data impressively illustrates that the major interest -- among those that are not employed -- in a workplace can be found in urban areas, where about 40% of Armenians and Georgians, and almost 50% Azerbaijanis try to find work. This figure powerfully underlines the desolation of Caucasian cityscapes.

Of those that are not employed, what percentage is looking for a job?

Finally, the DI statistics show that the same number (once you factor in the margin of error) of people is unemployed and interested in a job, but not currently looking: 6% in Armenia, and 5% in Georgia and Azerbaijan. A slightly lower number of the unemployed is not looking for a job at all. Have those already given up?

Now the definitions of unemployment always are a little complicated (are pensioners looking for work considered unemployed?), but here is an article that can help. If you are interested to check the datasets yourself , please download it from CRRC’s homepage. For more information on the Data Initiative project, please click here.