Thursday, January 22, 2015

A taxi driver’s tale, Part 2: The poverty of social status in Georgia


Looking at the association between an individual’s social status and his/her standing in the labor market, the first part of this blog post concluded that higher labor market mobility is characteristic for people with high social status, and that those with high social status have better chances of finding an attractive job. Yet, the question remains whether people with higher social status actually live better lives i.e., enjoy economic well-being and have better perceptions about their and their children’s future. To answer this question, this blog post examines how social status is associated with individual and household well-being. Data again comes from CRRC’s 2013 Caucasus Barometer (CB) survey.

According to Geostat, the subsistence minimum in Georgia was GEL 137 in 2013 (approximately USD 80). CB 2013 asks a question about personal income last month, but the answer options are given in categories (income ranges). The subsistence minimum of $80 falls into the category between $51 and $100. It is used in the blog post as a reference category to compare, on the one hand, individuals with higher incomes and, on the other hand, individuals with lower incomes. The group of respondents reporting not having personal income are considered a separate group.

As expected, social status is positively associated with personal income. Almost half of the representatives of the high social status group made more than $100 last month, whereas only 30% of the low status group and 36% of the middle status group managed to exceed the same threshold. Interestingly, the no income category prevails in the high and middle social status groups. One in every three people in these groups reports having no personal income compared to one in every four in the low status group.

Unsurprisingly, the higher its social status, the more money a household spends. Geostat reported GEL 900 (approximately USD 500) as average monthly household expenditures in 2013. In CB’s corresponding question, this falls into the category between $401 and $800. Again, this is used as a reference category to differentiate households spending more than the average from households spending less than the average. A higher social status is still positively associated with higher spending. However, the overall economic condition of Georgian households looks quite poor. As the chart below shows, even in the high social status group, the majority of households spent under $401 last month, and only 19% spent more than the reference category. In the low social status group, almost everyone (91%) spent less than the reference category, meaning that the low status group households spend significantly less than Georgian households on average.


The poor economic condition of the majority of the Georgian population is confirmed by CB questions about personal savings and debt. The vast majority of Georgians do not have savings, regardless of their social status. However, the high social status group (17%) is almost twice as likely to have some savings compared with members of the low (8%) and middle (9%) status groups. Likewise, money is more often owed to the representatives of the high status group (25%) compared to the middle and low status group members (18% and 12% respectively). The data does not show significant differences in terms of personal debts. Approximately 40% of each group reports owing money.

So far, it has been demonstrated that high social status is helpful to overcome economic hardship, but does not guarantee it. The reported gap between a household’s income and the amount of money it needs to cover its basic needs reinforces this statement. Half of the high status group representatives affirm that during the past 12 months there were occasions when their household did not have enough money to buy food. In the middle and low status groups, more than 70% reported the same. Moreover, the majority of the middle and low status groups and 40% of the high status group had to borrow money to cover utilities in the past six months.

The chart below shows that even representatives of the high social status group can largely satisfy only basic needs. Half reported that money is enough for food and clothes, but not for expensive durable goods (a new refrigerator or washing machine, for example). In the low status group, 35% stated that money is not enough even for food. Interestingly, a quarter of the middle and one in every ten of the high status group report facing the same problem.


It is not surprising that the poor economic realities of households are reflected in perceived place on an imaginary economic “ladder”. The chart below shows that only 19% in the high social status group perceive their household’s economic rung as high (45% place their households on the middle rungs and about one third towards the lower end). In the middle and low social status groups, the majority believes their households stand on the low rungs (46% and 54% respectively).

Note: Original answers were on a 10-point scale. For this graph, answers were re-coded as follows: rungs 1 through 4 – Low, rungs 5-6 – Middle, rungs 7 through 10 – High. 

At the same time, belonging to a higher social status group helps people to be more optimistic – 71% of the high status group believes that they will be better off in five years. Despite pressing current economic conditions, the other two groups are also quite optimistic – 57% of the middle and 43% of the low status group believe in a better future. Optimism absolutely flourishes, and the relevance of current social status fades when individuals contemplate their children’s future. Over 90% of all social status groups believe in a brighter financial situation for their descendants. Notably, all three status groups agree that the most important factor that will contribute to the well-being of the next generation is education.

This blog post described how social status is associated with economic well-being and perceptions about the future. The most important message to the taxi driver is that a higher social status in contemporary Georgia leads to more mobility on the labor market, as well as relatively higher income and spending. However, social status alone is hardly enough to overcome poverty and substantially improve well-being. Perhaps this explains why a man with more than one university diploma chooses to continue driving a taxi.

Monday, January 19, 2015

A taxi driver’s tale, Part 1: Social status in the Georgian labor market


Taxi drivers tell perhaps the most telling story of Georgia’s economic transition. They often complain that the transition made their high social status useless, thus pushing them into taxi driving. This often heard and mocked complaint highlights the contrast between what is expected from and what is delivered by the labor market. Taxi drivers expect their social status to remain at work in economic life, while the mockers believe that social status has no relevance for Georgia’s current labor market. Based on CRRC’s Caucasus Barometer (CB) survey data, this blog post shows that the taxi drivers are not entirely wrong. According to 2013 Caucasus Barometer survey, higher social status is associated with a higher likelihood of employment, a better job, and greater mobility on the labor market.

The taxi drivers often “operationalize” their social status as having a diploma or two from one or more higher educational institutions. In Georgia, another common cue to signal high social status is family background, normally operationalized in the same way. Not only are these two cues at the core of the taxi driver’s tale, but notably, the same characteristics often prevail when traditionally selecting a favorable bride or groom. Hence, the two cues fit the Weberian understanding of social status as perceived prestige and esteem that is related to economic relations, but cannot be reduced to it.

Following the taxi drivers’ perspective, this post proposes a simple index of social status, which includes two components: (1) respondent’s level of education, and (2) level of education of the respondent’s parents. In both cases, education variables are recoded so as to have three categories: (1) secondary or lower education, (2) secondary technical education, and (3) incomplete or complete tertiary education.

The index is a simple sum of these indicators and hence, it ranges from 0 to 4. At the highest extreme of the index stands a person with tertiary education having at least one parent with tertiary education (score 4). A person without any of these characteristics stands at the lower extreme of the continuum (score 0). Individuals with scores between the extremes are counted as having middle social status. As shown below, more than half the population belongs to the middle status group, whereas 28% and 19% fall into the low and the high social status groups respectively.  


Looking at the distribution of social status groups across settlement type, age and gender, it is notable that 39% of Tbilisi residents are in the high status group compared to only 7% of residents of rural areas. Low (42%) and middle (51%) status groups are predominant in rural areas. Urban settlements outside the capital have the highest percentage of the middle status group (62%). Interestingly, no important differences can be observed by gender. Younger cohorts tend to have higher education as well as more educated parents compared to older cohorts, and are thus more likely to belong to a higher status group.  

But, does social status have implications for an individual’s standing on the labor market? The Caucasus Barometer uses several questions to measure respondents’ employment status. While those who are employed or self-employed are identified using one survey question (“Which of the following best describes your situation?” with answer options including “Working either part-time or full-time” and “Self-employed”), identifying the unemployed is a trickier affair. To do so, it is necessary to separate those who do not work by choice and those with physical constraints to labor force participation from those who do not work resulting from a failure to find a job, i.e. the unemployed. To identify the latter group, a combination of two questions has been used - is the respondent interested in a job and if so, is he or she ready to start working within two weeks if a suitable job were available. Respondents who do not meet these two conditions are not formally unemployed and are not counted as part of the active labor force.  

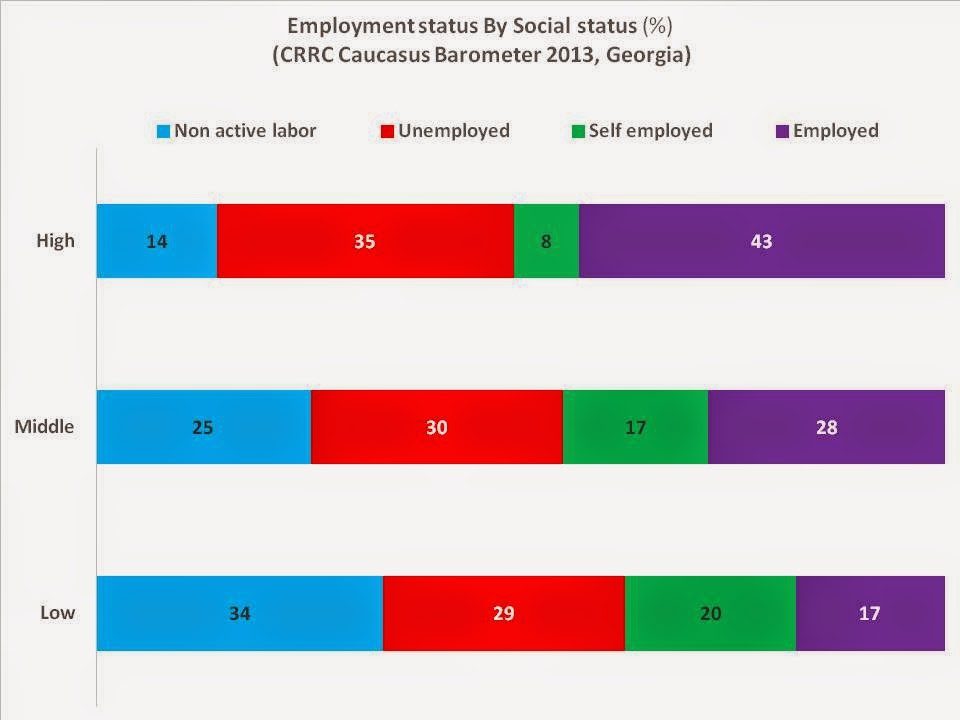
From cross-tabulating an individual’s social status and his/her employment status, it is evident that the plurality of the low status group is out of the labor force (34%) or unemployed (29%). In contrast, the plurality of the high status group is employed (43%). However, it is noteworthy that one in three of the high social status group is unemployed (35%), while almost half of the individuals with low social status, on the other hand, were never employed.


Thus, the higher the individual’s social status, the higher his/her employment chances. Moreover, the status group a person belongs to indicates his/her occupational status. More than half of the high social status group works in high status positions, i.e. managers and professionals. A plurality of the low social status group (41%) works as unskilled laborers (elementary occupations, sales people, and baby sitters). Nonetheless, the majority of the low and middle status group enjoy mid-level occupations, such as technician, clerk, or skilled agriculture worker.

Note: The variable used to measure occupational status is JOBDESC. Respondents were asked, “Which of the following best describes the job you do?” Suggested answer options included: Manager; Professional; Technician / Associate professional; Clerical support worker; Service / Sales worker; Skilled agricultural / Forestry / Fishery worker; Craft and related trades worker; Plant and machine operator / Assembler; Elementary occupation; and Armed forces occupation. For this blog post, the options “Manager” and “Professional” were combined into the category ‘high’. “Armed forces occupations”, “Plant and machine operators”, “Craft and related trade workers”, “Skilled agricultural workers”, “Clerical support workers”, and “Technicians” were combined into the category ‘middle’, and “Elementary occupations” and “Service/sales workers” were grouped into the category ‘low’.  

Social status is also associated with employment sector and type of work for those who work. People who belong to the high status group rarely own businesses (18%) and are generally either state employees (41%) or employees of private companies (40%). At first glance it may seem paradoxical that those in the lower status group are more likely to own a business (55%), however, taking a closer look at Georgian reality makes it clear that these business owners are mostly self-employed agricultural workers or petty traders. Those in the middle status group are more or less equally distributed between the public, private and self-owned business sectors. As noted, people belonging to the low and middle status groups are more likely to work in agriculture (40% and 19% respectively). Individuals in the high status group are employed by educational institutions (24%) more often than in any other sector.

Importantly, the data shows that the Rose Revolution marked an important threshold for the Georgian labor market. The majority of employed individuals of all status groups started working at their primary workplace after 2004. This year perhaps also marked an important shift in the structure of the economy as 46% of the high and 33% of the middle status groups lost their job after 2004.
Not only are high status individuals more mobile, but so too are their household members who were more than twice as likely to find a new job in the last 12 months compared to the household members of individuals belonging to the low status group (16% vs. 7%). However, exactly the same was true about losing a job in the last 12 months – household members of those in the high status group lost jobs twice as often as those in the low status group.

This blog post has shown that the taxi driver’s tale of frustration has an observable underpinning – social status, operationalized as an individual’s and his/her parents’ education, is associated with an individual’s standing on the labor market. People belonging to the high status group are more likely to be employed, generally have better jobs, and exhibit greater mobility on the labor market. Hence, the preliminary conclusion drawn from this blog post is optimistic for the taxi driver, who perceives his current job as inferior to his status. If he belongs to a high social status group, he is more likely to find a better job. The second blog post in this series will describe how social status is related to household income and spending, as well as an individual’s perceived economic rung.

Wednesday, January 14, 2015

How to buy votes when you can’t buy votes


Today, less than democratic regimes face a serious dilemma – how do you buy votes to win an election without becoming an international pariah. Unfortunately for a society and fortunately for an autocrat, the wheels of power and administrative resources an incumbent regime wields provide ample opportunity to manipulate electoral outcomes through what are otherwise legitimate activities related to state spending and coercion. In this blog post the term autocrat is used descriptively rather than in an evaluative or normative sense i.e. in a manner synonymous to a ruler of a less than democratic regime.

Notably, almost all governments in the world hold some form of election. Even fully authoritarian regimes such as North Korea  and Uzbekistan regularly hold elections after all. In hybrid regimes, which are neither fully authoritarian nor fully democratic (Armenia and Georgia among them), elections are often contested by multiple parties who see them as the legitimate means of gaining power. Political scientists have taken note and have come to call hybrid regimes which hold elections either electoral authoritarian or competitive authoritarian.

Elections in such regimes serve a number of purposes including legitimacy building on the international stage and enhancing stability at home. As Andreas Schedler has noted:

Electoral authoritarian regimes neither practice democracy nor resort regularly to naked repression. By organizing periodic elections they try to obtain at least a semblance of democratic legitimacy, hoping to satisfy external as well as internal actors. At the same time, by placing those elections under tight authoritarian controls they try to cement their continued hold on power. Their dream is to reap the fruits of electoral legitimacy without running the risks of democratic uncertainty. Balancing between electoral control and electoral credibility, they situate themselves in a nebulous zone of structural ambivalence.

This “nebulous zone of structural ambivalence” leads to elections which are neither clearly stolen, nor clearly free and democratic. Direct electoral fraud may damage a state and its leading bureaucrats’ reputations abroad, potentially lead to sanctions, civil unrest or even a revolution as occurred in Georgia in 2003. The presence of influential international organizations’ election monitoring missions increases the likelihood that the direct purchase of votes from the electorate, ballot box stuffing or other obvious violations of democratic norms will be publicized and punished in some form. Yet, the “democratic uncertainty” that accompanies fully free elections presents the possibility that an autocrat could lose their power. So, if an autocratic regime desires the benefits accompanying formal adherence to democratic rules, but simultaneously does not want to lose power or create instability domestically, it must find a means to illicitly secure votes without directly buying them.

Increasing social spending or creating employment, social benefit and similar programs is one way an autocrat can attempt to buy votes without directly buying them. Manipulating public spending in order to improve electoral outcomes was first termed a “political business cycle” by Nordhaus in 1975. His work hypothesized that politicians would favor pre-electoral policies that, in the short term, yield lower rates of unemployment and higher rates of inflation instead of policies that would encourage an optimal balance of both in the long term. In doing so, a government uses fiscal policy to improve the economic situation in the short term and, as a result, popular perception of a party’s performance immediately before elections to improve their chances at the polls.

While spending is one avenue for an autocrat to seek, coercion is a second option when spending alone may produce uncertain results. Notably, Bhasin and Gandhi, looking at presidential elections in every authoritarian country from 1990 to 2008, have argued that before elections “regimes will moderate their use of violence against ordinary citizens, while simultaneously directing state-sponsored repression towards opposition elites. Ordinary citizens are likely to experience greater repression after the election.” While direct, physical violence is one form of coercion autocrats sometimes rely on, a regime can also use fines and fees in order to punish the society it governs.

Autocrats thus may  have carrots (spending) and sticks (coercion) which they can use to manipulate electoral outcomes in their favor. Using the 2006-2013 state monthly income and spending data from the Georgian Ministry of Finance, this blog looks at social spending and other income, which consists of non-tax revenues from the sale of services and goods, and from fines and penalties. While the exact denomination and number of fines and penalties would be a better indicator, which would allow us to fully test whether Bhasin and Gandhi’s theory is accurate in the Georgian case, other income is used here as a proxy since the Georgian government has not published a full account of the fines it has administered.

In Georgia, a country which has consistently been ranked as having a less than democratic but not fully authoritarian regime by major democracy scoring indexes such as Freedom House and Polity IV, a clear political business cycle can be observed when looking at social spending between 2006 and 2013, the years for which monthly data on social spending and other income is available from the Ministry of Finance. The chart below shows, on the one hand, the monthly average of social spending for each election year, excluding the month before elections, and, on the other hand, social spending the month before elections. In every case, the latter has been higher than the former.

The clearest example of electorally motivated social spending in Georgia was in December 2007, in the lead up to the 2008 snap presidential elections that were held on 5 January, 2008. The dramatic increase in social spending makes particular sense when considering the options available to an autocrat to attract votes – spending and coercion. On November 7, 2007 the government violently cracked down on opposition protests in Tbilisi. These actions triggered widespread anger, and had the government continued to use coercion, it would likely have further decreased popular support for it. The incumbent regime realized it was left with spending alone – the “carrot” – to attract voters, and the precipitous rise in spending indicates this. While social spending remained stable from January to September 2007, varying from GEL 51.8 million to 54.8 million, it increased to Gel 66.4 million in October, to GEL 134.3 million in November, and to GEL 206.6 million in December.

In addition to attempting to ‘buy’ voter loyalty, an autocrat can also attempt to coerce it, be it physically or financially. Looking at the Georgian state budget’s other income line from 2006 to 2013, a fiscal coercion cycle appears in addition to the social spending cycle described above. In the chart below, pre-electoral highs in other income are shown together with the average monthly other income collected each election year, excluding the pre-electoral high for the given year. The pre-electoral high occurred two months before elections every election year except 2010, when it occurred one month before elections.

Note: The other income average (blue bars) includes the month before elections, except for in 2010, since, as noted above, in all other election years the pre-electoral high occurred two months before elections. 
Correction: This graph originally presented the pre-electoral high in other income as 140 million in 2006; this is the figure for other income for March, rather than August of 2006. The graph has been updated to reflect the correct average in other income and the correct pre-electoral high in other income. The pre-electoral income in 2008 was originally reported as nearly equal to the average other income. In fact it was significantly lower than the average, two months before the elections.

On all occasions except the 2008 January elections, the state collected a significant amount more in other income during pre-electoral highs. In 2006, the state collected 137% of the average monthly other income before elections, 186% before the May 2008 elections, 338% before the 2010 elections, 453% before the 2012 elections, and 171% before the 2013 elections.

While without detailed data on the denomination and number of fines and penalties it is impossible to prove that the Georgian government – UNM and GD alike – has been trying to punish the electorate after elections and elites before elections, as hypothesized by Bhasin and Gandhi, the regular dramatic increases in other income before elections suggests that the government is punishing elites before elections. This is well exemplified by the 2012 pre-electoral period, when the government fined Bidzina Ivanishvili and his Georgian Dream coalition a number of times in the lead up to elections.

Once again, the 2008 January elections appear to be an outlier. Other income dropped from GEL 41.2 million in October to GEL 10.5 million in November of 2007, the month that the snap presidential elections were announced. It seems reasonable to suppose that the government believed and feared that an attempt at further coercion, after putting down popular protests, would have been more costly than beneficial for their electoral outcomes – the government had exceeded their ’coercion budget’ so to speak. This likely explains the astronomical rise in social spending discussed above.

Autocrats can and do use carrots and sticks to manipulate electoral results in Georgia. This blog post looked at social spending as a “policy carrot” and other income as a “policy stick”. In the month before elections, social spending has consistently increased in Georgia, while two months before elections other income too has increased, with the only exception occurring in the aftermath of the events of November 2007. This suggests clear pre-electoral spending and coercive cycles in Georgia, implying that the government consistently attempted to manipulate electoral outcomes.

Monday, January 05, 2015

Voter Participation and Civic Engagement in Georgia and Armenia


How individuals engage with those around them is a crucial part of civic life, and people in all societies practice certain forms of civic engagement. There are various approaches to measure civic engagement. The OECD refers to voter turnout as the “best existing means of measuring civic and political engagement,” because it considers those who vote more likely to participate in the political process in other ways. Thus, voter turnout can serve as a “proxy for civic and political engagement.” This blog post draws upon official electoral statistics and public opinion survey data from the CRRC Caucasus Barometer (CB) survey to analyze expressions of civic engagement in Armenia and Georgia. Specifically, it looks at reported involvement in volunteer activities, attendance at public meetings and religious services, and positive attitudes toward public criticism and protest of government actions in order to look at how closely voter participation corresponds to other measures of civic engagement in these countries. 

Considering that Georgia is a parliamentary republic, and Armenia is a semi-presidential republic, elections for these institutions would expect to attract the highest turnouts. According to the Georgian Central Election Commission, the 2012 Parliamentary elections brought 61.31% of registered voters to the polls, while according to the Central Electoral Commission of Armenia, the 2013 Presidential election saw a 60.05% turnout.  Hence, Georgia and Armenia had nearly identical voter turnout, although irregularities and a lack of transparency in vote counts were reported in Armenia’s 2013 elections, possibly increasing turnout figures. 

How does electoral turnout match up with other forms of civic engagement? In 2013, Armenians (31%) were more likely than Georgians (19%) to report performing “volunteer work without compensation” during the past six months. Notably, participation in volunteer activities represents a form of civic engagement beneficial for the construction of bridging social capital, which helps foster social trust and cooperation. Only 17% of Georgians and 9% of Armenians reported attendance at a public meeting during the past six months. As for frequency of attendance of religious services, Georgians were also slightly more likely to indicate regular attendance: 43% reported attending religious services at least once per month, compared to 32% of Armenians. 


Citizens also engage with society by expressing criticism or protesting the actions of government. In the words of Harrop A. Freeman, protest actions have historically been a “means of effectuating change within the law when law’s normal procedures were inadequate,” and thus represent an active form of engagement. In measuring public attitudes toward – but not necessarily actual participation in —protesting and criticism of government, CB asks respondents, “Which of the following statements do you agree with: ‘People should participate in protest actions against the government, as this shows the government that the people are in charge,’ or ‘People should not participate in protest actions against the government, as it threatens stability in our country?” 71% of Armenians and 52% of Georgians agreed with the first statement. When asked, “How important or unimportant it is for a good citizen to be critical towards the government?” 58% of Georgians and 41% of Armenians reported the belief that it is important for a good citizen.

Georgians and Armenians participate in elections at almost the same rate, but Georgians are more likely to think that a good citizen should be critical towards the government. They are also more likely to have attended a public meeting over the past six months and to have attended religious services at least once per month, important indicators of bridging social capital. Armenians are more likely to express the belief that people should participate in protest actions as well as more likely to have done volunteer work during the past six months. Thus a strong conclusion cannot be drawn from the data at hand as to whether Armenians or Georgians demonstrate more civic engagement overall. 

For more information on civic engagement in Georgia and Armenia please consult the CRRC’s Online Data Analysis tool. For additional analysis of civic engagement, refer to the OECD’s Better Life Index.

Monday, December 29, 2014

Georgia in a turbulent world: 2014 in review


Calling 2014 turbulent for the world seems almost euphemistic. The world witnessed renewed Russian revanchism with the war in Ukraine and annexation of Crimea, the emergence of a highly successful militant Islamic organization, Islamic State in Syria and Iraq, and the persistently tense situation in Israel erupted into another war between Israelis and Palestinians. Not only did the world see conflict, but it also witnessed the outbreak of the Ebola epidemic in West Africa and electoral gains for the far right and left in Europe. Notably, Turkey continued on its path which has swung against secularism and democracy in recent years.

In contrast, Georgia, a country known for its prolonged territorial conflicts and volatile politics, was relatively calm in 2014. This, though, is not to say that the events which shook the world in 2014 did not reverberate through Georgia. Quite to the contrary, the Ukraine crisis resonated in Georgia and the conflict in Syria holds consequences for the country. Georgia’s domestic politics, while tame in comparison to the recent past, also had unexpected and difficult moments.

The crisis in Ukraine reminded the Georgian public of the threat posed by Russia, and for many it was also a reminder of what could have happened in 2008. As a CRRC blog post pointed out in September, Georgians’ perception of Russia as a threat increased during the crisis. Moreover, the crisis in Ukraine hastened the signing of Georgia’s long sought after Association Agreement with the European Union. While the Agreement was originally scheduled to be signed no later than August 2014, after the Ukraine Crisis, the European Union moved up its signing to no later than June 2014, ultimately culminating in the signing on June 27th.

One of the most unexpected outcomes of the Ukraine crisis is the proposed appointments of a number of former Georgian United National Movement officials to the Ukrainian Cabinet of Ministers. Former Minister of Health and Social Affairs of Georgia, Aleksandre Kvitashvili, and former deputy Minister of Internal Affairs, Eka Zguladze, have taken up the same posts in the Ukrainian government. Notably, ex-president Mikheil Saakashvili turned down the Vice Premiership of Ukraine to keep his Georgian citizenship. While the proposed appointments have not been received with absolute unanimity from the governing Georgian Dream Coalition, Foreign Minister Tamar Beruchashvili has noted the importance of maintaining good relations with Ukraine.

The Ukraine crisis was not the only global event to reverberate in Georgia in 2014. The war in Syria and Iraq, which has resulted in massive loss of human life and mass displacement, also touched Georgia. After the start of the conflict, Georgia’s previously ultra-liberal visa regime made it relatively easy for Syrians to settle in the country. Notably, some ethnic Abkhaz Syrians fled to Abkhazia from the conflict. This year though, a number of young people from the Pankisi Gorge in northeastern Georgia have joined the war in Syria and Iraq, becoming not only members, but also high level commanders of the militant Islamic organization, Islamic State.

On a different note, Georgia’s Euro-Atlantic integration took another step forward this year with agreement on a “Substantive Package” with NATO. This package was given to Georgia to increase interoperability with NATO countries, while also serving as a substitution for a Membership Action Plan which in the context of the Ukraine crisis and the unsettled conflicts in Abkhazia and South Ossetia, may have provoked Russia’s ire.

In what some commentators have viewed as a response to NATO’s substantive package, Abkhazia and Russia signed a treaty, including a mutual defense clause similar to Article 5 of NATO’s Washington Treaty. Both Abkhazians and Georgians have heavily criticized the treaty. The Georgian government has described this treaty as a further step in Russia’s occupation of Abkhazia, and Abkhazians have criticized the treaty for giving up too much autonomy. While the first draft of the treaty was titled “Agreement on Alliance and Integration” it was later changed to “Agreement on Alliance and Strategic Partnership” (emphasis added) as a result of Abkhaz protests. Significantly, the Kremlin-favored candidate Raul Khajimba was elected to the de-facto presidency of Abkhazia, following a June revolution in the breakaway republic.

Speaking of entirely domestic events, in 2014, intolerance again manifested itself in Georgia with a number of islamophobic and homophobic events. The most extreme example of islamophobia this year was when residents of Kobuleti decapitated a pig and nailed its head to the front door of a Muslim boarding school in protest of the schools opening. On May 17th, the physical violence of 2013 protests against the International Day Against Homophobia and Transphobia was avoided since the anti-homophobia rally was cancelled due to the fear of repeated violence. Instead, the Georgian Orthodox Church along with its supporters celebrated a “day of family values” on May 17th, a clear act of symbolic violence.

The political scene was also somewhat turbulent. The Georgian Dream Coalition experienced its first serious crack with the dismissal of Irakli Alasania from the Defense Minister post in November and the subsequent withdrawal of the Free Democrats from the coalition. Notably, the public’s appraisal of the Georgian Dream Coalition’s performance has decreased in 2014. While in November 2013 50% of the population rated their performance as good or very good, only 23% of the population reported the same in August 2014. The municipal elections in 2014, which demonstrated a high level of competition compared to many elections in the past, also held a number of surprises. Importantly, the newly emerged Patriotic Alliance garnered nearly 5% of the vote nationally and forced a second round in gamgebeli elections in Lanchkhuti.

Elections and coalition politics aside, an event in Georgia which remains unsettled to this day is the charging of Mikheil Saakashvili with a number of crimes he allegedly committed while in office. Saakashvili has denied any wrong doing and accused the current government of a political witch hunt. The government has claimed that they are attempting to demonstrate that everyone is equal before the law and that justice, which was precarious during UNM rule, has returned to Georgia.

While the world shook in 2014, Georgia mainly felt the weaker aftershocks of world events in 2014, and although Georgia experienced crises in miniature, it has navigated domestic issues with a relative grace. Still, the crises in Ukraine and Syria left their mark on Georgia, and will continue to impact Georgia in 2015.


Monday, December 22, 2014

Does public opinion accurately gauge government performance in the South Caucasus?

Robert Putnam’s 1993 work Making Democracy Work: Civic Traditions in Modern Italy marked a seminal moment in the development of institutionalism. Putnam’s exhaustive study of the relationship between the governed and governing in the Italian regions contained the discovery that public opinion provides an accurate picture of actual government performance: “The Italians’ gradually increasing satisfaction with the regional governments … corresponded to real differences in performance,” and in each region Putnam’s measurement of performance was “remarkably consistent with the appraisals offered by the regional attentive public and by the electorate as a whole.” While Italy was the focus of his study, Putnam’s findings can be applied broadly as he draws identical conclusions across regions with disparate social, economic, and historical conditions. Can his insight on the relationship between public opinion and government performance be transposed onto any or all of the countries of the South Caucasus?

The three states comprising the South Caucasus – Armenia, Azerbaijan and Georgia – are characterized by varying degrees of governmental effectiveness. Public opinion data from the CRRC Caucasus Barometer survey (CB) also shows differing levels of trust toward government in each country. This blog post asks the following question: does public trust in government institutions in the South Caucasus countries reflect the actual performance of government? Drawing on CB data as well as the Government Effectiveness dimension of the World Bank’s Worldwide Governance Indicators project (WGI), this blog post finds an apparent mismatch between levels of public trust in state institutions and measures of actual performance.

The populaces of the three South Caucasus states demonstrate divergent attitudes toward the institutions that make up government. Azerbaijanis report more positive views of government, reporting relatively high levels of trust in the Parliament, President, and Prime Minster and ministers. Georgians are less trusting of the Parliament, Prime Minster and ministers, but demonstrate more trust in the courts, the ombudsman and political parties. While it is not possible to say with certainty whether the average Georgian or Azerbaijani has more trust in government institutions overall, it does seem apparent that Armenians demonstrate the least trust. In 2013 residents of Armenia indicated the highest levels of distrust on almost every relevant CB question. The only incidence in which Armenians demonstrated levels of trust slightly higher than a neighboring country was when asked how much they trust or distrust their country’s local government. 35% of Armenians indicated trust, compared to 28% of Georgians.

Note: This graph only displays the percentage of people who reported distrust in the respective institution. The original question asked, “Please tell me how much do you trust or distrust … [institution]?” Values were re-coded from a 10-point scale used in the questionnaire to the three-point scale used in this text, with original values 1-4 corresponding with the response “distrust” (shown here), 5-6 being “neutral,” and 7-10 corresponding with “trust.” While the graph displays data from 2013 only, this blog post drew on data from 2008 onward. 

In attempting to answer the central research question, this blog post investigates whether the greater propensity to trust state institutions appears alongside higher WGI scores for government effectiveness in each country. While a comprehensive model of governmental effectiveness is the task of a deeper, more comprehensive analysis, this blog post relies on the Government Effectiveness aggregate of the WGI. This metric is intended to measure “the quality of public services, the quality of the civil service and the degree of its independence from political pressures, the quality of policy formulation and implementation, and the credibility of the government’s commitment to such policies.” The indicator is aggregated from 15 individual indicators of governmental effectiveness including the World Bank Country Policy and Institutional Assessment, Economist Intelligence Unit, Bertelsmann Transformation Index and Gallup World Poll.

Provided that the findings of the index paint an accurate picture of the subject at hand, it brings up mixed results with regards to Putnam’s aforementioned conclusion. In each year 2006-2013 Georgia’s score bested those of the other two countries in question, thus the relatively high levels of trust observed in Georgia appear alongside regionally impressive scores for governmental effectiveness. As for Azerbaijan, it scored the lowest of the three South Caucasus states in every year in which scores were awarded. In 2008, the year corresponding to Azerbaijan’s lowest score on the WGI, 87% of Azerbaijanis reported trust in the President and 52% in the Parliament, both measures being higher than those found in Georgia and Armenia (the first being much higher), even though Azerbaijan received a WGI score of less than half of either of its neighbors. Thus it does not appear that public opinion accurately reflects reality in the case of Azerbaijan.


Note: These scores represent percentile rankings. Not all of the 15 indicators used in the Government Effectiveness metric are available from each country in every year. For example, in 2013 a total of 11 indicators were used to compile Armenia’s score, compared to 10 for Georgia and 9 for Azerbaijan.

When observing the case of Armenia, viewing CB findings in relation to the WGI index indicates possible dissonance between public opinion and governmental effectiveness. While Armenia scored slightly lower than Georgia on the WGI each year from 2006 and 2013, CB results show that Armenians’ reported trust in government institutions has been much lower than that in Georgia. This could indicate that Armenians are overly pessimistic about the performance of their government, that Georgians are overly optimistic, or a combination of both. In each case, a possible explanation is that Georgia’s scores on the WGI have almost invariably trended upward, starting at a trough of 39.5 in 2005 before peaking at 69.9 in 2012. Armenia, on the other hand, has seen only modest and uneven gains, with public trust in Parliament, the President and the executive government each declining over the same period. Georgian optimism may stem from the appearance of progress, while Armenian pessimism could be the product of a general malaise in the performance of government.

On the whole, it appears that Putnam’s observation cannot be applied neatly to the three states of the South Caucasus. The Azerbaijani public demonstrated the highest levels of trust in almost every governmental institution listed on the CB, even as the country received the lowest scores on the WGI. Georgia scored the highest of the South Caucasus states on the WGI, while public trust in government appeared to be generally lower than in Azerbaijan. Trust in Georgia was significantly higher than in Armenia despite scores on the WGI being only slightly higher. Thus, viewing Georgia and Armenia in relation to one another also appears to uncover a mismatch between perception and reality.

To gain more information on public opinion in Armenia, Azerbaijan and Georgia, please visit the CRRC regional website or refer to the CRRC’s online data analysis tool.

Monday, December 15, 2014

How does job satisfaction vary by job profile?


A number of fields, including economics, sociology and psychology, study issues related to job satisfaction. Using CRRC Caucasus Barometer (CB) 2013 data, this blog post looks at how job satisfaction differs by job profile.

For the first time in 2013, CB used the International Labour Organization’s International Standard Classification of Occupations (ISCO-08) to measure the status of respondents’ jobs (referred to as “job profile” for the rest of this blog post). The level of job satisfaction was measured using the following questions:

  • “To what extent do you agree or disagree with the statement: ‘I am doing something that many people need?”
  • “Overall, how satisfied or dissatisfied are you with your job?”
  • “To what extent do you agree or disagree with the statement: ‘I feel valued at work?”

According to CB 2013 data, Georgians with different job profiles report different levels of perceived importance for their job. Georgians holding a high profile job are nearly twice as likely (75%) as Georgians holding low profile jobs (40%) to think that they are doing something that many people need.


Note: Suggested answer options for the job profile question included Manager; Professional; Technician / Associate professional; Clerical support worker; Service / Sales worker; Skilled agricultural / Forestry / Fishery worker; Craft and related trades worker; Plant and machine operator / Assembler; Elementary occupation; and Armed forces occupation. Each of these categories suggests a different level of qualification, payment and prestige. For this blog post, the options “Manager” and “Professional” were combined into the category ”high profile occupations,” while the other categories were grouped into the category low profile occupations.” Options “Don’t know” and “Refuse to answer,” relevant for less than 3% of the employed, were excluded from the analysis. It should be mentioned that the findings presented in this blog post only apply to Georgians who reported having a job at the time of the interview (39% of the sample), and that the ratio between high and low profile occupations is not equal (23% and 77%, respectively).

Similarly, the assessments of job satisfaction also differ by job profile. The share of employed Georgians who report being satisfied with their job is greater among high profile job holders.


Following the same logic, the number of respondents who completely agree with the statement “I feel valued at work” is nearly twice as high among high profile job holders (47%) than among low profile job holders (25%).


Job satisfaction varies by job profile among employed Georgians. The charts above indicate these differences: the employed who believe they do an important thing for others and feel valued at work tend to have high profile jobs (managers, professionals). For more data on job profiles in Georgia and the South Caucasus check out the CRRC’s Online Data Analysis tool, here.

Monday, December 08, 2014

State capacity in the South Caucasus: How do you measure how much the state can do?


State capacity is a concept which has gained wide interest from political scientists in recent years as an important concept for economic development and regime classification, yet it still lacks agreed upon definitions and indicators. Its definitions vary, with different scholars highlighting different aspects of the concept based on their angle on the subject, but some definitions of state capacity are broader than others. A good example of a broad definition of state capacity is “the state’s ability to implement public policy” (Rogers and Weller, 2014).

The lack of agreement on indicators and definitions is due to the inherent multidimensionality of the concept. This multidimensionality is well exemplified by Fjelde and De Soya’s 2009 article which identifies state capacity as a state’s ability to coerce, co-opt, and cooperate with society. While the authors provide indicators for these capacities, their schema seems more to describe a state’s relationship and interactions with citizens rather than state capacity in and of itself.

The fact that different scholars have theorized different capacities including fiscal capacity, bureaucratic-administrative capacity, and coercive capacity as component parts of state capacity further illuminates the multidimensionality of the concept. This blog post looks at three of the many possible indicators which could be used to gauge state capacity in the South Caucasus: revenue excluding grants as a share of GDP for fiscal capacity, taxes on income, profit, and capital gains as a share of total revenues for bureaucratic-administrative capacity, and military expenditures as a share of central government expenditures for coercive capacity. So, how strong are the South Caucasus states?

Fiscal capacity is considered one of the most important state capacities by most authors as without the financial means to accomplish a stated policy, that policy will likely never be realized in practice. The graph below presents World Bank data for state revenue excluding grants as a share of GDP and shows how much the South Caucasian governments collect from their societies. What appears most prominently is that Azerbaijan’s fiscal capacity far outstrips that of Georgia and Armenia, which exhibit similar levels of extraction. It is important to keep in mind here that revenue consists not only of taxes but also funds collected through fines, fees, and resource rents. The latter are particularly important for Azerbaijan as the government received 54% and 65% of state revenues from oil and gas in 2005 and 2011 respectively. Without its oil wealth, Azerbaijan would collect significantly less in revenues.


Definitions of bureaucratic-administrative capacity often center on a state’s ability to collect and manage information (Hendrix, 2010). This capacity is central to a state’s ability to act and likely enables a state to have fiscal and coercive capacity. For example, if a state is unable to gather information on potential militants within its territory it will be unlikely that it can coerce or co-opt them into compliance. In order to successfully cooperate with society, information gathered must be channeled into usable and comprehendible forms which enable the government to act.

Income, profit, and capital gains taxes as a share of total taxes are a useful indicator of bureaucratic-administrative capacity. While at first glance it may be taken to indicate fiscal capacity, income taxes are more closely related to bureaucratic-administrative capacity, because this form of taxation is both a relatively difficult and relatively desirable tax to collect (Rogers and Weller, 2014). The desirability of income tax stems from the fact that it generally provides a revenue stream which does not drastically fluctuate. In most circumstances, however, it is a relatively difficult tax to collect (though the system of income tax payment by employers has lowered this difficulty in Georgia, Transparency International Georgia has noted that non-compliance with income tax remains problematic). As such, the share of income tax as a percentage of total state revenues proxies how well a state can extract from and manage information on its population. The graph below presents taxes on income, profits and capital gains (two other taxes which are similar to income tax) as a percentage of total taxes collected. The graph demonstrates that Georgia’s bureaucratic-administrative capacity on this measure is higher than that of Armenia or Azerbaijan. While Azerbaijan’s relative weakness in this sector is likely caused by hydrocarbon revenues, Georgia’s relative strength likely comes from the reforms in tax collection and enforcement, which started with the tax code passed in 2005.


A final important capacity of state is its ability to coerce its population; without the capability to put down paramilitaries or suppress violent groups, a state can quickly devolve into chaos. Taking military expenditures as a share of central government expenditures as an indicator of coercive capacity, the graph below gives a possible indication of coercive capacity. This indicator, though, also likely describes the changing relative importance of coercion to each state over time, as one would expect the share of total expenditures dedicated to military expenditures to increase if security issues became relatively more important – hence Georgia’s relatively high expenditures in 2008, which are largely a result of the 2008 August War with Russia. When looking at the figures, it is important to note that Azerbaijan’s budget is significantly larger than either Georgia’s or Armenia’s and as such has a much larger absolute level of coercive capacity.


This blog post has looked at three of the many possible indicators of state capacity. For readers interested in the subject, this 2010 article by Cullen Hendrix goes through a wide variety of indicators, although the data set used does not include any of the South Caucasus countries.

Have any ideas about other indicators? Join the conversation on Facebook or at CRRC-Georgia’s office on December 10th for the Works-in-Progress talk: State/party capacity and constraints on state action: Operationalizing and indexing state capacity in Georgia and Armenia.


Thursday, December 04, 2014

SME Performance in Georgia and Armenia: Part 2

As discussed in the first blog post of this series, the results of the CRRC Caucasus Barometer (CB) survey show that Georgians demonstrate higher levels of interpersonal and institutional trust than Armenians.  These types of trust are important indicators of social capital, which is often taken as a necessary condition for the presence of a robust, productive entrepreneurial class and small and medium enterprise (SME) sector. While Georgians express higher levels of trust in their fellow citizens as well as in formal institutions such as the judiciary and Parliament, economic data shows that the country’s SME sector suffers from a dearth of productivity. This blog post looks at survey data shedding light on economic conditions in Georgia and Armenia as well as policy research on the state of SMEs in each country, finding impediments to rural development and the high cost of financing to be potential causes for the relative lack of productivity by Georgian SMEs.

Productivity of the SME sector (defined as value added per employee) is significantly lower in Georgia when compared to Armenia. Emblematic of the lack of productivity in Georgian SMEs is the preponderance of small-scale agriculture. Many legally designated “small enterprises” are in fact subsistence agriculture proprietorships with little or zero cash turnover, a situation which Rudaz 2012 refers to as “entrepreneurship by default.” A report from the International Fund for Agricultural Development found that as late as 2005, 83% of rural households were dependent entirely on subsistence agriculture and that a “typical” rural household consumed 73% of what it produced. By 2013, however, the CB found that 59% of rural Georgians reported receiving household income from the sale of agricultural products, indicating an existence at least slightly above subsistence level agricultural production.  On the other hand, 27% of Georgia’s rural inhabitants reported no household income from salaries or sales of agricultural products. Rural Armenians are somewhat less likely to sell agricultural products (50% reported household income from this source), but more likely to receive salaries. However, 25% percent of rural Armenians responded “no” to their households having received income from either source. Thus one cannot decisively discern from the data at hand whether rural Armenians are more likely to receive cash income than rural Georgians.

The first blog post of this series determined that available measures of social capital appear to be insufficient to explain differences in SME productivity between the two countries. So, what are possible causes for the lack of productivity gains in Georgia’s SME sector? With regards to agricultural SMEs, a potential culprit mentioned in the previous installment of this series is the fragmentation of agricultural land, with the average private holding in the country being only 1.25 hectares. The consolidation of small plots into larger and more efficient commercial farms has been impeded by an inefficient system of land registration and poorly defined property rights. Restrictions on the purchase of agricultural land by foreigners and foreign-owned businesses have also precluded potentially productive investment in the sector. While the Constitutional Court struck down a law banning land purchases by foreigners in June, 2014, a new draft of the law will allow private foreign persons and foreign companies established in Georgia to purchase plots of up to 100 hectares. Fragmentation is a problem in Georgia, but it also bears mentioning that the average private plot in Armenia consists of 1.3 hectares, scantly larger than in Georgia. Land fragmentation appears to be an obstacle to the growth of Georgia’s SME sector, but it doesn’t appear to be a decisive one. 

As for palpable factors which may explain the lack of growth by both Georgia’s agricultural and non-agricultural SMEs, the difficulty of obtaining financing should not be overlooked. The average interest rate spread in Georgia (the difference between the interest paid on deposits and the interest charged on loans) is 11.3%, the highest spread of the former Soviet republics and significantly higher than the average spread of 7.3% in Armenia. This means that the cost of borrowing outstrips the incentive to save, with the result being that an entrepreneur in need of financing to buy land and equipment or hire employees is faced with very high borrowing costs. In Armenia, this problem occurs but on a smaller scale.

The high cost of financing stems in part from the lack of collateral held by SMEs, which discourages lending. Rudaz also reports the existence of a “law giving tax authorities the right to use the collateral of tax payers who owe money to fiscal authorities,” which allowed the tax authorities to seize the collateral of those owing back taxes. To be more specific, in cases in which a person has outstanding debts to both the tax authorities and a financial institution, the claims of the tax authorities take precedence. This interpretation was corroborated by Eka Gigauri of Transparency International Georgia. As a result, domestic financial institutions face higher financing costs when borrowing from abroad, and banks have become reluctant to accept collateral. There is also a general sentiment of political risk associated with Georgia; the country has a moderate-to-low credit rating of BB-, which hampers the ability of banks to procure external funding. These developments translate into higher borrowing costs for households and businesses.

To summarize, academic studies produced by Knack and Keefer (1997) and Bjornskov and Meon (2010) emphasize the importance of social capital on the success of entrepreneurship, and CB survey data show that Georgians exhibit significantly higher levels of social and institutional trust (which are among important indicators of social capital) than Armenians. Social trust is often taken as a necessary condition for economic growth. However, it is not a sufficient condition, as indicated by measurements of productivity (SME turnover per employee) being much higher in Armenia than in Georgia. This indicates that more palpable factors are inhibiting the growth of Georgia’s SMEs, with agricultural land fragmentation and the difficulty in obtaining financing being possible explanations. However, it must be conceded that none of the factors presented in this study, when viewed in a vacuum, appear sufficient for explaining the divergent performances of SME sectors in Georgia and Armenia. A more comprehensive study is necessary to reach solid conclusions.

For more information about public opinion in the South Caucasus, including data pertaining to social capital and the economic situation, refer to the CRRC online data analysis tool. If you have some criticisms, evidence or insights to add to the discussion, please feel free to contribute comments.