Showing posts with label Public Health. Show all posts

Tuesday, August 10, 2021

Data suggests Georgia has handled the pandemic poorly

Note: This post first appeared on the Caucasus Data Blog, a joint production of CRRC Georgia and OC Media. It was written by Givi Silagadze, a researcher at CRRC Georgia. The views expressed in this article are those of the author’s alone and do not in any way reflect the views of the CRRC Georgia, or any related entity.

Despite initial praise as a model case of handling the pandemic, Georgia is now seeing record numbers of COVID-19 cases and related deaths. Both health and economic data now suggests that the country has not fared well compared to its neighbours.

In early August 2021, Georgia was among the worst countries in the world in terms of COVID-19 case counts and deaths. Indeed, over the last week, over 1% of the adult population had COVID-19 at the same time.

At the start of the pandemic, headlines in international media praised Georgia as a, ‘Coronavirus success story’, and officials declared that they had ‘managed to stand ready to cope with the virus’. However, circumstances took a turn for the worse in the late autumn and the situation has not been assuring since. 

Despite the quickly deteriorating situation, government officials have been resistant to introducing measures aimed at preventing the spread of the virus. In July, public health officials said that their decisions and methods of tackling the pandemic had been successful. Moreover, polling from June 2021 suggests that 60% of the population is very satisfied (13%) or somewhat satisfied (47%) with the government’s response to COVID-19. 

But official health and economic data suggest Georgia has fared poorly compared to its neighbours, with the potential exception of performance on testing.

Health data

In the spring and summer of 2020, Georgia registered the lowest number of new, daily cases in its neighbourhood. However, by late autumn 2020, Georgia led the neighbourhood (and at times, the world) in new cases per capita. Throughout the summer of 2021, Georgia has performed worse than neighbouring countries.  


COVID-related deaths probably are the single most important indicator of how the country has handled the crisis. Georgia’s cumulative COVID-19 deaths per capita are the second-worst in the region, following Armenia.

Since late autumn 2020, Georgia has consistently fared the worst among its neighbours in COVID-19 deaths per capita. The exceptions in this regard are in the late spring of 2021 and a couple of weeks in July.

Georgia also lags behind its neighbours when it comes to vaccination, with only Armenia further behind. 

As of 10 August, at least 1 in 4 people were vaccinated with at least one dose in Azerbaijan and Russia, and 1 in 2 people in Turkey. Slightly more than 1 in 10 people received at least one dose in Georgia and fewer than 5% in Armenia.

While Georgia tends to lag behind its neighbours on many pandemic related indicators, Georgia is outperforming them on testing and tracking the virus in general. As of 9 August, 1,955 tests per thousand people have been conducted in Georgia since the beginning of the pandemic. 

The figure is significantly lower in neighbouring countries, especially in Armenia and Azerbaijan. However, this data might be misleading because Georgian officials decided to add antigen tests to the test count in December 2020, while Azerbaijan, Russia, and Turkey report only PCR tests (see here).

Moreover, Georgia registered the lowest number of excess deaths throughout 2020. 

In total, there were 333 excess deaths per 100,000 people throughout 2020 in Armenia, 190 excess deaths in Azerbaijan, 245 excess deaths in Russia, and 130 in Georgia (data was not available for Turkey). 

However, data is not available for 2021 and hence, cannot portray the full picture. 

Considering that in August 2021 Georgia tops the neighbourhood in terms of new cases as well as new deaths, it is likely that excess mortality figures have substantially deteriorated as of summer 2021. 

The fact that Armenia and Azerbaijan engaged in military conflict in autumn 2020 further complicates the task of drawing unequivocal conclusions regarding the countries’ efforts to track the virus.


Economic data

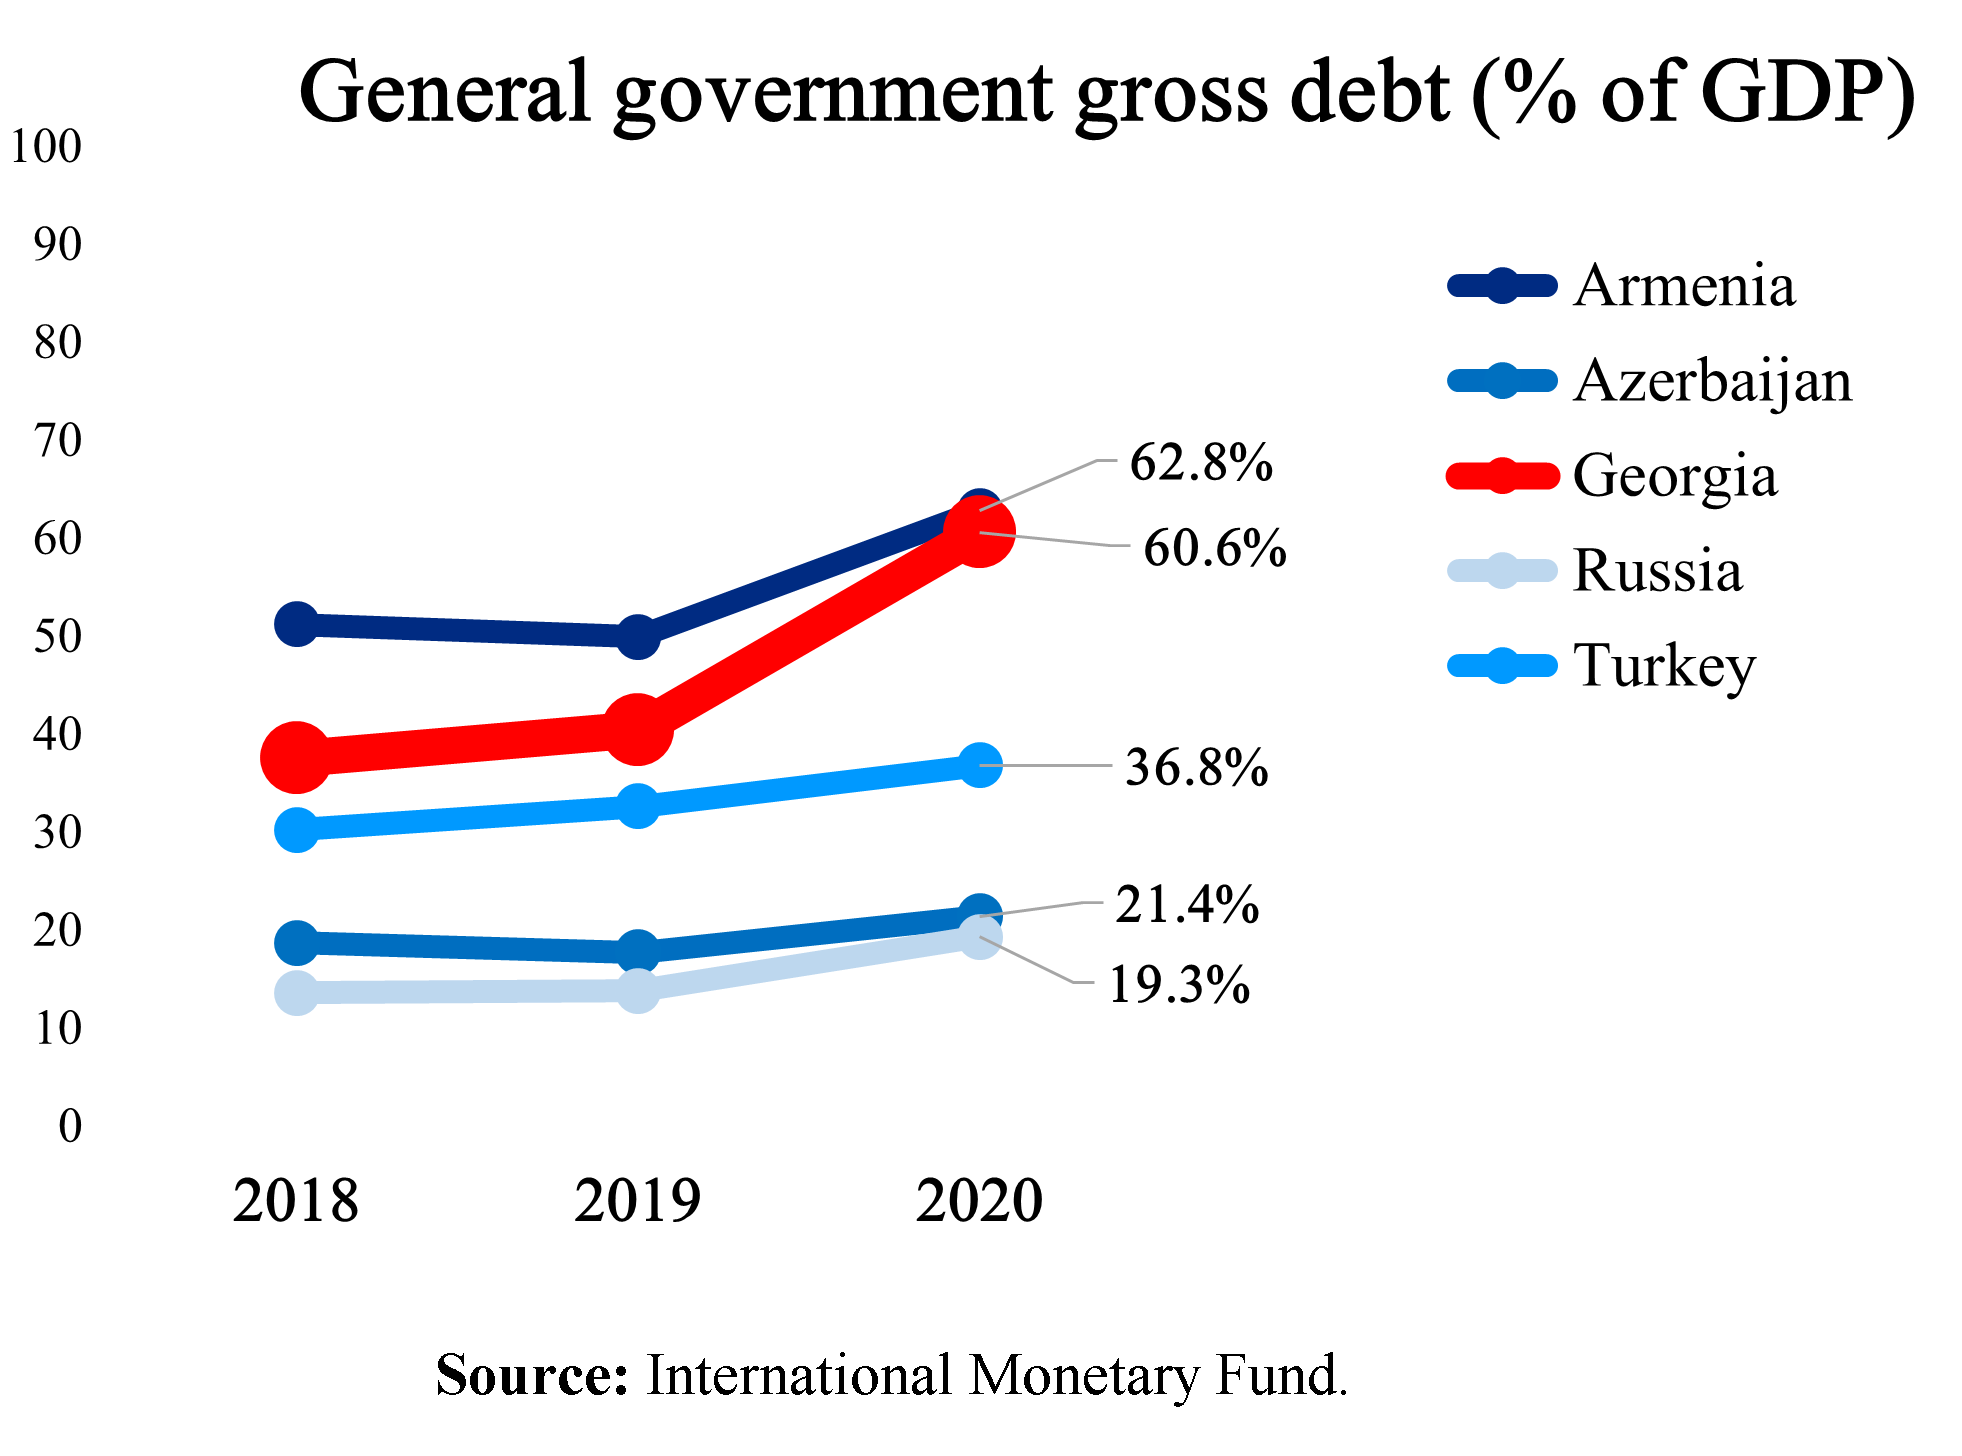
The economy of Georgia has also suffered. According to data from the World Bank and International Monetary Fund, Georgia had the second-highest inflation rate, the second-worst recession, and Georgia’s debt to GDP ratio is the second-largest in the neighbourhood.



Official data suggests Georgia has not done well in comparison to its neighbours in terms of managing the epidemic, with the exception of testing and tracking the virus, at least in 2020. 

Despite the initial success in containing the virus, since autumn 2020 Georgia has been the worst-hit country in the neighbourhood. 

That Georgia lags behind in terms of vaccination is perhaps the most concerning part of this. Vaccination is considered to be the only way to substantively reduce hospitalisation and fatality rates.

Had the economic figures looked encouraging, one could have argued that the country prioritised minimising economic hardship. Yet, if that was the case, the country failed, with the second-highest inflation rate and the second-worst economic recession in the region. What is more, among its neighbours, only Armenia has a larger debt ratio to its economy than Georgia.

Tuesday, June 15, 2021

Who smokes in Georgia?

[Note: This article first appeared on the Caucasus Data Blog, a joint production of CRRC Georgia and OC Media. It was written by Dustin Gilbreath, the Deputy Research Director at CRRC Georgia. The views presented in the article do not represent the views of CRRC Georgia or any related entity.]

An estimated 11,400 people die in Georgia due to tobacco consumption annually. Data from Caucasus Barometer 2019 suggests that efforts to counter smoking should likely focus on men, people in Tbilisi, and poorer individuals.

No one questions whether tobacco consumption is a public health scourge: tobacco is estimated to cause eight million deaths a year worldwide. In Georgia, in 2016, 29% of the 15+ population was estimated to be a smoker, making Georgia 33rd in the world for smoking prevalence at the time among 146 countries for which data was available. 

Overall smoking prevalence in Georgia is relatively high. Almost one-third of the public (29%) reported smoking in 2019.  This compares with 30% in 2013 and 35% in 2008, suggesting a decline of six percentage points between 2008 and 2019.  

Data in the 2019 Caucasus Barometer suggests that men in particular are significantly more likely to be smokers than women. While women have a nine percentage point chance of smoking, controlling for other factors, men have a 55 percent chance of smoking. 

In reality, the gap is likely smaller than this data suggests when it comes to sex. A large majority of the public (80%) think it is never acceptable for a woman to smoke. In this regard, it is reasonable to believe women would not necessarily report that they smoke to an interviewer. 

A study by the National Centre for Disease Control (NCDC) suggests that this is in fact the case. In the study, respondents were administered a urine test to check whether they had actually been smoking. It found that 12% of women had traces of tobacco in their body as opposed to the 9% that reported smoking on the survey. While this suggests the gap is likely being smaller than the data suggests, there likely remains a large divide.

Aside from sex, people’s age, settlement type, and household economic situation predict whether or not they smoke. Younger people are less likely to report smoking than people in the 35–54 age range, as are older people. The smaller share of older smokers likely stems from tobacco-related mortality. People in Tbilisi are almost twice as likely to smoke as people in rural areas. Similarly, people are 1.5 times as likely in other urban areas, compared with rural areas, to smoke. The poorest households in Georgia are 3 times as likely to smoke as the best off. 


Aside from who smokes, the data also tells us how much smokers smoke. Again sex predicts how much people smoke, as does people’s level of education. Controlling for other factors, female smokers smoke 12 cigarettes a day less than male smokers. People with a higher education smoke 5 cigarettes less per day compared with those with only secondary education or lower.

Although the data from the Caucasus Barometer is promising in that it shows that smoking prevalence has declined over the years, there are still a relatively large number of smokers in Georgia. 

The data suggests that anti-smoking campaigns need to target men in particular. Similarly, smoking is most common among poorer households and in Tbilisi, suggesting a need for increased anti-smoking efforts among these populations.

Note: The above data analysis is based on logistic and ordinary least squares regression models which included the following variables: age group (18-35, 35-55, 55+), sex (male or female), education (secondary or lower/vocational/higher), settlement type (capital, urban, rural), wealth (an additive index of ownership of 9 different items, a proxy variable), and employment situation (working or not). 


Monday, March 30, 2020

Air pollution in Tbilisi nearly halved by Covid-19 measures

[Note: This article was co-published with OC Media. It was written by Ian Goodrich, a policy analyst at CRRC Georgia. The views presented in this article do not necessarily represent the views of CRRC Georgia or any related entity.]

Particulate matter in Tbilisi’s air has fallen by as much as 45% following the introduction of measures to combat the spread of COVID-19, according to analysis of air quality data by CRRC Georgia.

The findings reflect broader global trends which have seen dramatic decreases in air pollution levels in China, Italy, and the United Kingdom.

Data from the Ministry of Environmental Protection and Agriculture show a clear fall in air pollution in the Georgian capital.

The plot below examines overall pollution levels in Tbilisi over the last month, overlaid on the same period for the last three years.

It highlights key dates in the COVID-19 crisis, specifically the first registered case, on 26 February, the closure of bars and restaurants and restrictions on entry into the country on 16 March, and the declaration of a state of emergency on 21 March.


Note: Two-day rolling average of the mean of normalized values for carbon monoxide, nitrogen dioxide, sulfur dioxide, and particulate matter (PM2.5, PM10).

Total pollution appears to be lower following the closure of bars, restaurants, and borders. The data also suggest that in the case of these closures, falls in pollution appear to have preempted policy decisions. The pattern that emerges should be intuitive for anyone who has looked outside in Tbilisi over the last few weeks.

Air pollution is however strongly seasonal, peaking and falling throughout the day, week, and year. It is also closely tied to weather patterns: strong wind, for example, will disperse pollutants. Modelling allows these factors to be taken into account when determining the overall impact of Covid-19 measures.

Models have been created for levels of five key pollutants in Tbilisi, examining particulate matter (PM 2.5 and PM 10), carbon monoxide, nitrogen dioxide, and sulfur dioxide. The models adjust for seasonal factors using Facebook’s Prophet tool, and weather using daily data from NASA.

The models show that following the declaration of emergency, almost all categories of air pollution fell. The only exception to this pattern is sulphur dioxide which has remained relatively constant throughout.


The most dramatic impacts from COVID-19 related measures are seen for particulate matter pollutants (PM2.5 and PM10) with each falling by 40%–45% after the emergency declaration, approaching half their pre-crisis rate.

Interestingly, for these substances, a sharp fall was present prior to the introduction of emergency measures. It is possible that this drop may be a consequence of the decline in vehicle traffic as workplaces and recreational venues began to close.

In contrast, other substances only declined following the introduction of emergency measures. Differences in change patterns are likely attributable to the different sources of pollutants.

Notably, changes are most pronounced for particulate matter, carbon monoxide and nitrogen dioxide, substances related to transportation.

No significant change was observed for sulfur dioxide, which is more closely associated with coal and oil burning for power generation.

These pronounced changes show the profound impact of human activity on the capital’s air. The restrictions imposed in response to COVID-19 are by necessity severe, but also temporary. As life returns to normal and the crisis abates, policymakers may reflect on these changes when considering how to tackle air pollution.


Note: The data and replication code for the analysis presented above is available here. The data analysis used an interrupted time series design, a quasi-experimental method which tests for significance in difference between points in a time series before and after a cut-off. 

Monday, August 06, 2018

People’s views about who should pay for health insurance in Georgia

A previous CRRC blog post explored attitudes in Georgia towards the role of the government, and specifically, whether people think the government should act as a parent or as an employee with regards to its citizens. One very specific aspect of this issue is reflected in opinions about how much the government should be involved in coverage of health insurance expenses.

According to the findings of a survey that CRRC-Georgia carried out for Transparency International - Georgia in March, 2016, only 3% of the population reports that people should cover their and their family members’ health insurance expenses themselves, while an absolute majority (96%) says these expenses should be covered at least partly by the government. A slightly larger share of people in this group (52%) would expect the government to fully cover the population’s health insurance expenses, while according to 44%, these expenses should be covered partially by people themselves and partially by the government.

Although the two questions were asked in two different surveys, thus, direct comparison of the findings is not possible, there are demographic similarities between those who view the government as a parent and those who expect the government to fully cover the population’s health insurance expenses, on the one hand, and, on the other hand, between those who view the government as an employee and those who say that health insurance expenses should be covered partially by people themselves and partially by the government. The previous blog post highlighted that people with higher than secondary education and those residing in the capital were more likely to view the government as an employee than as a parent. Similarly, people with higher than secondary education and those living in the capital report health insurance expenses should be covered partially by people themselves and partially by the government.


Note: The answer options for the question, “What is the highest level of education you have achieved to date?” were grouped as follows: options “No primary education”, “Primary education (either complete or incomplete)”, “Incomplete secondary education”, and “Completed secondary education” were grouped into the category “Secondary or lower”. Options “Incomplete higher education”, “Completed higher education (BA, MA, or specialist degree)”, and “Post-graduate degree” were grouped into the category “Higher than secondary”.

Interestingly though, whereas the previous blog post reported that women were more likely to believe the government should act like a parent, there is virtually no difference between men’s and women’s opinions on how health insurance expenses should be covered.

To explore the data used in this blog post further, visit our Online Data Analysis platform.

Monday, July 30, 2018

Most dog owners in Tbilisi vaccinate their dogs, but few spay or neuter them

Based on the findings of a phone survey of the population of Tbilisi, conducted by CRRC-Georgia for the British charity Mayhew in November, 2017, 15% of Tbilisi households have one or more dogs at home. A majority of dog owners reported their dogs were vaccinated at the time of survey, but few spay or neuter them.

Only 5% of Tbilisi dog owners reported having never visited a veterinarian, although it should be kept in mind that the margin of error is rather high when analyzing the relatively small group. Almost all dog owners who visit veterinarians do this for the purpose of vaccination, while other reasons include hygiene and grooming, parasite control, and accident/trauma, each reported by approximately 1/5th of dog owners.

Vaccination is important to protect both dogs and humans from diseases like rabies. An absolute majority of dog owners (97%) reported they have vaccinated their dogs. However, only about one in five dog owners reported their dogs were sprayed or neutered. The following reasons for not spaying or neutering dogs were named most frequently:

  • The dog owners wanted their dog(s) to have puppies;
  • They were against either of these practices for ethical reasons; 
  • They saw no need to spay/neuter their dog(s).

Spaying and/or neutering dogs is important not only from the point of view of controlling the dog population, but it also may reduce dogs’ risk of cancer. The findings presented in this blog post suggest there is a need to raise the awareness of Tbilisi dog owners on the importance of spaying and neutering their dogs. Importantly, when providing reasons why they did not spay or neuter their pets, dog owners did not mention that they do not trust veterinarians. This suggests that veterinarians could potentially be trusted communicators for awareness raising activities.

To explore the data in this blog post more extensively, visit CRRC’s Online Data Analysis portal.

Monday, July 24, 2017

Nudging Marshrutka Safety

[Note: Dustin Gilbreath is a Policy Analyst at CRRC-Georgia. This article was originally published on Eurasianet. ]

Auto safety is a perennial issue across Eurasia, as the generally poor condition of highways and byways, the proliferation of haphazardly maintained vehicles and a proclivity for reckless driving mean that death is a constant part of life on the road.

Among the most hazardous forms of public transportation are the ubiquitous communal minibuses known as marshrutkas, which ferry passengers around and between cities and towns. Marshrutkas are a mixture of taxi and public bus, and, for passengers, make up in convenience what they lack in comfort. But there is also a significant risk involved in using marshrutkas because many are old and in need of repair, and they are operated by overworked, stressed-out and distracted drivers.

But there is good news for marshrutka users: an experimental project conducted in Georgia suggests that a cost-efficient monitoring program could significantly increase rider safety.

The monitoring format, developed by the Caucasus Research Resource Centers-Georgia, underwent a month-long test, starting last September 20. CRRC recruited paid observers to ride on marshrutkas and monitor the driving behavior of operators. Monitors tracked marshrutka trips in three phases. In the first, they recorded whether a group of drivers engaged in dangerous driving behaviors, including passing in places where it was illegal, and distracted driving behaviors like smoking and talking on a cell phone. This contingent formed the trial’s control group.

For the second phase, monitors followed a different group of drivers, who were told in advance that they were being observed and that if they were judged the safest driver in the survey, they would receive a fuel voucher. The drivers in the second group were also told that an anonymous monitor would at some point in the near future come back to observe their road behaviors.

The last step involved monitors returning to both the control and treatment groups unannounced to observe driving.

By comparing the results of the first phase to the second, it was possible to determine the effect of overt observation on driving patterns. Evaluating participants in the second phase to the same minibuses in the third provided insight into whether those who knew they were monitored, and were told they would be monitored again, maintained safer driving practices. Lastly, by comparing the first-phase drivers to their third-phase performances, it was possible to test for the consistency of driving behaviors by the control group.

The results of the trial indicated that a small, anonymous monitoring program could be effective in improving driver practices. While in the first round of observation, 96 percent of drivers engaged in some form of dangerous driving, among those in the second group, who were told in advance that they were being monitored, the number was 70 percent. And while 79 percent of drivers made illegal passes in first phase, 43 percent from the second group engaged in such behavior.

In the third phase, carried out several weeks after the first two phases, drivers from the second group still engaged in 14 percent fewer dangerous driving behaviors than those from the first group who had not been told in advance that they were being observed.

CRRC-Georgia’s project involved the monitoring of 360 inter-city minibus trips in a randomized control trial (RCT). RCTs are considered the gold standard in social science because they provide firm evidence of cause and effect through randomly giving a treatment to some individuals, and not others and then comparing outcomes.

While the marshrutka safety experiment raises hopes that a monitoring program could encourage changed behaviors, the evidence is not definitive. The experiment did not take weather into account, a factor that can potentially alter driving patterns. It also could not measure precisely for the possibility of contamination of the source pool, i.e. drivers who had been observed later talking about the project with colleagues, and encouraging other drivers to be more careful behind the wheel.

While the experiment was carried out in Georgia, there is no particular reason to suspect that such a policy would not work in other areas and contexts.

Monitoring projects could be conducted either by non-governmental organizations or by municipal government agencies. A government-run project would likely stand a better chance of improving safety, as drivers could be fined for hazardous driving, as well as rewarded for safe driving. This policy would likely have a greater impact since social scientists have repeatedly shown that individuals strive to avoid losses much more intensively than they seek out gains. 

[Note: Dustin Gilbreath is a Policy Analyst at CRRC-Georgia. This article was originally published on Eurasianet. The full report this article is based on is available here: http://bit.ly/2txNQRR. The data and replication code for the analysis in this article is available here: http://bit.ly/2us0tCr. The research presented in this article was funded through the East-West Management Institute’s (EWMI) Advancing CSO Capacities and Engaging Society for Sustainability (ACCESS) project, funded by the United States Agency for International Development (USAID). The content of this article is the sole responsibility of the author and does not necessarily reflects the views of USAID, the United States Government, or EWMI.]

Thursday, April 06, 2017

Safer transport options for passengers: Recommendations

In the previous blog posts in this series (see here, here, here, and here), we reported the design and results of a randomized control trial on minibus safety in Georgia. In this blog post, we provide recommendations for the Government of Georgia based on the results of the experiment. First, we recommend that the Government:
  • Create an anonymous minibus monitoring program
Telling minibus drivers that they are being monitored for safe driving and may be punished for safety-violations may lead to safer, less distracted driving. The results of the experiment suggest such a program would likely be effective. This suggests that the government has an opportunity to implement a small program, which could have an important impact on making minibus driving safer and reduce the number of accidents related to dangerous driving. If the government does in fact implement such a program, we recommend that the program:
  • Fine unsafe minibus drivers
While our experiment could not test the impact of a potential fine for unsafe driving, the behavioral economics literature suggests that individuals are roughly twice as likely to avoid losses as they are to seek out gains. Given that losses have stronger effects, this is also likely to ensure that there actually is an overall effect of the program. Importantly, this may offset costs associated with the program.
  • Publicize the program in the lead up to implementation
Minibus drivers should be made aware of the program. If they do not know that they could be monitored, the program will be slower to encourage safe driving.
  • Select routes for monitoring randomly on a daily basis
This would help prevent drivers from driving artificially safely in order to avoid a fine on a trip when they believe a monitor to be present based on prior information.
  • Use few monitors, and change them regularly
The success of such a monitoring program relies on monitors being able to maintain their anonymity. In a country like Georgia, with a small population and dense social networks, maintaining monitor anonymity will be challenging. Hence, the government should consider drawing monitors from one of the civil service agencies with a relatively large staff. The Ministry of Internal Affairs Patrol Police Department would likely be an ideal institution given that patrol police officers are already aware of road safety legislation, and there are a sufficiently large number of officers who could participate in the program on a rolling basis.

The above recommendations are likely to help improve the safety of marshutka driving in Georgia. With less distracted and dangerous driving on Georgia’s roads, the high level of accidents, injuries, and fatalities on roadways are likely to decline. Ultimately, such a policy is likely to lead to safer transport options for passengers.

Wednesday, April 05, 2017

Safer transport options for passengers: Immediate, lasting, and contagion effects

As the last two blog posts in this series have described, CRRC-Georgia carried out a randomized control trial on minibus safety. This post reports the results of the experiment, and specifically whether there were immediate effects of being monitored, lasting effects on drivers which were monitored, and whether drivers who were not aware that they were being monitored ended up driving safer as a result of contagion effects i.e. drivers talking to each other about the monitoring. Overall, the results suggest that a small minibus monitoring program is likely to decrease dangerous driving behaviors in Georgia.

Did active knowledge that an individual was being monitored matter? To find out, we compare the control group from the first wave with the treatment group observations from the second wave. The statistical analysis suggests that drivers made 1.4 fewer calls per trip, smoked 1.5 fewer cigarettes, made 2.2 fewer illegal passes, and 2 fewer aggressive maneuvers on average. Overall, in the group that was directly aware that it was being monitored, there were 7.2 fewer incidents on average per trip. Other measures such as speed and seat belt non-use did not decline or increase in a statistically significant manner.

Based on these statistics we can conclude that direct knowledge of being monitored lead to fewer distracted and other dangerous driving behaviors. However, did these effects last? To understand whether direct knowledge of being monitored and that one would again be monitored had a lasting effect, we compare the results of the drivers who knew they were being monitored to roughly two weeks later when they did not know they were being monitored. In this case, a lasting effect is present if there was a statistically significant decline in a behavior in the first round of monitoring, and no significant change in the second round of monitoring.

Data analysis suggests that drivers who knew they would be monitored maintained lower levels of smoking, telephone conversations, illegal passing, aggressive maneuvers, and number of incidents overall. However, it is important to note that the drivers did drive less safely than they did when they were aware of being monitored. The differences between waves are however not statistically significant, suggesting that drivers did in fact drive safer roughly two weeks after being aware that they were being observed and would be again.

When it comes to contagion, the results of the statistical tests uniformly show no significant change except for in speed. Given that this is one in ten tests and that there was no significant effect from the first wave of monitoring on speed, we suspect that this test may have been found to be significant based on chance or other extraneous factors.

The table below presents the average treatment effect on the treated for each indicator with Abadie Imbens standard errors in parenthesis. On the line following the indicator name, 95% confidence intervals are provided. One star indicates that the estimate has less than a one in twenty chance of being due to chance alone. Two stars indicates that the estimate has less than a one in one hundred chance of being due to chance alone, and three stars indicates that the estimate has less than a one in one thousand chance of being due to chance alone. No stars indicates no significant difference.


Based on the above statistics we can conclude that direct knowledge of being monitored led to fewer distracted and other dangerous driving behaviors. However, the combination of the lack of significant contagion effect in combination with the increased but not significant increase between treatment groups suggests that a comparison of descriptive statistics is important to gain a sense of whether there was a lasting effect. The table below shows the average of each indicator given above in each group of the experiment.

The average indicator for the third wave of treatment and control group observations are quite similar. The similarity between means suggests one of two things. First, there may have been a small contagion effect since the levels are lower than in the first round control as well as a lasting effect that was not statistically significant. Supporting this conclusion is that both second wave means are lower than the mean in the first observation of the control group. The second possibility, however, is a lack of lasting effect and that an external factor caused the lowering of indicators during the third wave of observation.

Overall, the results of the experiment suggest that direct knowledge of being observed lowers the number of dangerous and distracted driving behaviors by a significant amount. This experience may have a lasting effect on drivers. What does this mean for the policy we proposed in the previous post, and what can the government do based on this information? In the next post, we provide recommendations for the government based on the information presented in this post.

Tuesday, April 04, 2017

Safer transport options for passengers: A Nudge on Marshutka Safety

Within the auspices of the Safer Transit Options for Passenger’s project, CRRC-Georgia carried out a randomized control trial, attempting to test whether a small policy change could make a large difference to minibus driving safety in Georgia. What was that small change, and how did we measure whether it might matter? This blog post provides an overview of both the policy to be tested and how we measured whether it could work.

The policy

A potentially simple way of decreasing distracted and other dangerous driving practices among minibus drivers is to use anonymous monitoring combined with penalties for dangerous driving. Under such a policy, the government would hire a small number of monitors to ride on randomly selected minibuses throughout the country without informing the drivers. After the ride, the monitor would report on any serious road safety violation as well as the number of distracted driving activities and safety violations carried out. If the driver committed serious traffic violations fines could be given out.

This policy would encourage safe driving and discourage dangerous driving. Moreover, it would require a relatively limited amount of funds from the government. Assuming that only 10 monitors are engaged in the program and they work 200 days a year, they could easily make up to 4000 trips, covering the majority, if not every, minibus route in the country. By randomly assigning monitors to different routes, minibus drivers would not be able to predict whether they are or would be monitored on any given trip. Hence, with the credible risk of being fined, drivers would likely drive safer.

Testing the theory

While the above policy, in theory, is quite sound, practice and theory often diverge. Hence, in order to test whether the policy would in fact be effective, CRRC-Georgia carried out a randomized control trial, which tested whether the knowledge that drivers might be monitored for safe driving and drivers could receive an award might improve their driving in late 2016.

Randomized control trials are a research design that comes from medical research. When doctors are attempting to understand whether a new medicine is effective, they randomly assign whether a patient gets the new drug or a placebo. Randomization is used to try to eliminate whether confounding factors that may make the medicine (in)effective for different individuals are distributed equally between the groups that receive the medicine and the placebo. Following this logic, for the STOP experiment, we randomly assigned minibus drivers to either a treatment or control group.

While in medicine, a treatment is, well a medical treatment, in our case information and action functioned as treatments. Minibus drivers that were assigned to the treatment group were told that they were being observed on a number of driving safety measures, and that the safest drivers would be awarded a gas voucher.  Importantly, as an NGO, we could not make a credible claim about the issuance of fines. Hence, we were unable to fully test the effectiveness of the proposed policy above. Notably, we would expect the issuance of fines for unsafe driving to be a stronger incentive for individuals to drive safer, because people are usually more averse to losses than prone to seeking gains, a phenomenon psychologists refer to as loss aversion.

Between September 20th and October 20th, CRRC-Georgia interviewers observed 360 minibus trips in three waves of observation. In the first wave of observation, minibus routes which had been randomly selected were observed without telling the driver that they were being monitored. This group forms the study’s control group. In the second wave of observation, routes assigned to the treatment group were observed. In the third wave of observation, observers returned to both the control and treatment minibuses for anonymous observation.

Minibus drivers in the treatment group who drive along similar routes were informed that:

  1. Their trip would be monitored for safety along a number of dimensions;
  2. A monitor would return in the coming weeks and monitor their driving as well as other drivers again without telling them;
  3. If they were found to be among the safest drivers, they would be rewarded with a petrol voucher.
Over the course of the trip, monitors in all three waves recorded how many times drivers:
  1. Smoked;
  2. Text messaged;
  3. Had telephone conversations;
  4. Did not wear a seat belt;
  5. Passed in areas it was not legal to do so;
  6. Made other aggressive driving maneuvers;
  7. Behaved aggressively towards passengers;
  8. Behaved aggressively towards non-passengers.
Monitors also recorded stop and travel time, whether additional seats were added to the bus, whether passengers stood during the ride as well as a number of characteristics about the state of the minibus. Following the trip, the average speed of travel was calculated.

The above research design allows for a number of comparisons. First, by comparing the first wave control group to the second wave treatment group, we can test how the direct knowledge that one is being observed for safe driving effects driver safety. Second, by comparing the second wave treatment group to the third wave treatment group, we are able to tell whether the knowledge that one might be monitored again in the near future would have some lasting effect. Third, by comparing drivers in the first wave control group to drivers in the third wave control group, we can tell whether there was a contagion effect from the experiment i.e., whether the treated drivers talked to the non-treated drivers about the monitoring and they in turn also became safer drivers.

To test for the above types of effects, we used multivariate matching with genetic weights and calculations of average treatment on the treated (ATT). For readers interested in these methods, please see here. Using these methods, we calculate both the size of an effect and the probability that it emerged by chance alone.

In the next post in this series, which will appear tomorrow, we report the results of the experiment.

Monday, April 03, 2017

Safer transport options for passengers: Distracted and dangerous driving among minibuses

Over the course of this week, CRRC-Georgia will publish the results of a randomized control trial on minibus safety. While the introduction post to this series highlighted that Georgia’s roadways are dangerous, just how dangerous minibus drivers are has largely been left undescribed. As part of the Safer Transport Options for Passengers project, CRRC-Georgia collected data on dangerous and distracted driving practices on minibuses. This blog post reports descriptive statistics about distracted and dangerous driving from drivers unaware that they were being monitored.

While estimates do not exist for Georgia for how many accidents are caused by distracted and other dangerous driving practices, they are very likely contribute to the high fatality rates on the roads in Georgia. When it comes to distracted driving alone, studies from other contexts suggest that a distracted driver’s chances of being in an accident are four times higher. Cell phone use is associated with increased incidence of accidents among both novice and experienced drivers. Importantly, commercial vehicle drivers are no exception, with increased risk of accident associated with distracted driving among commercial drivers.

Overall, among minibus drivers unaware of being monitored, 96% engaged in some form of poor driving behavior, with illegal passes being the most common, followed by making telephone calls, and other aggressive driving maneuvers. Notably, few drivers were observed text messaging while driving. While we cannot claim that the data presented here is representative, for technical reasons, it is highly suggestive of the high prevalence of dangerous and distracted driving practices among minibuses on Georgia’s roadways.


The graph below presents the average number of times a driver engaged in a dangerous driving behavior as well as the maximum value for each indicator. Although the minimum value was 0 for each indicator, the high values for the maximums suggest that some drivers are particularly prone to dangerous driving, with as many as 62 dangerous events observed in a single trip.


The above statistics suggest that distracted and dangerous driving are common problems among minibus drivers in Georgia. In order to help ameliorate the situation, CRRC-Georgia tested whether a simple minibus monitoring policy would decrease the prevalence of dangerous and distracted driving. In subsequent posts in this series, we report the results of the randomized control trial, which suggest that such a program would in fact be effective.

Monday, February 13, 2017

One in four in Georgia report taking antidepressants or antibiotics without a prescription

On a 2016 CRRC survey conducted for Transparency International Georgia (TIG), one in four adults in Georgia reported taking either antidepressants or antibiotics without a doctor’s prescription during the 12 months before the survey. Self-medication with anti-depressants can cause serious problems. While anti-depressants may have side-effects even when taken under the supervision of a physician, the risks are higher without a doctor’s care. Self-medication with antibiotics is also problematic. If taken improperly, they can contribute to the creation of antibiotic-resistant bacteria, which is often thought to be one of the world’s most pressing health problems. Surely, when a quarter of the population reports taking these types of drugs without the supervision of a physician, it represents a public health concern, one of many in Georgia. Current regulations clearly fail to prevent such practices. This blog post looks at which groups in the population report more often taking antidepressants or antibiotics to self-medicate.

Women are significantly more likely to report taking antibiotics or antidepressants without a doctor’s prescription compared to men. While 21% of men reported self-medicating with these kinds of pharmaceuticals the year before the survey, 30% of women did so. A simple cross tabulation suggests the problem is largest in rural settlements. Men in different settlement types are equally likely to report taking these drugs without a prescription, while women in rural settlements are most likely to report doing so.

Note: Only the shares of those answering “Yes” are shown on the charts in this blog post. 

At first glance, the older population (56 and older) in general appears more likely to take anti-depressants and antibiotics without a doctor’s prescription. Similar to the finding with settlement types, men of different ages are equally likely to do so, while women who are 36 years old or older report to be doing so most often.

With the use of antibiotics and antidepressants, a doctor’s supervision is particularly important. Many in Georgia still take such drugs without it, and the practice is more common among women than men. In order to begin to deal with this issue, the government of Georgia, and, in particular, the Ministry of Labor, Health and Social Affairs, as well as civil society organizations should increase awareness of the problems associated with self-medication with anti-depressants and antibiotics, especially among women.

The data which this blog post reports on will soon be available at our Online Data Analysis tool, and is currently available for download here.

Monday, March 21, 2016

Body Mass Index in Georgia


Thursday, July 16, 2015

The population of Georgia on the ideal number of children per family

Many factors determine the size of families, including economic, cultural and social influences. Not surprisingly, people’s considerations about its “ideal” size do not often match the reality. In this blog post, we shall have a look at whether Georgians’ views about the ideal number of children per family meet the reality, and how these views differ according to people’s sex, age and settlement type, using data from CRRC’s Caucasus Barometer survey in 2013.

In response to the question, “What do you think is the ideal number of children per family in Georgia?” there is no statistically significant difference in responses by sex: 47% of women and 45% of men consider three children to be ideal. 

Although the same is true for representatives of all age groups, younger people are more likely to think that smaller family sizes are better. Among the 18-35 age group, 21% say two children is the ideal number, compared to 11% for 36-55 year olds and just 6% in the 56+ age group. On the other hand, twice as many over-55s prefer four children than do 18-35 year olds (34% compared to 16%), and just 4% of both 18-35 year olds and 36-55 year olds think the ideal family has five children, whereas 10% of over-55s do so, with a further 3% thinking six or more children would be best.


Note: Responses “Don’t know” and “Refuse to answer” were excluded from the analysis throughout this blog post. 

The Caucasus Barometer data also shows that attitudes to family size change based on where people live, with a slight preference for bigger families in rural settlements, while in the capital and other urban settlements more than half of people think three children is ideal. 


There is also a strong preference for two or three children among women aged between 18 and 35 – the main childbearing age group, – of whom 77% think so. 


How do actual family sizes match up to this? Figures from Geostat, Georgia’s national statistics office, show that although the number of first children being born has been decreasing in Georgia since 2009, there is an overall rising number of births, that should be attributed to an increase in the numbers of second and third children per family. For instance, in 2006, the share of families’ first children’s births was 61%, second children’s – 28% and third children’s – 9%. By 2014, when the total number of births was much higher, the share of first children’s births had fallen to just 43% of the total, while second and third children’s births comprised 38% and 14%, respectively – the highest levels in any year covered by this data.

This suggests that family size – and, specifically, the actual number of children per families – is edging towards the levels that Georgians say they consider ideal. 

Do you think we’ll soon have most of the Georgian families having three children? Share your thoughts with us here or on our Facebook page. 

More data from the Caucasus Barometer surveys is available on our Online Data Analysis site. 

Monday, October 27, 2014

Don’t worry, exercise, and be happy

It has become common knowledge that those who exercise regularly are healthier than those who do not, but are those who exercise also happier? According to research conducted by the University of Bristol, people who regularly exercise are happier, more productive at work, and less stressed than those who are not engaged in regular physical activities. Furthermore, extensive research has shown that physical exercise can combat depression and improve mood through neurogenesis and endorphin release during a workout. Using data from the 2013 CRRC Caucasus Barometer (CB) survey, this blog post looks at whether physically active people are happier and more satisfied with their lives than those who do not engage in regular physical activity. It also looks at which sex is more physically active in Georgia- men or women- and  whether residents of the capital, other urban settlements or rural areas are more likely to exercise.

Despite the benefits of physical exercise, the percentage of Georgians who exercise on a regular basis is low, as is the case in the US and the EU. According to CB, 16% of the Georgian population exercises on a regular basis for at least two hours per week, and men (22%) are twice as likely to engage in regular physical activity as women (10%).

Interestingly, 35% of those who exercise regularly for at least two hours per week consider themselves extremely happy and another 38%, happy. This is a slightly higher share compared with those who do not exercise. Only 5% of exercisers report being unhappy, while 15% of those who do not exercise report being unhappy.

 Note: A 10-point scale was used to record respondents’ answers to the question “Overall, how happy would you say you are?” For the chart above, the original scale was recoded to a 5-point scale, so that codes ‘1’ and ‘2’ were grouped into “Extremely unhappy”, codes ‘3’ and ‘4’ into category ‘2’, codes ‘5’ and ‘6’ into category ‘3’, codes ‘7’ and ‘8’ into category ‘4,’ and codes ‘9’ and ‘10’ into “Extremely happy.” Options “Do not know” and “Refuse to answer” were excluded from the analyses. 

Furthermore, people who are physically active appear to be slightly more satisfied with their lives than those who do not exercise. According to the graph below, out of those who exercise, 40% say they are satisfied with their lives, while this number decreases to 33% among Georgians who do not exercise on a regular basis. The difference is more distinct for those who report not being satisfied with their lives: 18% of those who exercise report not being satisfied compared with 31% of those who do not exercise.

 Note: A 10-point scale was used to record respondents’ answers to the question “All things considered, how satisfied are you with your life nowadays?” For the chart above, the original scale was recoded to a 5-point scale, so that codes ‘1’ and ‘2’ were grouped into “Not satisfied at all”, codes ‘3’ and ‘4’ into category ‘2’, codes ‘5’ and ‘6’ into category ‘3’, codes ‘7’ and ‘8’ into category ‘4,’ and codes ‘9’ and ‘10’ into “Completely satisfied”. Options “Do not know” and “Refuse to answer” were excluded from the analyses. 

According to the data, residents of the capital and other urban settlements are more physically active than those living in rural settlements; 22% of people living in Tbilisi and 20% of people living in other urban settlements exercise on a regular basis, while only 9% of the rural population reports exercising on a regular basis.


To summarize, the percentage of Georgians who engage in regular physical exercise is not much different from the populations of the US or EU countries. It appears that the level of happiness and life satisfaction are higher among Georgians who work out regularly. If you would like to explore issues related to physical activity and the level of happiness and life satisfaction in the South Caucasus further, please visit the CRRC website or look at the data using our Online Data Analysis tool.


Wednesday, May 28, 2014

Smoking in the South Caucasus and tobacco policy in Azerbaijan

May 31st is World No Tobacco Day as declared by the United Nations. According to the World Health Organization (WHO), tobacco usage is the primary reason for chronic diseases including “cancer, lung diseases, cardiovascular diseases” among other diseases. According to WHO, as of July 2013, “nearly 80% of the more than one billion smokers worldwide live in low- and middle-income countries, where the burden of tobacco-related illness and death is heaviest.” Moreover, the general consumption of tobacco products has increased, although a tendency towards decreased consumption is observed in high-income and upper middle-income countries. In Azerbaijan, along with economic development, there is a tendency of declining consumption of tobacco products. This fact might also be associated with rising social awareness about the harm that tobacco causes to overall health.

The 2001 law of the Republic of Azerbaijan on tobacco and tobacco products covers several issues such as the prohibition of sales of tobacco products to individuals younger than 18 years old, restrictions on promoting the sale of tobacco products, and prohibition of smoking in health-care facilities, workplaces in public buildings, in all types of public transport, and in educational facilities except universities. Yet, the issue of banning smoking in public places in Azerbaijan has been consistently raised during sessions of the government’s legislative body (the Milli Majlis). However, the adoption of the law has been consistently postponed. Azerbaijan joined the WHO Framework Convention on Tobacco Control (WHO FCTC) in 2005 which implies that the signatories should apply six main tobacco control measures to reduce the demand for tobacco and its use.

These measures are known as “MPOWER” - “Monitor tobacco use and prevention policies, Protect people from tobacco smoke, Offer help to quit tobacco use, Warn people about the dangers of tobacco, Enforce bans on tobacco advertising, promotion and sponsorship, and Raise taxes on tobacco.” Unfortunately, the legal basis for enforcing these measures in Azerbaijan remains unsettled and unimplemented even though a national strategy on tobacco control was developed in 2010.

In Azerbaijan, according to Caucasus Barometer data, the number of smokers has decreased from 31% of the population in 2008 to 25% in 2013. 75% of Azerbaijanis say they don’t smoke which is similar to results in Armenia (70%) and Georgia (73%). Notably, Azerbaijan and Georgia have a lower number of hard smokers (those who smoke more than 251 cigarettes per week) which is 3% and 2%, respectively, compared to Armenia where 8% say the same.


In general, smoking is not popular among women in the South Caucasus; 98% of women in Armenia, 99% in Azerbaijan, and 95% in Georgia say they do not smoke at all. There are negative perceptions associated with women who smoke in the South Caucasus, and this attitude might affect the number of women who claim to smoke in the countries of the region. The situation among males is different; 48% of men in Azerbaijan and Georgia, and 37% of men in Armenia say they do not smoke. Additionally, the number of hard smokers in Armenia is several times larger than in the other two countries.


Smoking is most popular among middle-aged men (36-55 years old), and they also report smoking more cigarettes than younger (18-35 years old) and older (56+ years old) men.


Overall, there is a positive trend in the decreasing number of Azerbaijanis who say they smoke. This is particularly notable among young males. According to the CB, the number of non-smokers among men aged 18-35 has increased from 46% in 2008 to 54% in 2013. The situation with other age groups has not changed significantly. One reason for this may be that young people are usually more socially active, and the media and other pro-health organizations can easily communicate anti-tobacco messages to them. If you are interested in more data on smoking in the South Caucasus, please visit the Caucasus Barometer data here as well as the WHO website’s page devoted to tobacco issues here.

 By Aynur Ramazanova

Tuesday, March 04, 2014

Health in the South Caucasus

With the recently concluded Olympics in Sochi and the controversies surrounding them, one might be interested in understanding how populations in the South Caucasus think about health and sport. What factors are related to perceptions of health in Armenia, Azerbaijan and Georgia? This blog explores perceptions of health, economic well-being, as well as whether a household limits its consumption of beef as one of many indicators related to a household’s economic situation.

South Caucasians who say they exercise for at least two hours a week are more likely to rate their health better than those who do not exercise at least two hours per week. The following graph depicts this trend in Armenia, Azerbaijan, and Georgia, and consistently shows that those who believe they are in good health are much more likely to say they exercise for at least two hours a week compared to those who report poor health.


Note: In this and following charts, the original five-point scale for the question, “Overall, how would you rate your health,” has been collapsed to a three-point scale by merging “very poor” and “poor”, and “very good” and “good.”

Additionally, people who consider their households to be on a higher economic rung in society tend to rate their health more positively. Respondents were asked to imagine there is a 10-step ladder reflecting the economic standing of all households in their country, such that the first rung corresponds to the lowest possible economic position in society, while the highest rung refers to the highest possible position. The following graph demonstrates this trend in the South Caucasus. In Georgia, where the trend is most pronounced, only 27% and 34% of families who report being on either the first or second rung report being in good health, whereas 91% and 59% of families who reported being on the fifth or fourth rung respectively, reported being in good health. This trend can be seen throughout the South Caucasus and suggests that the higher economic rung a family perceives itself to be on, the more likely they are to report good health.


Note: The first rung corresponds to the lowest possible economic position in society, while the highest rung refers to the highest possible economic position in society. Results were collapsed from an original 10-point scale.

Whether a family owns or consumes a number of consumer goods is a common indicator of well-being. The following graph looks at whether a household limits its consumption of beef and perceptions of health. As the graph indicates, families that are less likely to limit the amount of beef they eat are also more likely to report being in good health. Furthermore, the trend also largely holds for the consumption of many other foods and consumer products, as well as whether a family owns certain durable goods such as a personal computer.


This blog shows that health and perceptions of one’s household economic situation are related. Higher perceived economic status is related to more positive feelings about one’s health in the South Caucasus. What other factors might be at work when looking at how healthy one feels and how often one exercises? We encourage you to explore our data to find out more about health and exercise in the South Caucasus with our online data analysis tool here.


Tuesday, October 15, 2013

Funding for Healthcare in the South Caucasus

Government expenditure on healthcare can be an indicator of a government's commitment to the health of its citizens. It is also important for the sustainability of health programmes. Nevertheless, the total health expenditure in all three countries of the South Caucasus is dominated by private spending, including prepaid plans and “out-of-pocket” (on the spot) payments. This blog provides a brief overview of the patterns of government spending on healthcare in the South Caucasus during recent years. The blog also links these patterns to data from the 2012 Caucasus Barometer (CB) about assessments of health, satisfaction with health, and trust in the health system.

Total expenditure on health as a percentage of GDP provides information on the level of resources invested in health relative to a country's overall wealth. In developed countries, government spending on healthcare accounts for approximately 10% of gross domestic product (GDP) or more. This percentage of resources pooled by the government is comparatively lower in the South Caucasus. It accounted for as much as 9.9% of the total GDP in Georgia, 4.3% in Armenia and 5.2% in Azerbaijan, according World Health Organization data from 2011.


Total expenditure on health is distributed between private and government expenditures, which are also unequal across the globe. In more than half of low income countries, government expenditure on health is less than 50% of total health expenditure. Where health spending is comparatively lower in general, the shortfall is made up by private spending. This can also be observed in the South Caucasus where the private amount paid for health services dominates the expenditure (reaching around 78% in Georgia and Azerbaijan, and more than 64% in Armenia). Most of the private expenditure on health in all three countries is so-called “out-of-pocket” – made by patients to both public and private providers at the time of receiving health services. Despite the fact that this method of payment can result in financial catastrophe for individuals or households, in each country in the South Caucasus “out-of-pocket” expenses amounted to 89% of total private expenditure on health.


Despite more substantial budgetary allocations to citizens’ healthcare by the government in Georgia, compared to  Armenia, the CB shows that trust in the healthcare system in these two countries is almost the same (39% and 38%, respectively-“Fully trust” and “Somewhat trust” combined). Azerbaijanis’ trust in the healthcare system is the highest among the three countries, amounting to 51%. Considering the self-evaluation of one’s health, around half of the adult Azerbaijani population rates their health as good or very good. Again, this rate is lower in Georgia and Armenia, where only about one-third of these societies think they have good health. Interestingly, these numbers are again similar despite the fact that the Armenian government has larger health expenditure than the Georgian government.


Private expenditure still dominates the healthcare expenditure in the South Caucasus. Given that large parts of these populations are poor and cannot afford to spend much on healthcare, low levels of government spending on health might have an impact on the health of citizens. Nevertheless, a higher share of government health expenditure does not necessary directly influence the quality of a healthcare system, or an individual’s level of trust or self-assessment of health. Thus, other factors ought to be taken in consideration such as evolving purchasing power parity, the general price of healthcare, or remittances.

For more information on this topic, you are welcome to visit our Caucasus Barometer database.


Friday, July 13, 2012

Perceived Poverty in Georgia: Results of the 2011 Caucasus Barometer

The 2011 Caucasus Barometer asked the Georgian population, “Relative to most of the households around you, would you describe the current economic condition of your household as very good, good, fair, poor or very poor? The results revealed that 24% of Georgians rate their households’ economic condition relative to most households in Georgia as poor or very poor. 68% say it is fair and only 8% rate it as good or very good. Analysis shows that people in these three groups differ from each other, not only in terms of their perceived economic status, but also in a wide range of activities and feelings such as reading printed media, participating in social and cultural activities, and having feelings of happiness and good health.


Source: Caucasus Barometer 2011, Georgia
Note: In this and following charts the original five-point scale is collapsed to a three-point scale by merging “very poor” (1) and “poor” (2) as poor=1, and “very good” (5) and “good”(4) as good=3. The original score of 3 has been changed to 2 for fair. 

As the chart shows, people who consider themselves poor compared to most households in Georgia are less likely to read newspapers, spend time with friends, go for a walk, visit the theatre/cinema, do sports or exercise, or go to a public meeting than those who consider their economic status as fair or good. These data indicate that people who perceive their economic condition as good compared to most households in Georgia are forerunners in adopting a healthy life style and much more involved in social and cultural activities.

Moreover, the data show that there are some differences between these three groups in their health status, or to be more precise, in how they rate their health. The next chart shows that approximately one third (31%) of those who perceive themselves as poor compared to most households in Georgia rate their health as poor. This share decreases to 13% in the group of people who consider their economic status to be fair and to 4% for those who perceive their economic situation as good.

Source: Caucasus Barometer 2011, Georgia


Perceived poverty, less involvement in recreational activities and poor health status may be reflected in feelings of happiness. Indeed, data from the Caucasus Barometer indicate that people who perceive themselves as poor compared to most households in Georgia are more likely to say they feel unhappy.

Source: Caucasus Barometer 2011, Georgia


The chart shows that approximately one quarter (24%) of people who perceive themselves as poor are unhappy, while this share decreases to 3% in those who consider themselves to be in a better economic situation compared to most households in Georgia.

To conclude, the 2011 Caucasus Barometer data show that people in Georgia who consider themselves to be poor compared to most households in Georgia are less likely to spend time with friends, participate in different social and cultural events, or follow a healthy lifestyle (sports, exercise, hiking, etc.) than those who describe their economic condition as fair or good. These people are also less likely to consider themselves happy and rate their health as poor. 

The 2011 Caucasus Barometer offers more interesting data which is available and free on CRRC’s Online Data Analysis tool. Try it out!
