Showing posts with label Attitudes. Show all posts

Tuesday, June 06, 2023

Georgians' Attitudes and Beliefs Associated with Polarised Media Preferences

Note: This article first appeared on the Caucasus Data Blog, a joint effort of CRRC-Georgia and OC Media. This article was written by Givi Siligadze, a Researcher at CRRC-Georgia. The views presented in the article are the authors’ alone, and do not necessarily reflect the views of CRRC Georgia, the National Endowment of Democracy, or any related entity.

A recent NDI/CRRC survey suggests that Georgians have markedly different beliefs about the present state and future of their country, regardless of their party sympathies, depending on whether the television channel they trust is pro-government or pro-opposition.

Georgian media is widely considered to be heavily polarised, with its focus ‘almost entirely on the party-political agenda’, according to one respondent in a recent DW Akademie study.

This polarisation may have reached the point of impeding the functionality of the media: a 2021 study found that Georgia’s main media outlets in Georgia had become so partisan that their ability to report in the broader public interest was undermined.

Research using data from a March 2023 NDI/CRRC survey found that people’s attitudes and perceptions of Georgia and its politics differed significantly depending on what TV channels they considered trustworthy, even when controlling for party preferences.

The data suggests that people who trust pro-government TV channels tend to be more optimistic about the country's direction, less concerned with political issues, more convinced that Georgia is a democracy, and more open to Georgia cooperating with Russia on political as well as economic issues than people who trust pro-opposition TV stations.

In Georgia, one in five people (19%) trust pro-government TV channels the most (Imedi or PosTV). Roughly every eighth Georgian (13%) puts their trust in pro-opposition TV channels (Mtavari, TV Pirveli, Formula, Kavkasia), and a similar proportion (12%) of the public trusts other TV stations (Rustavi 2, GPB, Adjara TV, Obiektivi, etc.). The remaining 57% of the electorate trust no TV channel or are uncertain about which station they trust most.

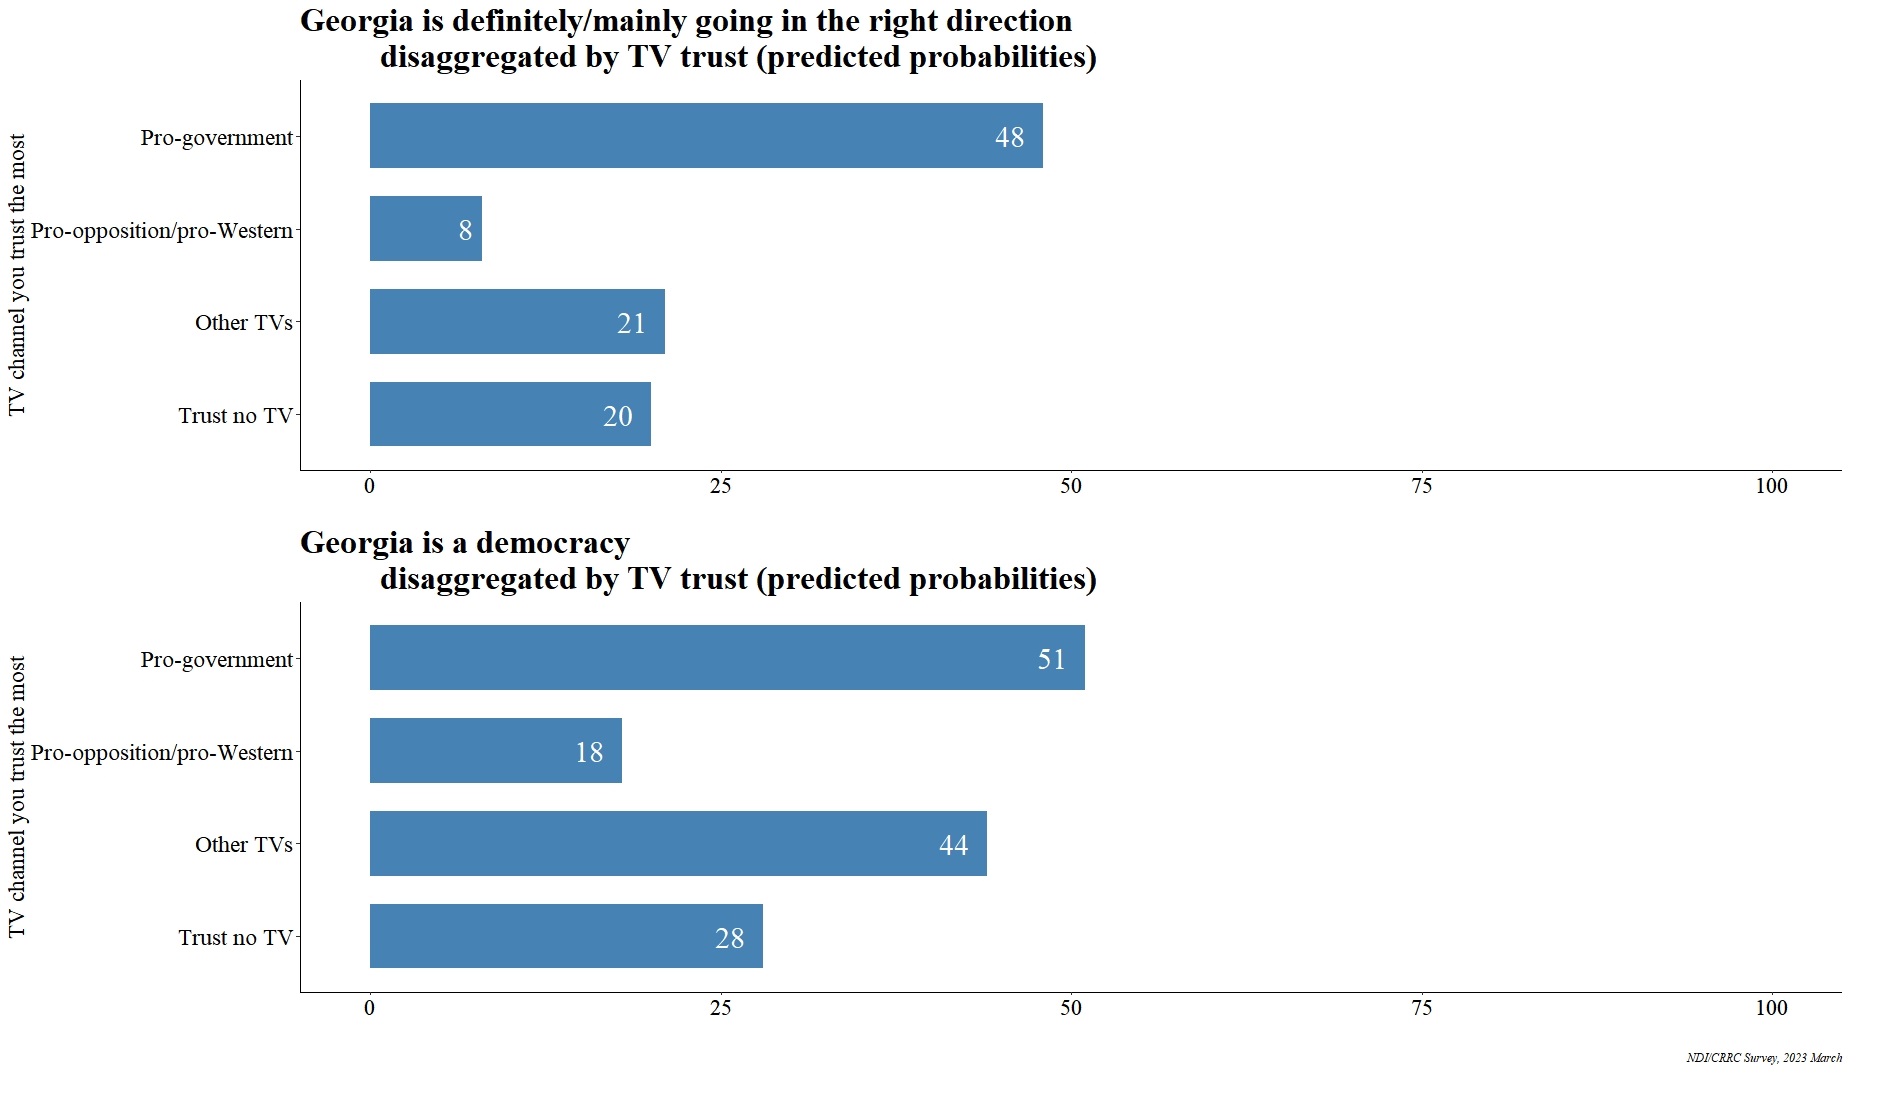
The data suggests that regardless of age, sex, settlement type, ethnicity, wealth, and partisan sympathy, people who trust pro-government TV channels tend to feel more positive about Georgia’s present and future, compared to people who trust other TV channels or do not trust TV at all.

All else being equal, Georgians whose most trusted TV channel is pro-government are 40 percentage points more likely than people who trust pro-opposition TV channels to think that the country is going in the right direction, and 33 percentage points more likely to say that Georgia is a democracy today, than people who trust pro-opposition channels.


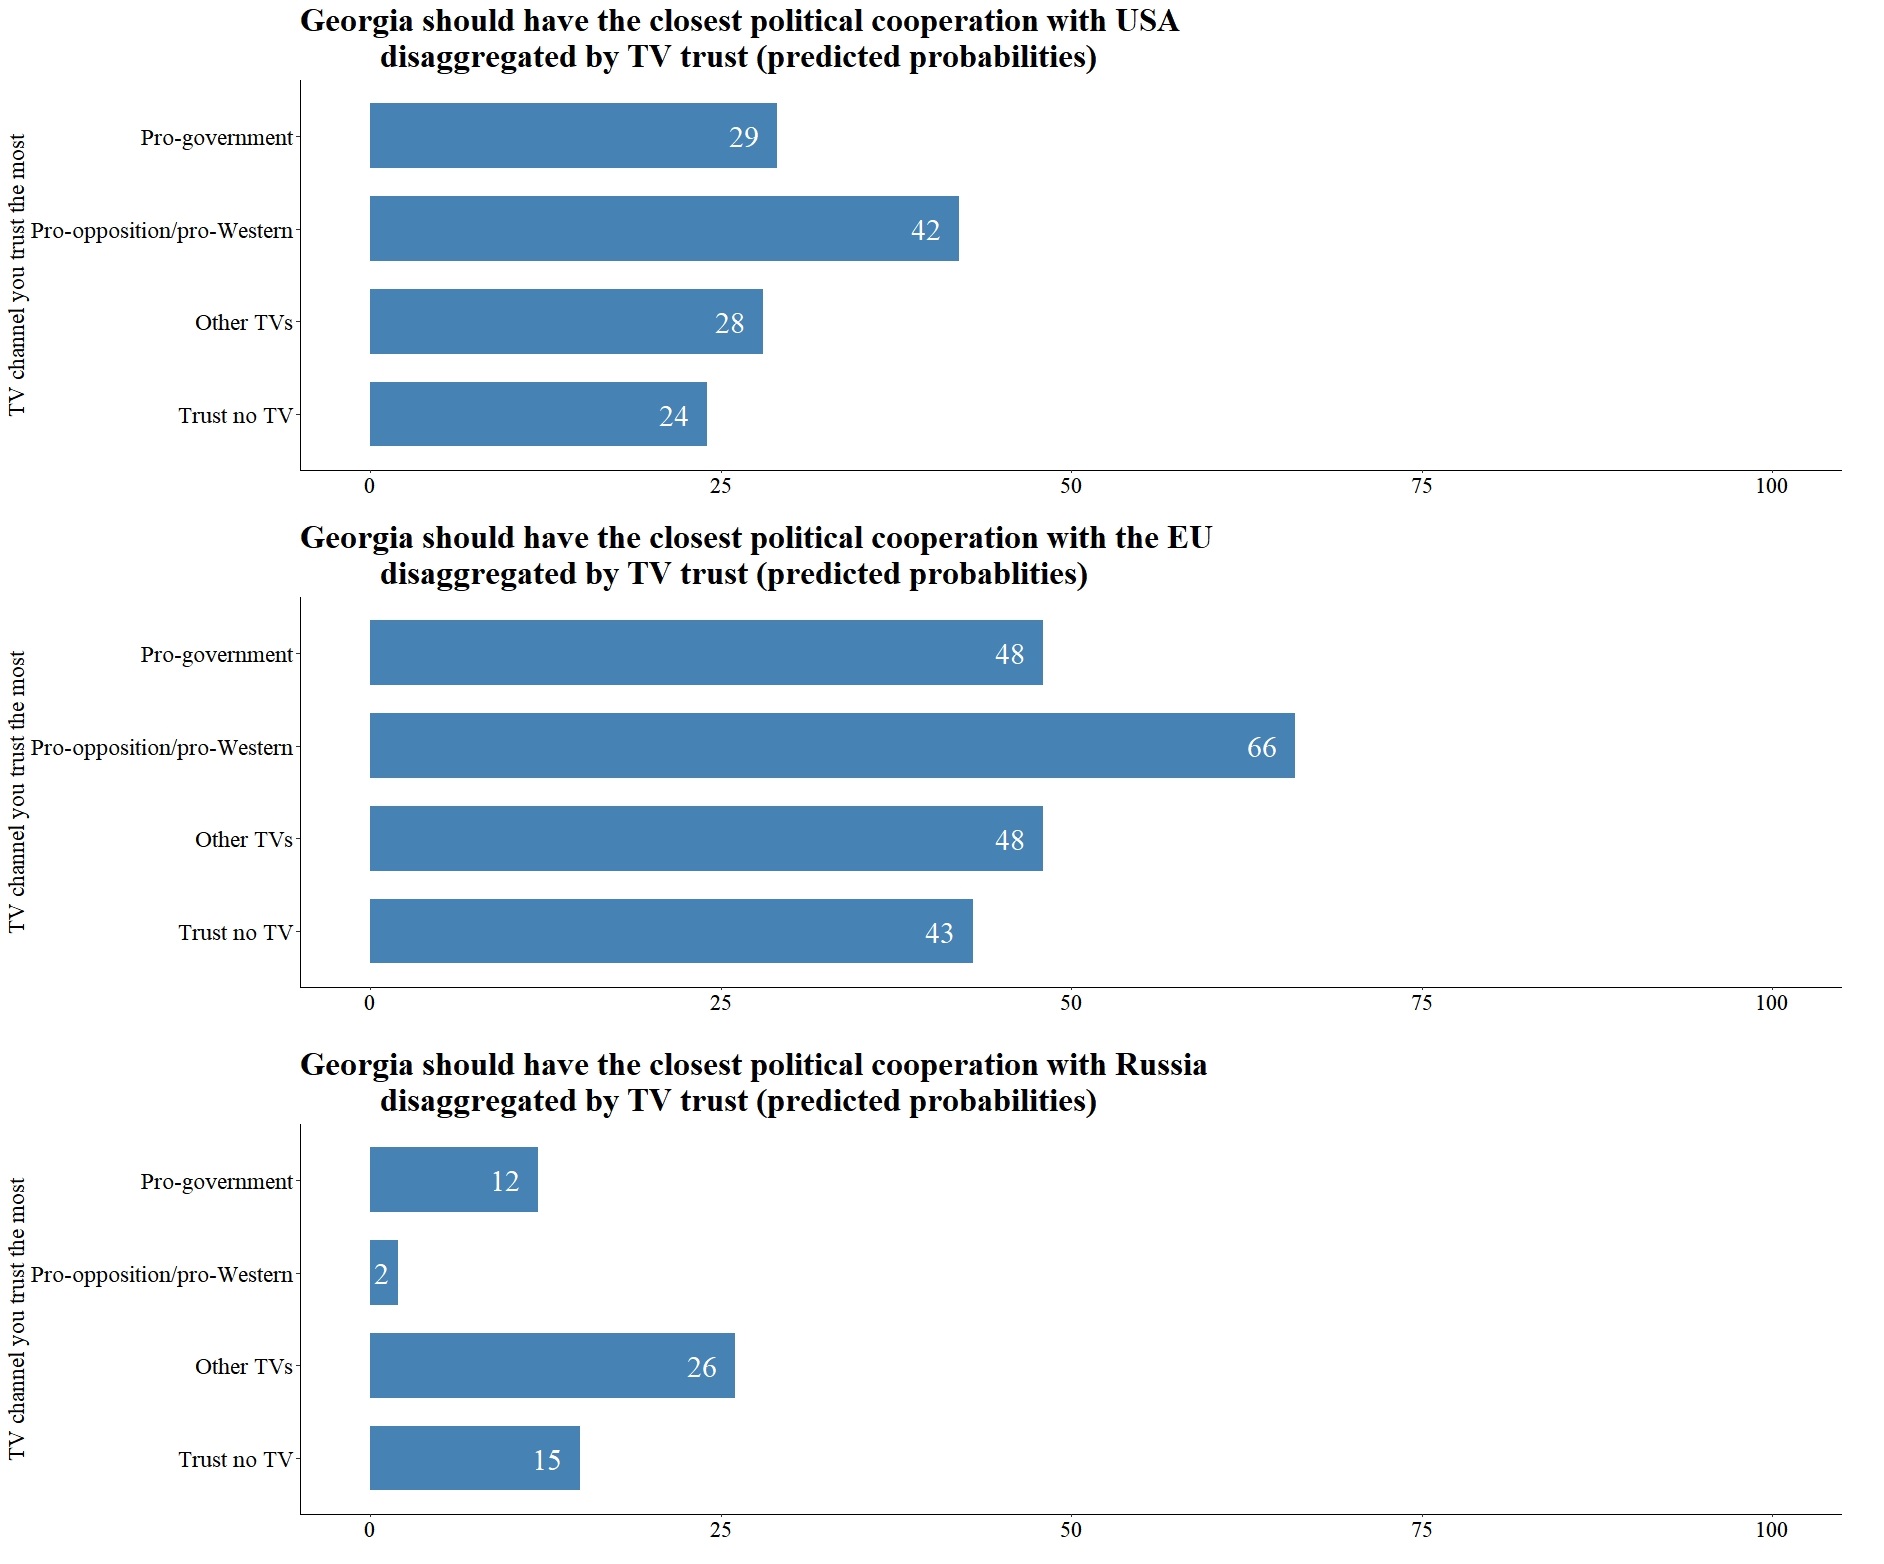
Regarding which countries or international organisations Georgia should have the closest political cooperation with, people who trust pro-opposition TV stations differ from other segments of the electorate.

A regression analysis suggests that people who trust pro-opposition TV channels tend to be more pro-Western and anti-Russian than people who trust pro-government media, other TV channels, or do not trust TV at all.

People who trust pro-opposition TV channels are 13 percentage points more likely to think that Georgia should politically cooperate most closely with the USA, and 18 percentage points more likely to think that the EU should be Georgia’s closest political ally, than Georgians who trust pro-government media.

Moreover, they are 10 percentage points less likely to say that Georgia should have its closest political ties to Russia.


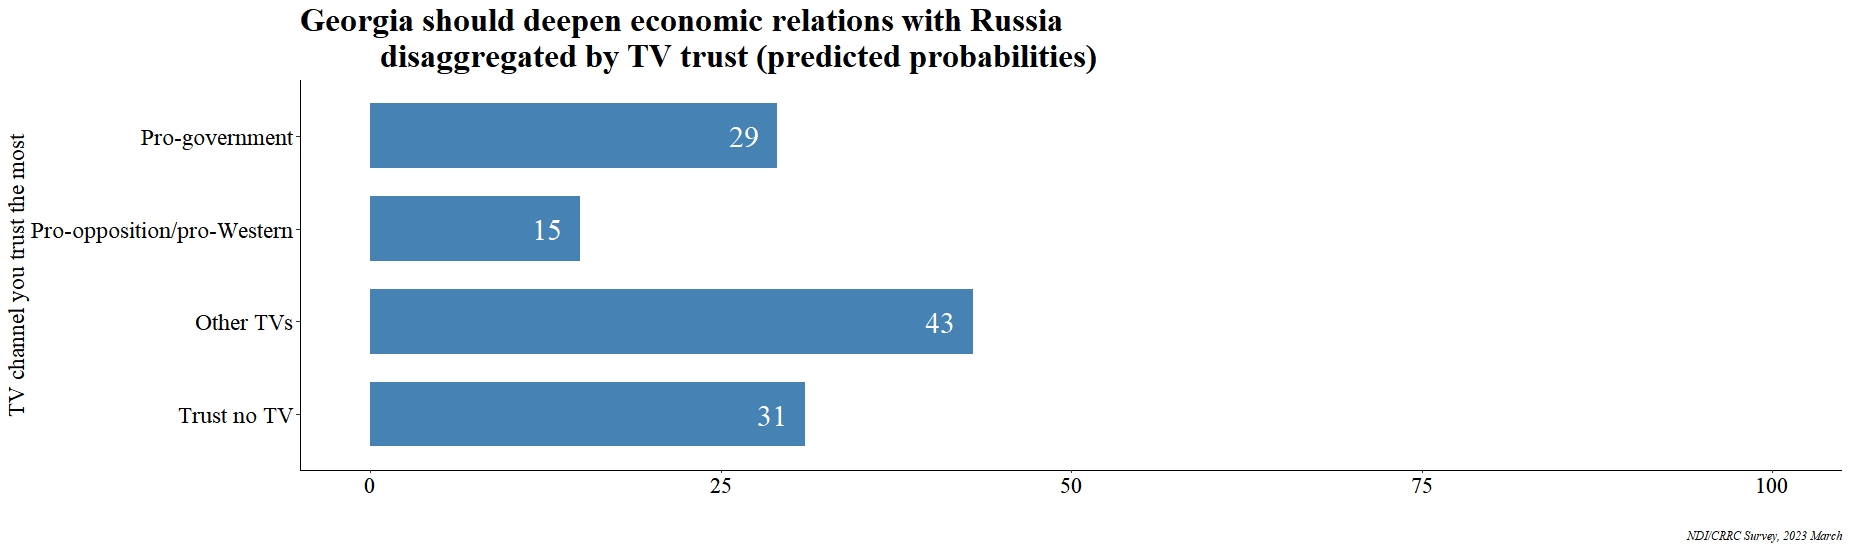
The patterns are similar for opinions on Georgia’s economic partnerships. The data suggests that after controlling for age, sex, settlement type, ethnicity, wealth, and partisan sympathy, people who trust pro-government TV channels are twice as likely to support deepening economic relations with Russia than people who trust pro-opposition TV stations.


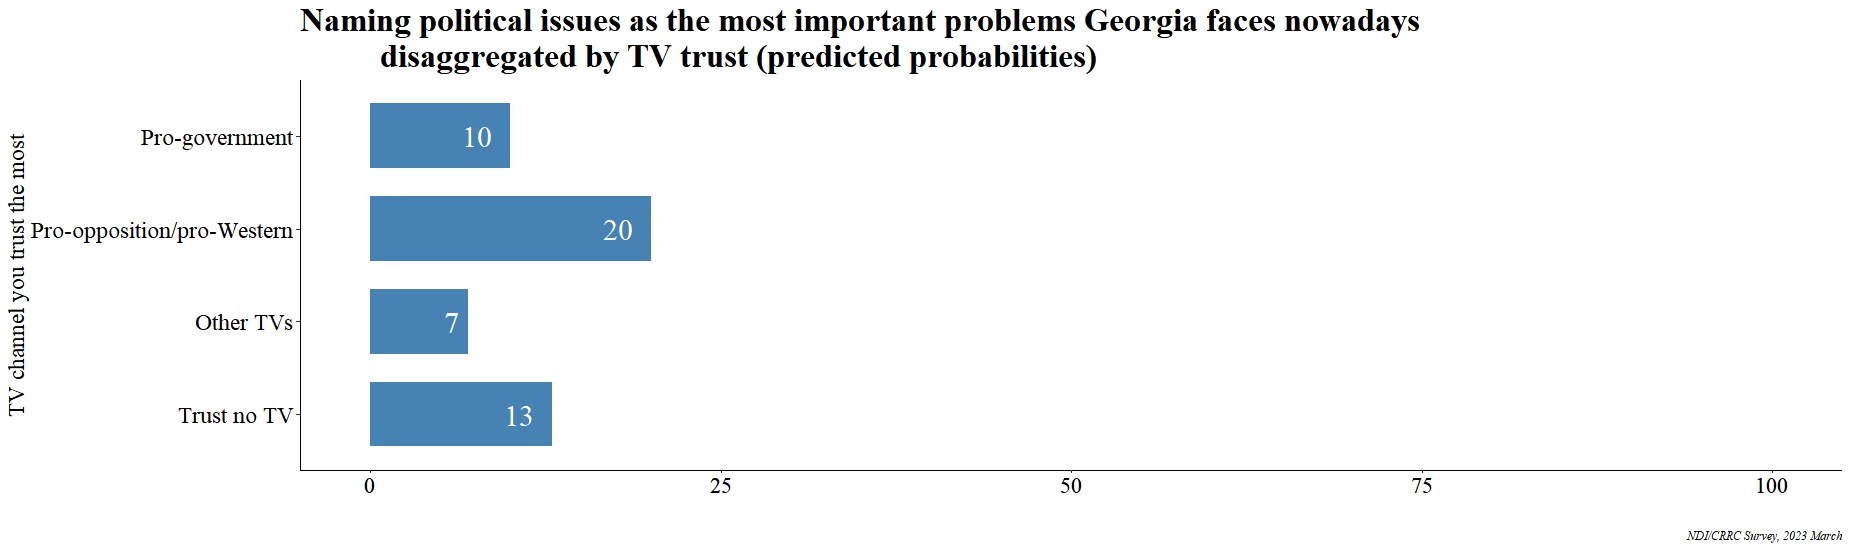
Similar patterns emerge regarding what issues people consider to be priorities in Georgia.

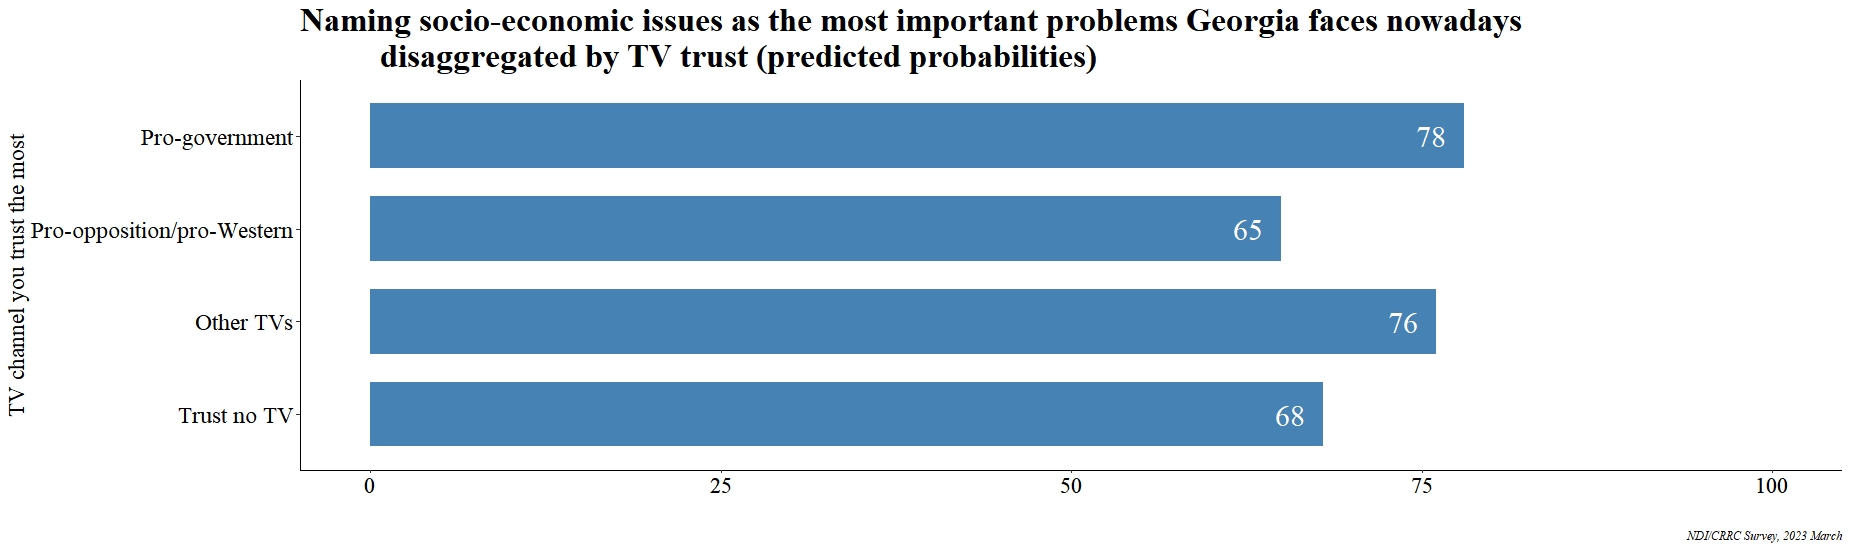
All else being equal, people who trust pro-opposition TV channels are more likely to name political issues (free and fair elections, court systems, freedom of speech, media independence) and less likely to name socio-economic issues (rising prices, wages, pensions, jobs, poverty) as the most important problems that Georgia faces today than people who trust other TV channels (pro-government and non-affiliated media).

Georgians that trust pro-opposition TV channels are 10 percentage points more likely than people who trust pro-government media and 13 percentage points more likely than people who trust other TV channels to name political issues as the most pressing problems that the country is facing.
Georgians
 
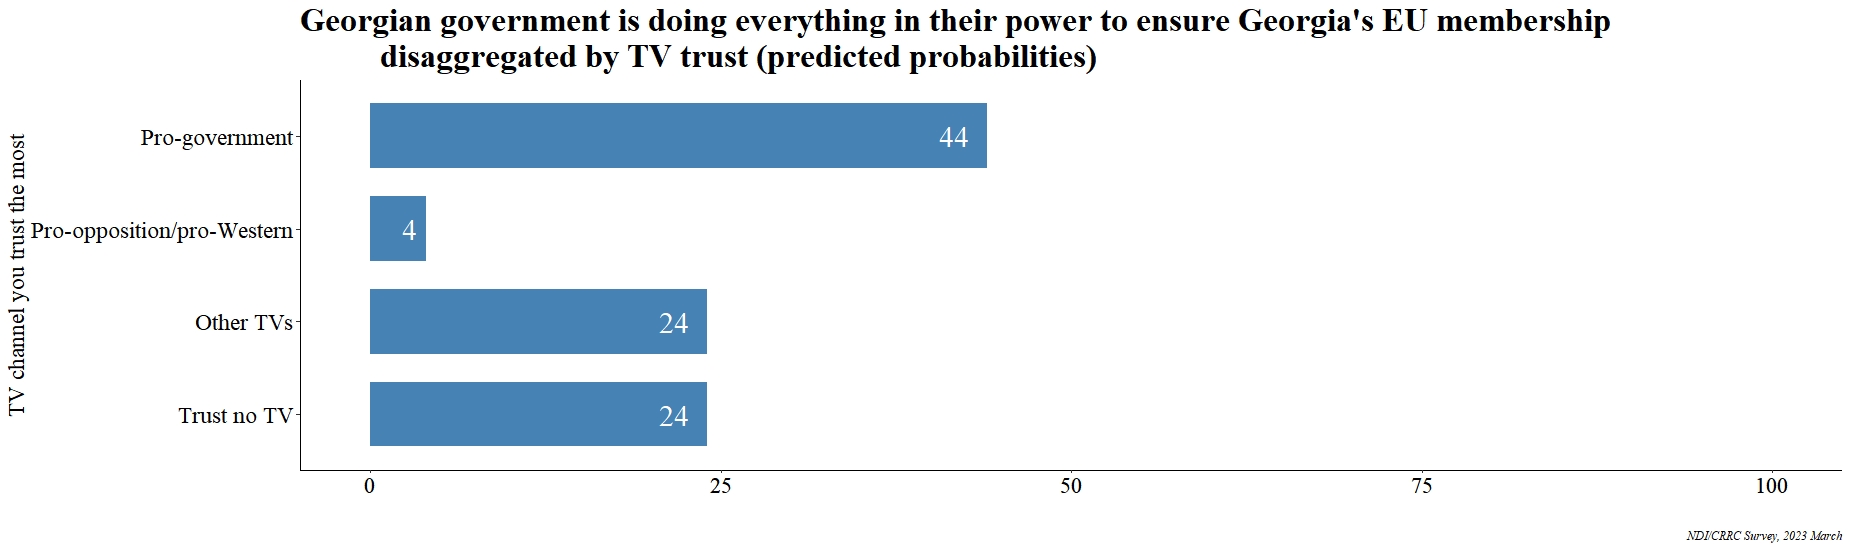
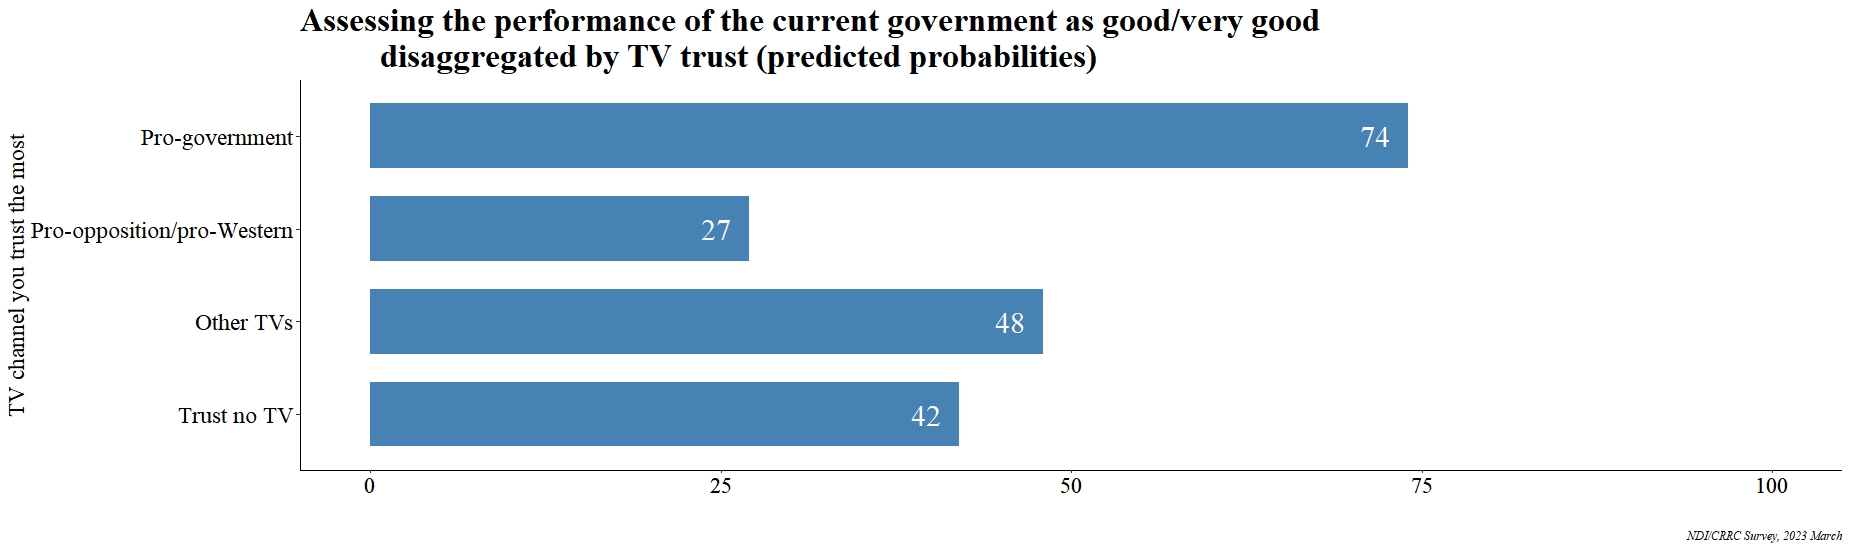
Georgians who trust pro-government media tend to assess the government's performance positively, both broadly, and more specifically in terms of Georgia’s efforts at integrating into the European Union, while people who trust other TV channels or trust no TV at all tend to be more critical.

After controlling for other factors, people who trust pro-government media are 40 percentage points more likely than people who trust pro-opposition media to report that the government is doing everything in its power to ensure Georgia’s EU membership. Similarly, they are 20 percentage points more likely to say the same in comparison to people who trust other media or no media at all.


All else being equal, people who trust pro-government TV channels have a 74% chance of assessing the current government’s performance positively, versus 27% for those who trust pro-opposition media. As with other issues, people who trust non-partisan TV channels and people who do not trust any TV channel at all are somewhere in between.


The above analysis is correlational rather than causal, so cannot identify causal effects of trusting or viewing partisan TV channels. However, it is evident that people who trust explicitly pro-government and pro-opposition TV channels view things differently. This association between trust in TV channels and public attitudes holds true even after controlling for partisan identification, suggesting that TV might play an important and independent role in shaping politically polarised segments of Georgian society.

Note: The above data analysis is based on logistic and multinomial regression models which included the following variables: age group (18-35, 35-55, 55+), sex (male or female), education (completed secondary/lower or incomplete higher education/higher), settlement type (capital, urban, rural), wealth (an additive index of ownership of 10 different items, a proxy variable), party identification (Georgian Dream, Opposition, Not affiliated) and ethnicity (ethnic Georgian or ethnic minority).


The data used in this article is available here.

Tuesday, June 28, 2022

Knowing a queer person increases tolerance

Note: This article first appeared on the Caucasus Data Blog, a joint effort of CRRC Georgia and OC Media. It was written by Dustin Gilbreath, a Non-Resident Senior Fellow at CRRC-Georgia. The views presented in the article are of the author alone, and do not necessarily reflect the views of CRRC Georgia, the Council of Europe, or any related entity.

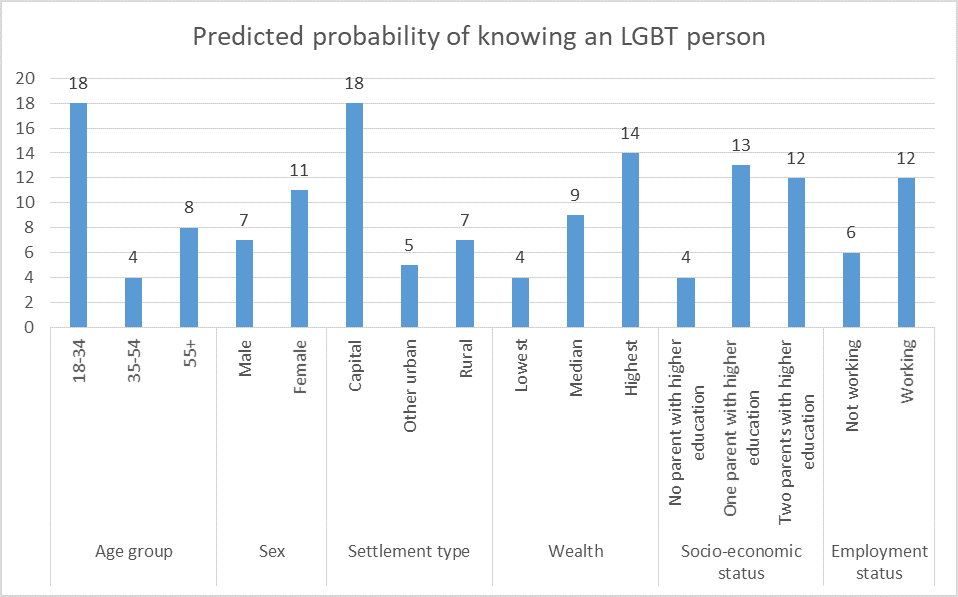
Overall, according to the survey —  which CRRC Georgia conducted for the Council of Europe —  8% of the public reported knowing an LGBT person, and 87% reported they did not. A further 5% were uncertain, and 1% refused to answer.

The data shows young people are significantly more likely to know an LGBT person. So are people in Tbilisi, wealthier people, people who are employed, and those with a higher socio-economic status. Women are slightly more likely to report knowing an LGBT person than men. Ethnic minorities, those with different levels of education, IDPs, and people with children in their household are no more or less likely to report knowing an LGBT person than ethnic Georgians, non-IDPs, and those without children in their households.

To understand whether people who know an LGBT person are also more tolerant of LGBT people in general, a matching analysis was conducted. This method identifies statistically similar people who know and do not know an LGBT person and then compares their attitudes. The goal is to understand whether knowing an LGBT person might also be associated with tolerance for LGBT people more broadly.

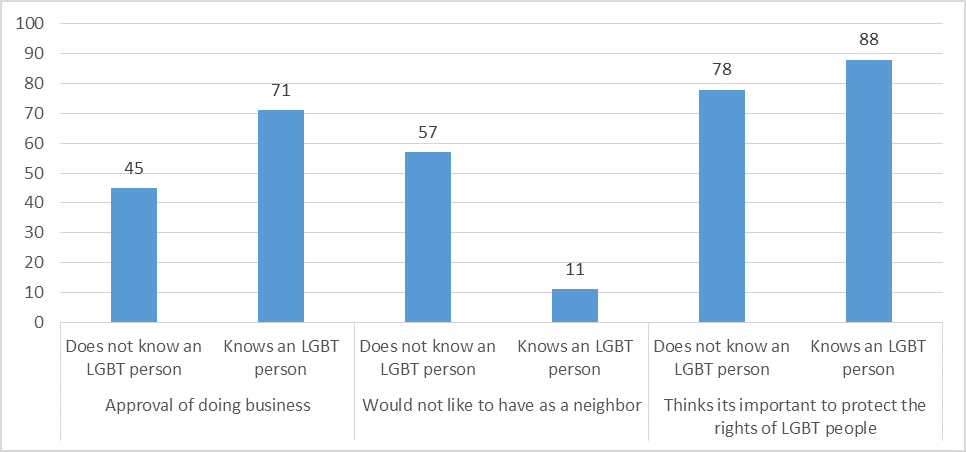
The analysis shows that people who know LGBT people are significantly more tolerant. 

People who know an LGBT person are 26 percentage points more likely to approve of someone like them doing business with a homosexual person, compared with those who have otherwise statistically similar demographic characteristics. They are 10 percentage points more likely to think it is important to protect the rights of LGBT people. People who know an LGBT person are 46 percentage points less likely to say they would not want an LGBT person as a neighbour.

The effect of knowing someone who is not a heterosexual varies significantly with a number of social and demographic characteristics with regard to approval of doing business and approval of having an LGBT neighbour. However, it does not vary with regard to views on the importance of protecting the rights of LGBT people.

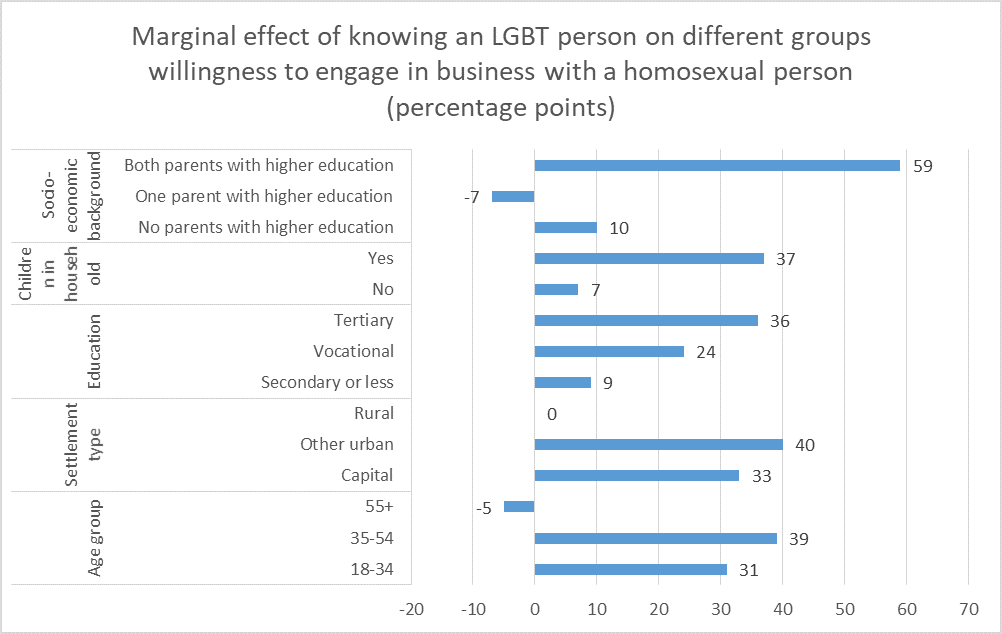
With regard to acceptance of doing business, the effect of knowing someone varies by age, settlement, wealth, socio-economic background, and whether or not a person lives in a household with children. 

The data shows that the effect of knowing an LGBT person is particularly large for people with children at 37 percentage points, compared to only 7 percentage points for people without children.

The data also indicates that there is no effect in rural areas, while there are substantively large effects in urban areas. 

The effect is also null for older people. By comparison, for people under the age of 54, the effect is rather larger at 39 percentage points for 35 to 54-year-olds and 31 percentage points for 18 to 34-year-olds.

The more education a person has, the greater the effect of knowing an LGBT person on their attitudes.

The data further shows that the effect is substantially larger for people from richer socio-economic backgrounds. To proxy people’s socio-economic backgrounds, the respondent’s parents’ education levels are considered, a common approach to understanding someone’s family background. 

The effect of knowing someone is substantial if both of the respondent’s parents had higher education. In contrast, people with one or no parents with higher education experience little effect from knowing an LGBT person.

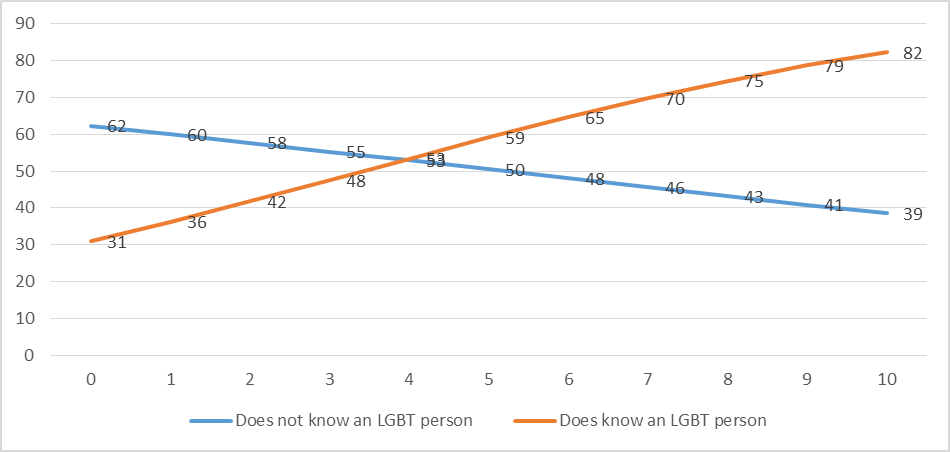
Current wealth also shows a striking pattern with regard to the impact of knowing an LGBT person. People living in poorer households are significantly less likely to approve of someone like them doing business with a homosexual if they know an LGBT person. In contrast, people living in wealthy households are significantly more likely to approve of someone like them doing business with a homosexual if they know an LGBT person.

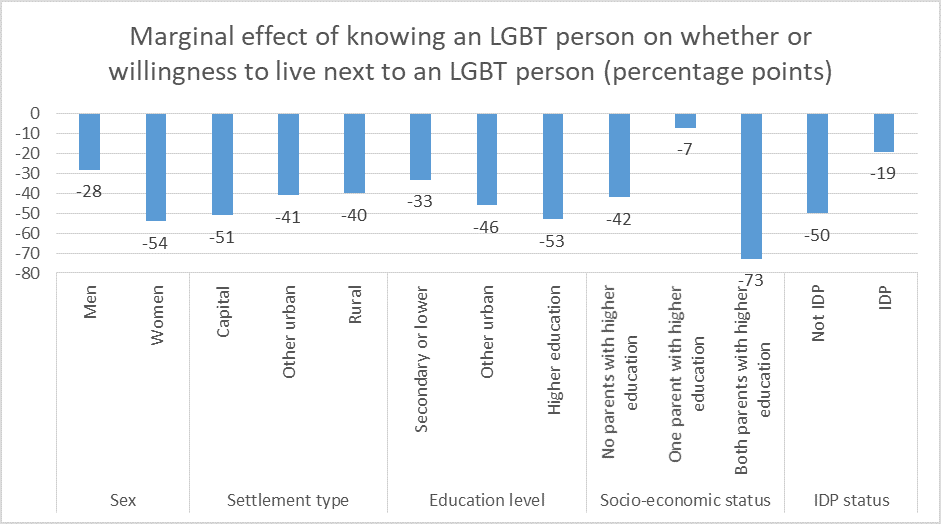
The size of the effect of knowing an LGBT person on willingness to live next to an LGBT person also varies with an individual’s sex, the settlement type they live in, their education level, whether or not they are an IDP, and their socio-economic status.

The effect is substantially larger for women than men (54 percentage points versus 28). The effect is larger in Tbilisi compared with other urban areas and rural areas. The effect is also larger for people with higher education and smaller for IDPs.

With regard to socio-economic status, the data shows that the effect is largest again for people with two parents that had higher education. People without parents that have higher education also experience a large effect. However, people with only one parent with higher education show no significant effect as a result of knowing someone who is LGBT on their willingness to live next to an LGBT person.

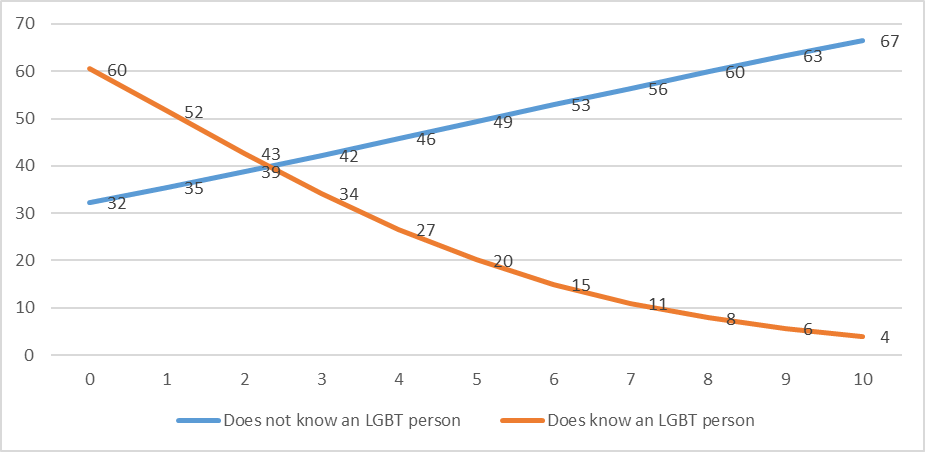
The data paint a similar picture of the effects on people in poorer and wealthier households of knowing an LGBT person on willingness to live next to an LGBT person. People in relatively well-off households are significantly more likely to be willing to live next to an LGBT person if they also know one. The reverse is true of people in poorer households.

In contrast to the willingness to do business with and to live next to an LGBT person, there were no significant variations in the size of the effect of knowing an LGBT person on different social and economic groups. 

The above data calls for further research. While on average there are statistically significant and substantially large effects of knowing an LGBT person on average, the effects vary significantly between groups. People living in wealthy households and from relatively better-off backgrounds appear to respond strongest to knowing an LGBT person. Other groups also experience substantial impacts from meeting LGBT people. However, these tend to be relatively small. Future research should aim to understand the causal mechanism by which these impacts could take place.

Tuesday, June 21, 2022

Despite the war, Georgians differentiate Russia and Russians

Note: This article first appeared on the Caucasus Data Blog, a joint effort of CRRC Georgia and OC Media. It was written by Elene Ergeshidze, a Researcher at CRRC-Georgia, and Nino Mzhavanadze, an Independent Researcher. The views presented in the article are of the authors alone, and do not necessarily reflect the views of CRRC Georgia, or any related entity.

After Russia’s invasion of Ukraine, a large-scale migration of Russians to Georgia led to a debate in Georgian society. 

Many perceived the rising number of Russians entering Georgia as a security threat, and a majority wanted visa restrictions to be introduced for Russian citizens. Others empathised with Russians fleeing Putin’s Russia. 

In this context, there were widespread concerns about anti-Russian sentiment and the potential for hate crime and hate speech against Russians in Georgia. 

[Read on OC Media: Russian émigrés face chilly reception in Georgia]

Despite the concerns, data from CRRC and NDI’s polling from March 2022 shows that a majority of Georgians have a positive attitude towards Russian people and a negative attitude towards the Russian state. This maintains a pattern of public opinion that has been present in most surveys which CRRC Georgia has conducted which allow an exploration of the issue, including in multiple waves of the Caucasus Barometer survey and more recently a survey on foreign policy which CRRC conducted for the Georgian Foundation for Strategic and International Studies. 

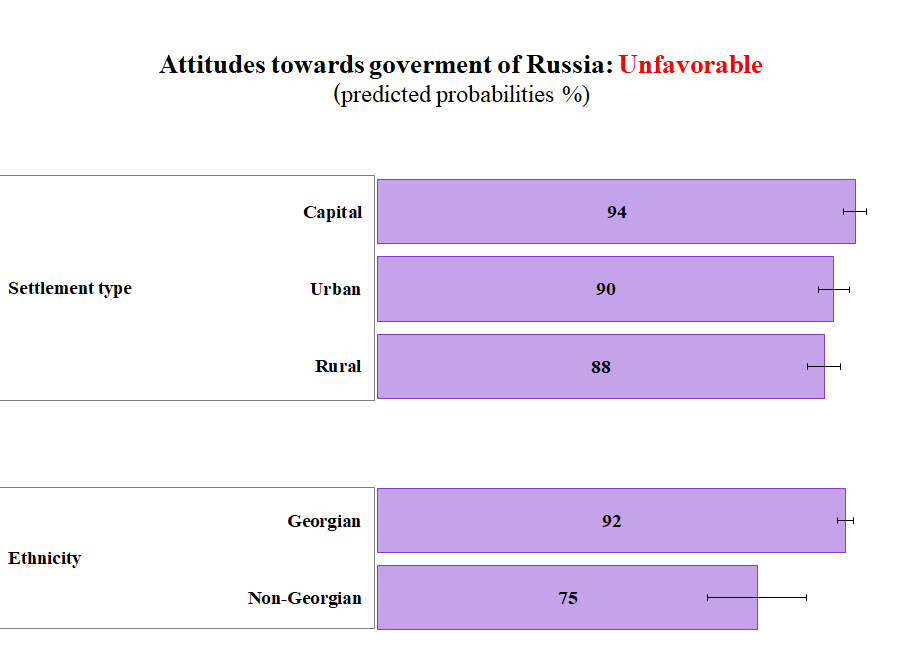
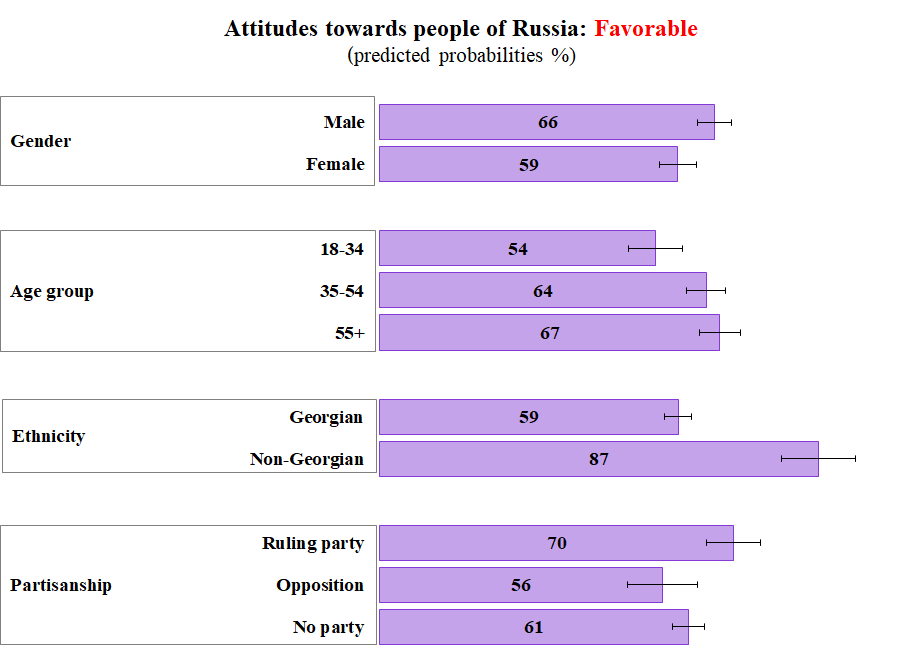
On the March 2022 CRRC and NDI survey, a majority of Georgians (85%) reported an unfavourable attitude towards the Russian government. A majority (59%) also reported a positive attitude towards Russian people. 

Further analysis suggests that settlement type and ethnicity are correlated with holding unfavourable attitudes towards the Russian government. 

People in Tbilisi were six percentage points more likely to have unfavourable attitudes towards the Russian Government compared to people living in rural areas. Ethnic Georgians were seven percentage points more likely to express unfavourable attitudes towards the Government of Russia than ethnic minorities. 

Note: These charts were generated from a regression model. The model includes gender (male, female), age group (18–34, 35–54, 55+), settlement type (capital, urban, rural), education (secondary or lower, secondary technical, tertiary), ethnicity (Georgian, ethnic minority), party respondent names as closest to his/her views (Georgian Dream, opposition party, did not name a party (Don’t know, Refuse to answer, No party)), and an additive index of ownership of different items, a common proxy for wealth.

Analysis shows that favourable attitudes towards Russian people also vary across demographic groups. 

Men were seven percentage points more likely to express favourable attitudes towards Russians compared to women. People over the age of 35 held more positive attitudes towards Russian people. Ethnic minorities living in Georgia were 28 percentage points more likely to report favourable attitudes than ethnic Georgians. Supporters of the ruling party were 14 and 9 percentage points more likely to hold favourable attitudes towards Russian people compared to opposition supporters and those who do not support any party, respectively. 

Note: These charts were generated from a regression model. The model includes gender (male, female), age group (18–34, 35–54, 55+), settlement type (capital, urban, rural), education (secondary or lower, secondary technical, tertiary), ethnicity (Georgian, ethnic minority), party respondent names as closest to his/her views (Georgian Dream, opposition party, did not name a party (Don’t know, Refuse to answer, No party)), and an additive index of ownership of different items, a common proxy for wealth.

While there was widespread discussion about whether the Georgian public would become more hostile to Russian people following the war in Ukraine and large-scale Russian migration to Georgia, the data shows that people have maintained a distinction between Russia and Russians, with negative attitudes towards the former and positive attitudes towards the latter. 

Tuesday, November 03, 2020

Conservative gender mores are changing in Georgia

Note: This article first appeared on the Caucasus Data Blog, a joint effort of CRRC Georgia and OC Media. The article was written by Otto Saladze, a junior researcher at CRRC Georgia. The views presented in the article do not represent the views of CRRC Georgia or any related entity.

Gendered norms prevail in Georgian society, which often translates into deprecation of women for smoking, drinking alcohol, having pre-marital sex, and even living with a boyfriend. However, attitudes appear to be shifting.

CRRC’s Caucasus Barometer survey asked people what they thought about several such activities. The data showed that the public are least accepting of women smoking, with 80% reporting it is never acceptable at any age. Sexual relations (63%) and cohabitating with a man before marriage were also commonly thought to be never acceptable for women (60%). 

Although there are still widespread prejudices about what is acceptable for women, some attitudes are changing. While in 2010, a slight majority (56%) said they were against women living separately from their parents before marriage at any age, this number had decreased by 18 percentage points by 2019 to 38%. 

In 2019, half of the respondents reported that women aged 18–25 should be able to live separately before marriage, compared to only 31% in 2010.  

In 2010, 80% said it was unacceptable for women to have sex before marriage at any age. In 2019, this number decreased by 17 percentage points, with 63% now against it. 

In 2019, 24% said it was acceptable for women aged 18–25 to have sex outside of marriage, 16 percentage points more than a decade ago (8%).  

However, people’s attitudes do not appear to have changed over the last decade towards women smoking and drinking strong alcohol.

Note: The original question text was: ‘Sometimes people are considered too young to do or experience certain things. Could you please tell me, from what age do you think it is acceptable for a woman to…’ Respondents were then asked about multiple activities. To ensure clear data visualisation, the answer options: ‘Under 18’, ‘18-25’, ‘26+’ and ‘Don’t know/Refuse to answer’, are not shown on the chart.  

There were only slight differences in the opinions of women and men on these issues, and attitudes have changed at similar paces among both sexes.

While 52% of men said it was never acceptable for women to drink strong alcohol, 59% of women reported the same in 2019. The numbers were almost the opposite a decade ago, with 59% of men saying it was never acceptable in 2010 and 55% of women. 

Both sexes’ attitudes changed regarding pre-marital sex and co-habitation at a similar rate. The share of men thinking pre-marital sex was unacceptable for women at any age decreased from 81% to 62% between 2019 and 2010, and among women the decline is similar (80% to 64%). In 2019, 58% of men and 61% of women were against cohabitation prior to marriage at any age compared with 71% of men and 73% of women in 2010. 

A similar pattern holds among people of different ages, with changes being quite similar in most age groups. One exception is attitudes towards pre-marital sex. While in 2010, 76% of 18-35-year-olds said this was never acceptable for a woman, in 2019 only 52% of young people reported the same, a 24 percentage point decline.  By comparison, the decline in disapproval among 35-54-year-olds was 17% and by 11% among those 55+.

People still judge women for a wide range of different behaviors in society, but attitudes are changing. Over the last decade, it appears that people have become more accepting of women’s choices regarding pre-marital sex and cohabiting out of wedlock. 


Monday, December 09, 2019

Optimism Regarding EU membership is decreasing

Georgia is not a candidate for membership in the European Union (EU), but the government has the stated goal of joining the EU when the country is ready for it. According to the Knowledge of and Attitudes towards the EU in Georgia survey (EU Survey) CRRC-Georgia conducted in spring 2019 for Europe Foundation, 71% of the population of Georgia would vote for EU membership if a referendum were held tomorrow. Only 10% would vote against it and 7% would not vote at all. While support for joining the EU is clearly high, people are increasingly pessimistic about how long it will take Georgia to join.

Since 2009, the EU Survey has asked respondents, “When will Georgia join the EU, in 5 years or less, in 6-10 years, in more than 10 years, or never?”  The chart below shows that optimism regarding joining the EU is declining. Respondents who think that Georgia will join the EU in 5 years or less has declined from 30% in 2009 to 15% in 2019. Furthermore, the share of respondents who think that Georgia will join the EU in more than 10 years and those who think that Georgia will never join the EU has increased from 10% in 2009 to 19% in 2019 and 1% in 2009 and 11% in 2019, respectively. Consequently, the data suggest that optimism on this issue is on the decline.


To understand the current situation, further analysis of the 2019 wave of the EU survey was conducted. The analyses shows sex, age, settlement type, and education level are associated with people’s outlooks. Generally, people older than 55 are less likely to be optimistic regarding Georgia joining the EU than people from 18 to 35 years old. Female respondents are less pessimistic compared to male respondents.

Aside from demographics, party preferences could also reasonably be tied to people’s expectations as positive assessments about a number of issues are tied to whether or not people support the party in power (e.g. see here and here). The data suggest that people who report not knowing or refuse to answer the question about the party closest to them are less optimistic than GD Supporters. UNM, Alliance of Patriots Supporters, and supporters of no party are also more pessimistic than GD supporters.


Note: On the above chart, base categories for each variable are as follows: male, 18-34 age group, Rural, Georgian ethnicity, higher than secondary education, and Georgian Dream supporter. The category “No party” consists of individuals that responded none when asked which party was closest to them. The category “other party” consists of individuals who named other parties not categorized above. 

Optimism over Georgia joining the EU is declining, and this decline started after 2013. People older than 55, people who support no party, the Alliance of Patriots of Georgia, and UNM supporters are more pessimistic regarding this issue than GD supporters.

Note: The above analysis is based on a multinomial logistic regression analysis, where the dependent variable is optimism over Georgia joining the EU which is measured through the question “When will Georgia join the EU?” The independent variables are party support, gender, age group, ethnicity, settlement type, and education. The data used in the blog is available here. Replication code of the above data analysis is available here.

Monday, November 18, 2019

Knowledge of visa-free requirements falls since launch of scheme

Georgian citizens have been able to travel visa free within the Schengen zone for approaching three years, the result of several years of complex dialogue and policy reform. Despite the elapsed time, and a major EU-funded public information campaign, the results of the 2019 Survey on Knowledge of and Attitudes towards the European Union in Georgia (EU Survey) suggest that public knowledge of requirements for visa free travel have fallen since the scheme launched. Similarly, the same period has seen a large rise in the number of Georgian citizens being denied entry to EU countries, with Eurostat reporting over four thousand such cases in 2018 alone, up over a third since 2017.

For a Georgian citizen to enter the Schengen zone under the visa-free regime, the following documents are required:

  • A biometric passport;
  • Proof of financial means to cover expenses;
  • A return ticket;
  • Proof of address during stay (for example a hotel reservation).
Additionally, stays may not exceed 90 days in any 180-day period, and visitors under the visa free regime are not allowed to work.

In both the 2017 and 2019 waves of the EU survey, respondents were asked about their knowledge of requirements for documentation, length of stay, and right to work. The data suggest a marked decline in areas of knowledge asked about aside from the requirement for a biometric passport and the duration of stay. Falls were seen in awareness of the need for proof of address during the stay, proof of financial means to cover expenses, and a return ticket. In addition, there was a steep decline in knowledge of whether or not one can work during a stay.


To better understand who is more and less aware of the above requirements, a simple additive index describing an individual’s overall understanding of the EU requirements outlined above was developed. Correct responses to the above questions are counted as one point, resulting in knowledge scale from 0-6, with a score of zero representing no correct responses and six representing fully correct responses. Overall, across both waves, less than one percent of respondents answered all six questions correctly, with 13% answering none correctly. The average score on the index decreased from 2.6 in 2017 to 2.2 in 2019.

Scores on the index in 2019 are associated with the sex, age, ethnicity, employment status, education level, and internet use. After accounting for other factors, there is no significant differences in awareness between people living in Tbilisi, other urban areas, and rural areas. Younger people, men, people with tertiary education or higher, ethnic Georgians, the employed, and regular internet users are more likely to have better knowledge of the requirements for visa free travel on average, all else equal. By far the largest observed difference was for ethnic minorities, who are predicted to score one point lower on the knowledge index than ethnic Georgians.


This pattern is reflected in minorities reporting lower levels of awareness across all questions asked, except travel insurance. For example, 56% of ethnic minority respondents knew about the need for a biometric passport compared to 81% of Georgians survey – a 35 percentage point difference. Similarly large differences between Georgian and minority respondents were observed in correct responses relating to the right to work and financial requirements for entry, with minority respondents as a group respectively scoring 17 and 14 percentage points lower than their ethnic Georgian counterparts.


Although ethnic minorities are consistently less aware of visa free regulations, the overall decline in awareness appears to be driven by a fall among ethnic Georgian respondents. Between 2017 and 2019, there is a rise along some dimensions of knowledge of the requirements reported by ethnic minority groups. However correct responses from ethnic Georgian respondents have fallen in three of the six domains asked about.


While knowledge is lower among ethnic minorities, their knowledge has increased between waves of the survey along some dimensions. In contrast, awareness of the rules of visa free travel have been on the decline among the ethnic Georgian population.

With the available data, it is not possible to identify the source of the higher baseline (2017) scores for ethnic Georgian respondents vis-à-vis ethnic minorities, nor the driving factors behind their divergent changes over the past two years. This noted, this pattern would be consistent with the hypothesis that previous information campaigns may have been more effective in reaching ethnic Georgians than minority groups, and that public awareness has slipped as this issue has fallen from national headlines.

Substantial numbers of Georgian citizens have been denied entry to the EU since the introduction of visa-free travel, a process which generates significant financial costs and personal distress for the individuals concerned. In this context, it is concerning that the Georgian public’s knowledge of requirements for visa-free travel to Schengen zone countries has fallen since 2017 – suggesting a need for renewed messaging around the details of the scheme.

Furthermore, whilst there are some differences between knowledge across many demographic categories, ethnic minority groups display substantially lower knowledge than any other group. As such, for any renewed information campaign to be effective, it should take concrete steps to ensure the inclusion of ethnic minority groups.

Note: The data presented in the above blog post is available here. Replication code for the regression analysis is available here.

Monday, August 26, 2019

Attitudes toward politicians are related to evaluations of institutional performance

How citizens evaluate the performance of the state is often a reasonable proxy for its performance. In Georgia, evaluations of public institutions are mixed. While a number of social and demographic variables are associated with people’s perceptions of state performance, so too are people’s attitudes towards political parties and politicians. This shows once again how politics is personalized in Georgia.

The 2019 April CRRC/NDI data suggests that social and-demographic characteristics, including settlement type, ethnicity, and age are associated with perceptions of state performance. Ethnic minorities and rural residents tend to evaluate public institutional performance higher than ethnic Georgians or urban dwellers. In addition, young Georgians think public institutions perform well more often than older people.

Besides demographics, attitudes toward politicians are associated with attitudes towards institutional performance.  Positive attitudes towards Georgian Dream politicians are associated with more positive assessments of government performance. Interestingly, the same holds for attitudes towards opposition politicians, albeit to a weaker degree.


Note: An ordinary least squares regression model was used to generate the above chart. To measure the population’s attitudes toward institutional performance a public institutions evaluation index was created based on assessments of the following public entities: the current government, Sakrebulo (local councils), Parliament, Courts, Georgian Army, Georgian Police, Office of the ombudsman, Office of the Chief Prosecutor, and Public Service Halls. Attitudes towards the government and opposition affiliated politicians index are measured based on attitudes toward individual politicians asked about in the questionnaire. The regression model also included the following co-variates: Which party is closest to you? (First choice); intention to vote in the parliamentary elections; main sources of information; education level; employment status; age; gender; ethnicity, asset ownership index and settlement type. 

Partisanship also matters. Georgian Dream supporters evaluate institutional performance more positively than United National Movement or other opposition party supporters do.


While partisanship matters, attitudes towards government affiliated politicians still matter despite party affiliation when it comes to evaluation of public institutions. When supporters of different parties have positive attitudes towards GD politicians, they are more likely to evaluate government performance positively no matter what party they support.


Evaluations of public institutions are linked to how citizens see politicians. The more positive are people’s attitudes towards politicians, the more positive they are about institutional performance. This holds no matter the party of a given politician. However, partisanship still matters, with opposition supporters less positive about government performance than supporters of the Georgian Dream. Taking both of these factors together, suggests that attitudes toward government affiliated politicians is more important however.  Taken together, this suggests that institutional performance assessments in Georgia remain tied to personality.


Monday, July 15, 2019

The direction Georgia’s headed in

The most recent NDI polling showed a decline in the direction the country was heading. Though not the direct cause by any means, the growing sense that Georgia is going in the wrong direction was likely an enabling factor for the protests that erupted in June and have continued through July in Tbilisi. The CRRC-NDI survey has tracked the direction people think the country is headed over the last decade. While numerous factors affect people’s perceptions of where the country is going, a number of events including elections and the devaluation of the Georgian Lari against the US Dollar appear to show up in CRRC-Georgia and the National Democratic Institute’s data. This blog provides an overview of how views of the direction the country is headed in have changed over time.

In 2009, 40% of Georgians reported that the country was going into the right direction. Attitudes improved from this period to February 2012 when it reached the highest recorded share of positive response on the survey. Attitudes dipped slightly afterward, but remained generally positive, until there was a sharp rise in people reporting that the country was not changing in June 2013. This was a period of relatively tense co-habitation between then President Mikheil Saakasvhili and the newly in office Georgian Dream coalition. It was also the start of the pre-electoral period for the presidential race which resulted in Giorgi Margvelashvili winning the elections. In the November 2013 survey, immediately following Margvelashvili’s electoral victory, there was a spike in people saying the country was headed in the right direction and a drop in people reporting that the country was not changing and saying it was going in the wrong direction.


While attitudes shot up following Margvelashvili’s electoral victory, optimism was short-lived. In the wave of survey after the pre-electoral one, attitudes returned to levels comparable to prior to Margvelashvili’s electoral victory. In the subsequent wave of the survey, attitudes were similar, and then experienced a precipitous decline between August 2014 and April 2015. Not only was there a decline in positive attitudes, but also a sharp increase in the number of people reporting that the country was going in the wrong direction. One likely contributor to this rise in pessimism is the devaluation of the Georgian Lari, which started in October 2014 and continued during this period. Notably, this was the first time that the survey had recorded more people having negative than positive outlooks for the country in the history of the survey.

Between March and November 2016, attitudes recovered to a certain extent though similar shares of people reported that the country was not changing, going in the wrong direction, and going in the right direction. This recovery might be associated with the 2016 elections as negative attitudes peaked as elections approached and then become less negative after elections.

In June 2018, during the pre-electoral period for the presidential race, more people started to report that the country was not changing and fewer reported that it was going in the right direction. Attitudes recovered following the elections in December 2018. However, in the most recent CRRC-NDI survey in April 2019 attitudes became more negative.

Public opinion on the direction of the country has become increasingly pessimistic over the last ten year. The public mood often declines prior to and improves after elections. However, this recovery does not last long. Besides elections, the devaluation of the Georgian Lari appears to have led to a precipitous decline in people’s outlooks for the country. There are surely many other causes of changes, but these do stand out as plausible explanations for some of the larger shifts shown above.

The data used in this article is available from CRRC-Georgia’s Online Data Analysis tool.

Monday, July 02, 2018

The population of Tbilisi on street dogs

Street dogs are a common sight on the streets of Tbilisi. How do people’s attitudes towards them vary by age, gender, and whether or not someone lives in the center or outskirts of the city? Results of a November 2017 phone survey CRRC-Georgia carried out for a British charity Mayhew provide some answers to these questions.

Forty per cent of Tbilisi’s population reported positive attitudes towards street dogs, 39% neutral, and 20% negative. Women and men and people in central and non-central neighborhoods of Tbilisi report positive and negative attitudes at similar rates. People over the age of 56 report negative attitudes slightly more often than people under this age.


Why do the 20% of the population who report negative attitudes not like street dogs? Their majority (67%, although margins of error are higher for this relatively smaller subgroup) report a “general fear of dogs” as the main reason. The data suggests that women fear dogs more than men, which is not a finding unique to Tbilisi. Research from other contexts (e.g. see here and here) also indicates that women in general are more likely to report fearing dogs than men.

To explore the data in this blog post, visit our Online Data Analysis portal.

Monday, October 16, 2017

Visa liberalization: How much do people in Georgia know about the conditions of visa-free travel to the EU?

CRRC’s previous blog posts have shown that the population of Georgia had rather moderate expectations of the recent visa liberalization with the Schengen zone countries, especially when it comes to the question of how much ordinary people will benefit from it. Europe Foundation’s latest survey on Knowledge of and Attitudes towards the European Union in Georgia, conducted in May 2017, provides a more nuanced understanding on how people in Georgia feel about this process and to what extent they are familiar with the conditions of visa liberalization.

In May 2017, only about 1% of the population of Georgia reported having not heard of visa liberalization. A majority, 64%, reported being glad to have the possibility to travel to the Schengen zone countries visa free, although only 16% believed they personally would take advantage of the visa-free regime in the next 12 months. About a third of the population said visa liberalization did not matter for them, and a rather small minority (4%) reported not being glad about visa liberalization.

Five major conditions have to be met by Georgian citizens to enjoy visa-free travel: they should be able to provide a return ticket, travel insurance, proof of financial means to cover their trip expenses, the address where they will be staying during the trip (a hotel reservation or the address of people inviting him/her) and hold a biometric passport. The Georgian government has implemented a large-scale information campaign to spread information about the conditions of visa liberalization as widely as possible. In order to learn how effective this campaign was, the survey included an open question, “Which are the documents that a Georgian citizen needs in order to travel to the Schengen zone countries visa-free?”

According to the findings, people best remembered the requirement of having a biometric passport – 78% named this condition of visa-free travel. Much smaller shares remembered the other conditions: 45% named financial means, 40% a return ticket, 34% the address where a traveler will be staying during the trip, and only 24% named travel insurance. Understandably, those planning to travel to the Schengen zone in the next 12 months demonstrated a better knowledge of the conditions of visa-free travel. However, the differences were not impressive, especially taking into consideration the small size of this group and thus a relatively larger margin of error.

Overall, only 12% of the population named all these conditions during the survey. Rather surprisingly, the rural population and those living in urban settlements outside the capital “scored” better in this exercise compared to the population of the capital and ethnic minority settlements. On the other hand, 18% failed to name any of the five conditions of visa-free travel. The population of ethnic minority settlements demonstrated the poorest knowledge.

Importantly, as of May 2017, a quarter of the population of Georgia mistakenly believed that as a result of the visa-free regime, Georgian citizens obtained permission to work in the EU. The share increases to 34% among those who say they will travel to a Schengen zone country in the next 12 months. Thus, a preliminary look at the findings about knowledge of the conditions of visa liberalization for Georgian citizens suggests that the information campaign needs to expand, and become more intense and targeted to potential travelers.

The datasets and findings of all waves of Europe Foundation’s survey on Knowledge of and Attitudes towards the European Union in Georgia are available on CRRC’s online data analysis platform. A report focused on the 2017 data is available here.

Saturday, September 09, 2017

Attitudes towards immigrants in Georgia, and how they differ based on a person’s economic situation

A recent protest in Tbilisi was a reminder of the importance of studying attitudes towards immigrants in Georgia. A previous blog post discussed how these attitudes vary based on whether a person has or has not had personal contact with immigrants. This blog post explores how attitudes towards immigrants differ based on whether people believe or not that immigrants will contribute to the economic development of Georgia, and how they describe their households’ economic condition compared to the households around them, using CRRC’s 2015 Caucasus Barometer survey (CB) data. “Immigrants” was operationalized in the questionnaire as “foreigners who come to Georgia and stay here for longer than three months.”

A plurality of the population of Georgia (45%) report that immigrants will sometimes contribute to the country’s economic development and sometimes not. About one in five (22%) think that immigrants will contribute to the economic development of Georgia, and 18% think the opposite. Among those who think that immigrants will contribute to the economic development of Georgia, 50% report positive attitudes towards them. However, when people think that immigrants sometimes will and sometimes will not contribute to the economic development of Georgia or when they think immigrants will not contribute to it, they generally report neutral attitudes towards immigrants. Notably, among those who believe that immigrants will not contribute to the economic development of Georgia, 17% report negative attitudes towards them, which is the highest share of negative attitudes reported.


Note: For the question, “How would you characterize your attitude towards the foreigners who come to Georgia and stay here for longer than 3 months?” the original 5-point scale (1 – ‘Very bad’, 2 – ‘Bad’, 3 – ‘Neutral’, 4 – ‘Good’, 5 – ‘Very good’) was re-coded into a 3-point scale, with codes 1 and 2 labeled “Bad attitude” and codes 4 and 5 labeled “Good attitude” on the charts in this blog post. Answer options “Don’t know” and “Refuse to answer” are not shown and hence the percentages reported in the charts in this blog post may not sum to 100%.

Interestingly, the better a person’s assessment of their household’s relative economic condition, the better attitudes they report towards immigrants.


Note: For the question, “Relative to most of the households around you, would you describe the current economic condition of your household as …?” the original 5-point scale (1 – ‘Very poor’, 2 – ‘Poor’, 3 – ‘Fair’, 4 – ‘Good’, 5 – ‘Very good’) was re-coded into a 3-point scale, with codes 1 and 2 labeled “Poor” and codes 4 and 5 labeled “Good” on the chart above.

Overall, reported attitudes towards immigrants are rather neutral in Georgia. Importantly though, when people think that immigrants will contribute to the economic development of Georgia or consider the current economic condition of their households to be good, their attitudes tend to be more positive.

To have a closer look at the Caucasus Barometer data, visit CRRC’s Online Data Analysis tool.


Thursday, May 25, 2017

Who is more intelligent and sincere? CRRC interviewers’ assessments

It has been only about two decades since pollsters started using paradata, including interviewer assessments of the conducted interviews and respondents’ behavior and attitudes. Such assessments are collected in the process of most of CRRC-Georgia’s surveys. Immediately after each interview, interviewers are asked to assess various aspects of the interview, including respondents’ sincerity and intelligence. Using CRRC’s 2015 Caucasus Barometer (CB) data for Armenia and Georgia, this blog post explores how such assessments differ depending on respondents’ demographic characteristics and their households’ economic situations.

It is important to highlight that these assessments can hardly provide reliable information about the actual intelligence or sincerity of respondents, and there is no doubt that interviewers’ perceptions of intelligence are very subjective, thus they cannot be attributed to any objective characteristics. Still, when analyzed properly, they can tell us a lot about a wide range of issues, from the process of interviews to the dominant stereotypes and biases in a given society.

In the CB 2015 assessment forms, interviewers were asked to rate respondents’ intelligence. In both Armenia and Georgia, interviewers tend to rate the intelligence of people who live in the capital and other urban settlements higher than the intelligence of those who live in villages.


 Note: The original 5-point scale was recoded for the charts in this blog post, with answer options “Intelligent” and “Very intelligent” combined into the category “Intelligent” and answer options “Not at all intelligent” and “Not very intelligent” combined into the category “Not intelligent”. Responses “Don’t know” and “Refuse to answer” were excluded from the analysis in the charts in this blog post.

Although, overall the respondents are reported to be rather sincere during the interviews, interviewers report the answers of people living in the capital and other urban settlements to be slightly more sincere compared to the answers of people living in villages.

Note: The original 11-point scale was recoded for the charts in this blog post, with codes 0 through 3 combined into the category “Not sincere”, codes 4 through 6 combined into “Average” and codes 7 through 10 combined into the category “Sincere”. 

There are even more pronounced differences by respondents’ level of education. Interviewers rate people with a lower level of formal education both as less intelligent and sincere. In both countries, people who report having secondary technical education or secondary or lower education are twice as likely to be placed in the category “Average” than those with a higher than secondary education.
 Note: Answer options “No primary education”, “Primary education”, “Incomplete secondary education” and “Secondary education” were grouped into the category “Secondary or lower”; “Incomplete higher education”, “Completed higher education” and “Post-graduate degree” were grouped into the category “Higher than secondary”. 

In contrast to the assessments of intelligence, interviewers’ assessments of respondents’ sincerity vary less by the respondents’ level of education. Both these assessments, however, are very similar in Armenia and Georgia.


Interviewers’ assessments of respondents’ intelligence and sincerity also differ according to the reported economic situation of the respondent’s household. Interviewers tend to perceive those who are better-off economically as more intelligent. For example, interviewers report people living in households that can afford to buy expensive durables to be intelligent almost three times more often than people who do not have enough money for food, in both Armenia and Georgia.

Note: Answer options “We can afford to buy some expensive durables [like a refrigerator or washing machine]” and “We can afford to buy anything we need” were grouped into the category “Enough money for expensive durables”.

Those who report being in the best economic situation tend to be rated as sincere more often than people in all other groups.
Further research is needed to find out to what extent interviewer assessments reflect the actual situation, i.e. whether those who are better off, or urban dwellers, are actually more intelligent or sincere, and vice versa. The findings presented in this blog post show that interviewers have rather strong opinions about what groups of respondents are intelligent and sincere, and the assessments are very similar in Armenia and Georgia. Interestingly, there is a high positive correlation between the assessments of respondents’ intelligence and sincerity in both countries, suggesting another interesting topic for further research, namely, to what extent intelligence and sincerity are seen by interviewers as interrelated characteristics.

To find out more about CRRC’s Caucasus Barometer and other surveys, check out our online data analysis tool.