According to the March 2016 CRRC/TI-Georgia survey, roughly 4 in 10 households with school-aged children reported hiring a private tutor at the time of the survey for at least one subject that a child in their household was studying at school. Since the question was asked about private tutors for only subjects that pupil(s) were studying at school at the time of the fieldwork, the share of households that hire private tutors is likely higher than reported. This expectation is based on the fact that aptitude tests that are a required part of the university entrance exams for all applicants are not related to any specific school subject, yet, create a high demand for private tutoring. While, as has been noted before, private tutoring reflects economic inequalities in Georgian society, it also contributes to furthering these inequalities. This blog post looks at how the frequency of hiring private tutors in Georgia differs by settlement type and level of education of the interviewed household member.
Compared to other settlements, private tutoring is most widespread in Tbilisi. While 47% of Tbilisi households with school-aged children reported hiring a tutor for at least one school subject, only 32% of rural households reported the same.
Note: All charts in this blog post are based on the sub-sample of households with school-aged children (39% of all households). Thus, margins of error are higher for the reported findings. Answers “Don’t know” and “Refuse to answer” (less than 1% if combined) were excluded from the analysis.
How the person interviewed was related to the child(ren) of school age living in the same household was not recorded during the interviews. Thus, we do not know his or her role in decisions about the child(ren)’s education, and specifically the hiring of private tutors. Still, we look at their level of education as a proxy for the entire household.
In cases when the household member reported having higher than secondary education, the school-aged children living in his/her household were more likely to have private tutor(s), compared to when the household member reported having secondary technical or secondary and lower education. Higher levels of education are also associated with relatively higher incomes. Hence, households where higher levels of education are reported also are likely to have more resources to cover the costs of private tutoring.
Note: Answer options to the question “What is the highest level of education you have achieved to date?” were recorded in the following way: “Primary education”, “Incomplete secondary education”, and “Completed secondary education” were combined into the category “Secondary education or lower”. “Secondary technical education/vocational education” is labeled “Secondary technical education”. “Incomplete higher education”, “Completed higher education (BA, MA, or Specialist degree)”, and “Post-graduate degree” were combined into the category “Higher than secondary education”. Answers “Don’t know” and “Refuse to answer” (less than 5% if combined) were excluded from the analysis.
Reported private tutoring practices differ by a number of variables in Georgia. School children living in Tbilisi and in households where interviewed household members report higher levels of education tend to have private tutors more often compared to other children.
To have a closer look at the CRRC/TIG survey data, visit CRRC’s Online Data Analysis tool.
Monday, September 18, 2017
Private tutoring and inequality in Georgia

Monday, February 13, 2017
One in four in Georgia report taking antidepressants or antibiotics without a prescription
On a 2016 CRRC survey conducted for Transparency International Georgia (TIG), one in four adults in Georgia reported taking either antidepressants or antibiotics without a doctor’s prescription during the 12 months before the survey. Self-medication with anti-depressants can cause serious problems. While anti-depressants may have side-effects even when taken under the supervision of a physician, the risks are higher without a doctor’s care. Self-medication with antibiotics is also problematic. If taken improperly, they can contribute to the creation of antibiotic-resistant bacteria, which is often thought to be one of the world’s most pressing health problems. Surely, when a quarter of the population reports taking these types of drugs without the supervision of a physician, it represents a public health concern, one of many in Georgia. Current regulations clearly fail to prevent such practices. This blog post looks at which groups in the population report more often taking antidepressants or antibiotics to self-medicate.
Women are significantly more likely to report taking antibiotics or antidepressants without a doctor’s prescription compared to men. While 21% of men reported self-medicating with these kinds of pharmaceuticals the year before the survey, 30% of women did so. A simple cross tabulation suggests the problem is largest in rural settlements. Men in different settlement types are equally likely to report taking these drugs without a prescription, while women in rural settlements are most likely to report doing so.

At first glance, the older population (56 and older) in general appears more likely to take anti-depressants and antibiotics without a doctor’s prescription. Similar to the finding with settlement types, men of different ages are equally likely to do so, while women who are 36 years old or older report to be doing so most often.

The data which this blog post reports on will soon be available at our Online Data Analysis tool, and is currently available for download here.
Monday, May 11, 2015
Under surveillance: Public perceptions of safety while talking on the phone in Georgia
Illegal government surveillance is an issue which has been intensely debated in recent years in Georgia. Surveillance related legislation was adopted in 2010 and allowed law enforcement agencies to have unlimited access to telecommunication servers and hence to monitor everyone’s phone conversations at any time. Before 2012 Parliamentary elections, this legislation was criticized by the Georgian Dream Coalition (GDC) and was expected to be significantly altered after GDC came to power in 2012. This, however, did not happen, and the new surveillance law passed in 2014 did not change the situation much, allowing the Ministry of Internal Affairs to maintain direct and unlimited access to surveillance equipment.
A survey commissioned by Transparency International – Georgia (TIG) and conducted by CRRC-Georgia in 2013 included a number of questions about Georgians’ perceptions of privacy while talking on the phone. This blog post presents the results of this survey and shows that the majority of Georgians report restraining from sharing critical opinions about the government while talking on the phone, while a quarter of Georgia’s population believes that the government listens to everyone.
When asked, “In Georgia today, do you think or not that people like yourself have the right to openly say what they think?” 76% of Georgians answered “yes,” according to CRRC’s Caucasus Barometer survey in 2013. However, when the TIG survey asked, “Would you share a critical opinion about current political events in Georgia with a friend over the phone?” 69% of Georgians answered negatively. Importantly, similar attitudes were recorded when the question was asked about sharing a personal secret with a friend, which demonstrates that Georgians do not feel comfortable or safe talking on the phone, and, generally, do not consider phones a secure means of communication, irrespective of the topic they are discussing.

The results presented in the chart above are hardly surprising, taking into consideration that a quarter of the population reports that they believe the government listens to everyone’s phone conversations, and a further 39% answer “Don’t know” or “Refuse to answer” – an extremely large share, suggesting that people didn’t feel comfortable answering this question.
In addition, 18% of Georgians think that the government monitors his/her internet activities including email, social networks and forums. People agree with the latter statement irrespective of which sector they are employed in – public or private. However, people working in the public sector are almost twice as likely to express uncertainty about whether or not the government listens to everyone.

The data also shows that, in Tbilisi, 28% think that the Georgian government listens to everybody and monitors people’s internet activities, while this share is smaller in other urban settlements.
The data discussed in this blog post tells us more than just about Georgians’ perceptions of illegal surveillance. These perceptions are important as they can effect civic engagement significantly. People who think that the government is following their internet activities and listening to their phone conversations are likely to limit discussing politics through the internet and phone, as well as publicly which, in turn, limits public discussion and critical evaluation of current events. Even though this data was collected in 2013, when the new surveillance legislation had not yet passed, how much do we expect public perceptions to have changed since?
The upcoming data from TI Georgia’s 2015 survey, to be available shortly, will show whether these perceptions have changed since 2013. Meanwhile, you can learn more about the 2013 results here.
Monday, March 31, 2014
This land is my land and this land is your land
On June 28, 2013 the Georgian parliament passed a law placing a moratorium on agricultural land sales to foreigners until the end of December 2014. Agriculture has been called one of the pillars of the Georgian economy as 53% of Georgians were employed in agriculture in 2011 according to a European Union Neighborhood Programme report. Furthermore, agricultural investment has been the focus of both the current Georgian Dream coalition government, as well as the previously governing United National Movement. As a blog by the International School of Economics at Tbilisi State University highlights, the question then becomes, if Georgia wants to invest in agriculture, where will the money come from if not abroad? This blog looks at how Georgians feel about doing business with different ethnic groups as well as how Georgians feel about Georgian women marrying outside their ethnic group. The post also considers knowledge of foreign languages in rural areas in order to highlight that communication between Georgian and foreign farmers would be difficult without a common language.
Approximately 2,000 Indian farmers settled in Georgia according to a 2013 BBC report. This led to the incitement of protests particularly in the eastern Georgian province of Kakheti in 2013. The 2010 Caucasus Barometer asked Georgians how they felt about doing business with Indians. Results of the survey showed that 64% of rural Georgians approved of doing business with Indians compared to 71% of Georgians in Tbilisi. By looking at how Georgians living in rural areas feel about doing business with other ethnic groups, we can see how the Georgians most likely to be involved in agricultural activity might be inclined to working with foreign agricultural investors. The following graph shows that doing business with Iranians, a group that has also been reported to be investing in agricultural land in Georgia, is approved of by 59% in rural areas, compared to 86% in Tbilisi.

A further way of gauging how rural Georgians feel about foreigners is looking to whether they approve of Georgian women marrying other ethnic groups. Though Georgians generally are against marriage to foreigners, rural residents consistently disapprove of Georgians marrying other ethnic groups more often than Tbilisi based Georgians. The following graph shows this relationship for Russians, the ethnic group which Georgians are most likely to approve of Georgian women marrying. Notably, rural Georgians approve 15% less than Tbilisians. This question may be related to rural support of the moratorium. Although the CB 2013 does not ask whether respondents would like to have foreign neighbors, presumably rural inhabitants would be less likely to want foreign neighbors if they are unlikely to support the marriage of a local woman to a foreigner.

An additional factor to consider is that rural residents are much less likely to speak a foreign language compared to urban or capital based residents. The majority of rural Georgians (80%) report having no basic knowledge of English compared to 46% of Tbilisi’s residents reporting no basic knowledge of English. Furthermore, 44% of rural residents report having either no basic knowledge or a beginner’s level of Russian, compared to 12% of Tbilisi residents who say the same.
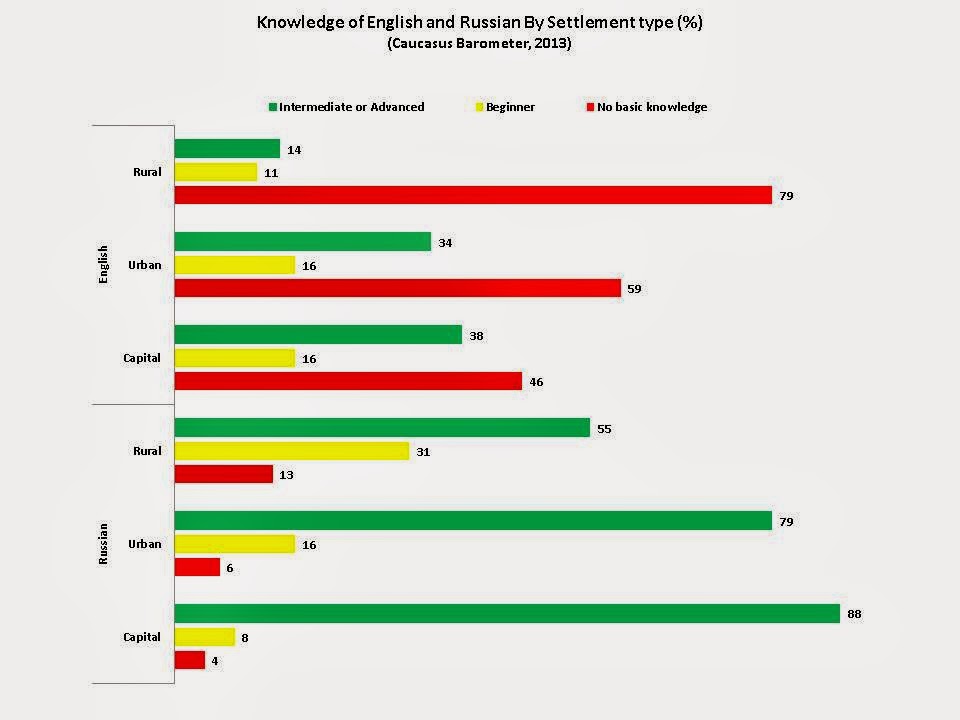
With the language barrier, it could be difficult for Georgian and foreign farmers to form relationships and communicate effectively. In order to avoid the language barrier, a number of companies have brought their own labor force to the country, including the Xinjiang Hualing Group which operates a small factory town on the outskirts of Kutaisi. Despite this, many foreign farmers who have moved to Georgia report hiring Georgians, especially during the harvest season. This could be a further factor which has conditioned the relationships existing between local and foreign farmers, as well as future relations between them.
This blog post has looked at the perspectives of rural residents on doing business with members of other ethnic groups as well as their level of knowledge of English and Russian. It shows that rural Georgians are much less likely to approve of doing business with other ethnicities, and that rural residents are much less likely to have knowledge of Russian or English. With these factors in mind, support for the ban on agricultural land sales may be more understandable. If residents in rural areas, many of whom are involved in agriculture, are less likely to be able to communicate with foreigners and are more likely than other Georgians to disapprove of relationships with them, then would they want them as neighbors? To explore these issues further, we recommend using our ODA tool here or reading this blog post detailing the extent of foreign agricultural holdings posted on the Transparency International Georgia website.
Tuesday, March 22, 2011
Transparency International Georgia launches platform to fix your street
Friday, December 10, 2010
TI: Corruption Reigns Worldwide; Georgia Comes Out on Top

Access the full report here, and provide us with your thoughts and comments.
Friday, October 29, 2010
Small changes in corruption rates in the Caucasus

| Denmark | 9.3 |
| New Zealand | 9.3 |
| Estonia | 6.5 |
| Italy | 3.9 |
| Georgia | 3.8 |
| Brazil | 3.7 |
| Cuba | 3.7 |
| Eritrea | 2.6 |
| Madagascar | 2.6 |
| Niger | 2.6 |
| Armenia | 2.6 |
| Uganda | 2.5 |
| Azerbaijan | 2.4 |
| Bangladesh | 2.4 |
| Sierra Leone | 2.4 |
| Russia | 2.1 |
| Uzbekistan | 1.6 |
| Somalia | 1.1 |
Scores for selected countries according to the 2010 CPI.
Wednesday, November 18, 2009
TI's 2009 Corruption Perceptions Index: Georgia's Score in Context
Transparency International (TI) released its 2009 Corruption Perceptions Index (CPI) on 17 November, and Georgia’s score rose slightly to 4.1, compared to 3.9 in 2008, which marks a minor improvement. The CPI uses a scale where "0" equals highly corrupt and "10" denotes not at all corrupt. New Zealand, for instance, came in first with a score of 9.4, whereas Somalia came in last with a score of 1.1.
The methodology behind the CPI reportedly includes a combination of surveys and assessments from over the last two years of both resident and non-resident experts and business leaders from ten different independent institutions. For a country to be included in the index, at least three different sources must be available, and, according to the index, seven surveys were used for Georgia.
According to TI, the CPI is meant to be a "snapshot," not an indicator of progress over time, to gauge perceptions of corruption in the public and political sectors. A degree of caution should therefore be used when interpreting the CPI results, as they do not necessarily reflect the views of the wider public but the expert opinions of a small group (a third party) of public sector analysts.
The scores, however, are inevitably used to compare countries, and individual scores from the prior year are always mentioned in the media, i.e whether they have risen or dropped.
On a regional level, Georgia's scores are rather positive. Armenia scored 2.7 and came in 120th place, which was a slightly negative decrease from last year (2.9). Azerbaijan received a score of 2.3 (143rd place), a fair improvement from its mark of 1.9 in 2008.
Overall, Georgia's ranking places it 66th out of 180 countries. Interestingly, that score puts Georgia above EU Member States Greece, Bulgaria, and Romania, all of which scored 3.8 (tied for 71st place). Moreover, Georgia's score ties that of EU candidate Croatia and is above FYR Macedonia (3.8, 71st place), another EU candidate. Georgia also scored better than Montenegro (3.9, 69th place), Serbia (3.5, 83rd), Moldova (3.3, 89th), and Bosnia and Herzegovina (3.0, 99th). (Note that though the confidence intervals overlap substantially in the index, Georgia’s point estimate was still higher than in these other countries.)
For the 2009 CPI results and the methodological brief, go here.
Thursday, January 22, 2009
Index of Economic Freedom: a critical time lag?

One would expect that the Index published early in the year is based on the data from the previous year. We can expect that the 2009 index reflects the 2008 situation, even though calling this “a 2009 index” is misleading. However, the data goes back even further than 2008.
Compare the Index of Economic Freedom’s Freedom from Corruption score and CPI, which is used as the basis for the former, for Azerbaijan:
 The CPI 2007 methodology explains that CPI combines assessments from the last two years – 2007 and 2006. This means that the Freedom from Corruption indicator in the 2009 Index of Economic Freedom is based on the figures of 2007 and 2006.
Monday, August 04, 2008
Georgia: Women's Participation in Politics
Women’s participation at all levels of elections in
Let’s dig deeper: during the last parliamentary elections women composed 28% of all parties’ election lists (485 out of 1757); no woman in any party was listed as the number one candidate; only three parties had women within their first five candidates.
The inequality of both women and men standing in election led to an even smaller percentage of women getting a seat in the Georgian parliament: eight from the party list and only one as a majoritarian candidate. Currently only 6% of MPs are women. 
Recently CRRC conducted a survey for Transparency International-Georgia on public attitudes to see what Georgians think of their Parliament. According to the TI data, 64% of those polled agree with the statement that women should have strong representation in parliament. But about 23% of women and 26% of men think that parliament is not the place for women. These misogynists can tip the scale for majoritarian candidates, but what is the answer to the diminishing number of candidates from the party lists? Anti women sentiment in the parties, a party culture? What do you think?

CWN came up with the number of suggestions in order to achieve equal representation of both genders in the legislative body. According to CWN, it is crucial to reach balance not only in the nominated lists but in the taken seats as well. CWN believes the best way to influence and motivate political parties to respect and implement principles of equality is setting sanctions on public funding: when a difference between the number of representatives of each gender goes beyond 2% (yes, two) of the total number of representatives, their political party will be penalized. For more details about CWN finding and policy recommendations visit their website.
If you want to know more about TI Survey, let us know. Some initial data snapshots and results are already available here.
Tuesday, October 09, 2007
How does the Caucasus Fare? | Transparency International Releases Global Perceptions Index

No. With all of this in mind we should approach the CPI with increased caution but certainly no less respect. In terms of a consolidated point of reference from which to start comparisons on corruption it is invaluable. This is especially true when cross-referenced with other easy to use reports such as the Global Corruption Barometer (2006 available here).
