Showing posts with label Methods. Show all posts

Tuesday, June 27, 2023

CRRC’s 9th Annual Conference: New Frontiers: The South Caucasus Amidst New Challenges

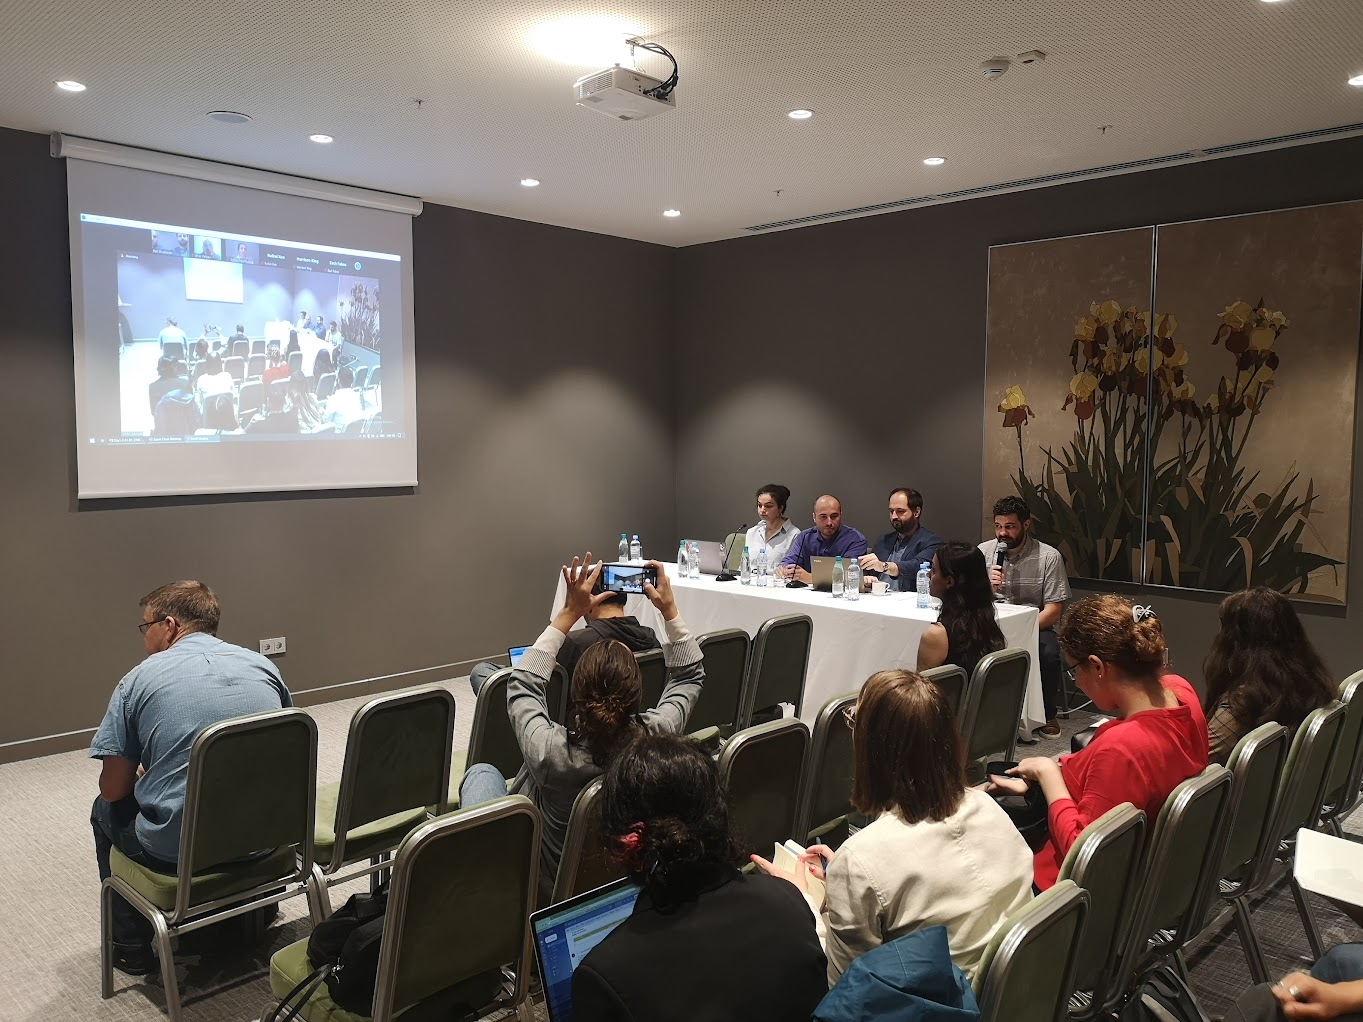
On June 22 and 23, the Caucasus Research Resource Centers in Armenia, Azerbaijan, and Georgia hosted the 9th annual methods conference. This year the conference focused on the  Russian-Ukrainian and how it has altered the geopolitical, economic, and demographic state of the South Caucasus. 

The first day of the conference featured four panels, on issues ranging from values, mobilization, and activism in the South Caucasus to migration to and from the region. 

The first day also featured a round table on  Archival Access and Openness in the Caucasus and Eurasia, with speakers from Berkeley, Cambridge, and Princeton, among other universities. 

The second day of the conference featured two panels, with the first looking at new economic geographies of the region, and the second focused on intercommunal relations in the South Caucasus. 

The conference concluded with a methods workshop, focused on Empowering Research Subjects with Photovoice in the South Caucasus.

The full conference video will be available from CRRC Georgia’s YouTube Channel in the near future, here.

The conference abstract book is available here. 


Tuesday, July 06, 2021

Who lies about how they voted?

Note: This article first appeared on the Caucasus Data Blog, a joint production of CRRC Georgia and OC Media. It was written by Koba Turmanidze, President at CRRC Georgia. The views presented in this article represent the views of the author alone and do not necessarily coincide with the views of CRRC Georgia or any related entity.

When the wording of questions in post-election polling is modified, the responses from survey respondents change along partisan lines. 

Self-reported election turnout in post-election surveys is often considerably higher than official turnout records. The gap likely stems from picking too many active voters as respondents since voters are also more likely to participate in surveys. Yet another potentially more substantial reason is over-reporting due to social desirability bias: respondents feel they are under social pressure to demonstrate fulfilment of their civic duties on election day. 

This blog describes a replication of a widespread approach to reducing social desirability bias in self-reported turnout by asking the turnout question in three different ways: a traditional direct question, providing an example of turnout over-reporting, and including face-saving answer options in the turnout question. 

The question wording did not have an effect on self-reported election turnout overall, because different partisan groups reacted to the question-wording in different ways. Non-partisans and opposition supporters were less likely to report turnout when additional information was provided. In contrast, telling Georgian Dream supporters about turnout over-reporting increased over-reporting among Georgian Dream supporters.         


Many studies have demonstrated that wording matters for turnout questions: when respondents are exposed to a straightforward ‘yes’ and ‘no’ question about their participation in recent elections, they tend to over-report. However, when respondents are also given an option to select face-saving responses in addition to ‘yes’ and ‘no’, self-reported turnout decreases. 


A large-scale study of 19 surveys in five democracies, which used the face-saving response option, ‘I usually vote, but did not this time’, showed mixed results. In 11 surveys, face-saving options significantly decreased self-reported voting, while it had no effect in the remaining eight cases.


According to official data, 57% voted in Georgia’s parliamentary elections in 2020, while 75% said they did on the Caucasus Barometer survey right after the elections. To investigate whether people report their voting differently depending on the question wording, an experiment was conducted on CRRC-Georgia’s omnibus survey (12-19 April, 2021). 

The sample was randomly split into three equal groups. One group received a traditional direct question about whether they voted or not in the October 2020 parliamentary elections. The second group received information about the discrepancy between official statistics and survey results (57% official, 75% reported) before asking about their own turnout. The third group could select two additional options in addition to ‘yes’ and ‘no’: ‘I intended to vote, but could not manage at the last moment’ or ‘I did not intend to vote, but was asked at the last moment and did not refuse’.

At first glance, the data appear to suggest voters over-report turnout no matter the question formulation. On the traditional direct question, 77% reported voting. When the over-reporting message was included, the number declined to 73%, though the difference is not statistically significant. The question with additional face-saving options also resulted in a substantively similar number (79%).  

Looking at who was more or less likely to report voting, partisans were significantly more likely to report voting than non-partisans (i.e. those who could not name any party closest to their views or were not sure if such a party existed). Likewise, residents of rural areas were more likely to report turnout than voters in Tbilisi. Voters with tertiary education, voters above the age of 55, and employed people reported voting more often than voters with no tertiary education, younger voters, and those not working.  


While the three types of questions made no difference for the population at large, they had significantly different effects on supporters of different parties. For non-partisan voters, the over-reporting message worked as intended, decreasing reported turnout from 74% to 64%. On the other hand, face-saving options did not change answers of non-partisans significantly. For Georgian Dream voters, the over-reporting message had the opposite effect. When they heard that the public significantly over-reported turnout in recent elections, their reported turnout increased from 79% (on the direct question) to 91%. For opposition supporters (all parties combined except for the ruling party), face-saving options had the expected negative effect, it reduced reported turnout from 88 to 74%.


This survey experiment showed that question-wording does not have an effect on reported turnout, overall. However, the reason for the overall zero effect is that different question types have different and opposing effects for different partisan groups. While for non-partisans and opposition supporters more nuanced question wording significantly decreased self-reported turnout, for ruling party supporters, the over-reporting message served as a mobilizing factor. When exposed to the information that over-reporting was a norm, they felt that they had to over-report even more.  

Monday, February 25, 2019

Are there predictors of not knowing and refusing to answer on surveys in Georgia?

Are there variables that predict who is likely to report “Don’t know” or to refuse to answer survey questions more often in Georgia? This blog post looks at this question, using un-weighted Caucasus Barometer 2017 (CB) data for Georgia.

Only questions that were asked to all respondents were considered during the analysis presented in this blog post (a total of 177 questions), and variables were generated for:

  1. The number of times a respondent answered “Don’t know” and;
  2. The number of times a respondent refused to answer a question.

On average, respondents refused to answer one question on CB 2017. The median number of refuse to answer responses was zero. Respondents answered “Don’t know” to nine questions on average, and the median number was five. As a previous blog post highlighted, people most often report they do not know when asked about political questions and areas of reasonable uncertainty (e.g. their economic futures). When it comes to refusing to answer, people are most likely to refuse to answer questions about their income and politics.

To analyze whether or not demographic variables predicted “Don’t know” and “Refuse to answer” responses, Poisson regression was used. The following demographic variables were included in both regressions: age group (18-35, 36-55, 56+), gender, ethnicity (ethnic minority or ethnic Georgian), settlement type (capital, other urban, rural), and level of education (secondary or lower, vocational, tertiary). Besides demographics, the analysis also included a variable for whether people besides the interviewer and respondent were present during the interview. After the regression analysis, the number of times a respondent would be expected to respond either don’t know or refuse to answer was calculated, controlling for other factors included in the models.

A number of demographic characteristics are associated with higher expected rates of “Don’t know” response. Ethnic minorities, people in rural areas and urban areas outside Tbilisi, people without tertiary education, women, and people over the age of 55 provide more don’t know responses than people in Tbilisi, those with tertiary education, and people under the age of 55. Besides demographics, whether someone is present at an interview that is not participating in it is also associated with how often people report they don’t know. If additional people are present at an interview, then respondents report one fewer don’t know response on average. This may reflect a large number of factors (e.g., maybe people with large families are more certain of their views), however, one plausible explanation is that people do not want to admit they do not know in front of other people.

Some demographic variables also predict “refuse to answer” response options. People in the 36-55 age group refuse to answer questions slightly more often than in other age groups as do people outside Tbilisi, those with tertiary education, and ethnic Georgians.  Besides demographics, the presence of people besides the interviewer at the interview has a significant impact on the frequency of refusing to answer. This again may reflect social pressure of some sort. Rather than respondents being worried about appearing uninformed, one plausible explanation is they are more likely to be worried about appearing socially uncooperative.

While don’t know answers and refusing to answer are both often treated as non-response, these arguably are different types of responses. If they indeed are different, one would expect them not to be strongly correlated. The results of a correlation analysis suggest a very weak (ρ=0.009) and non-significant association, supporting the contention that don’t know and refuse to answer options are indeed different types of responses rather than replacements for the other.

This blog post has looked at whether and which demographic groups respond “Don’t know” and “Refuse to answer” to survey questions more. The results suggest that a variety of demographic variables are significant predictors. In addition, the presence of other people at the interview appears to have an impact on how often people report they don’t know or refuse to answer survey questions, with both declining when people are present.

To download the data used in this blog post, click here.

Monday, September 17, 2018

Which questions do people tend to respond “Don’t know” to?

On surveys, sometimes the questions asked are hard for some people to answer. As a result, the answer option “Don’t know” is a regular part of any survey dataset. But are some questions particularly likely to elicit these responses? This blog post uses un-weighted 2017 CRRC Caucasus Barometer (CB) survey data for Georgia to look at this question.

The ten CB 2017 questions with the highest share of “Don’t know” answers are provided on the chart below.


Two patterns are present in the CB 2017 questions that people responded “Don’t know” to most often. First, unsurprisingly, the shares of “Don’t know” answers are higher to questions that it is reasonable to think a person would be uncertain about. Second, while only about one in five questions on the CB questionnaire aimed to measure political or economic attitudes, most of the questions in the top ten are such questions.

To have a closer look at the data used in this blog post, visit CRRC’s Online Data Analysis portal.


Monday, December 11, 2017

Evaluation of the Impact of the Agricultural Support Program

CRRC-Georgia carried out a quasi-experimental, post-hoc, mixed methods impact evaluation of the Agricultural Support Program (ASP) between December 2016 and April 2017 in collaboration with the Independent Office of Evaluation (IOE) of the International Fund for Agricultural Development (IFAD). The Agricultural Support Program took place in Georgia between 2010 and 2015. It consisted of two components: 1) Small Scale Infrastructure Rehabilitation and 2) Support for Rural Leasing. For the infrastructure component, the project aimed “to remove infrastructure bottlenecks which inhibit increasing participation of economically active rural poor in enhanced commercialization of the rural economy” according to project documentation. Within the infrastructure component, three types of infrastructure were rehabilitated or built: 1) Rehabilitation of primary and secondary irrigation canals; 2) Rehabilitation of bridges used to bring cattle to pasture; 3) The construction of drinking water infrastructure.


In line with the Internal Office of Evaluation of IFAD’s methodology, impact was assessed across five specific domains. These include: (i) household income and assets; (ii) human and social capital and empowerment; (iii) food security and agricultural productivity; (iv) natural resources, the environment and climate change; and (v) institutions and policies. While the focus of the evaluation is on the rural poverty impact criterion, the performance of the programme has also been evaluated for impact on gender equality and women’s empowerment.

The evaluation assessed not only “if”, but also “how” and “why” the programme has or has not had an impact on selected households and communities in the programme area. To this end, the evaluation team adopted a mixed methods approach including a household survey, focus group discussions, in depth interviews, and key informant interviews. The survey consisted of 3190 interviews, with 1778 interviews in control households and 1412 in treatment households.

In order to test for impact, the team used a quasi-experimental survey design. The driving idea behind quasi-experimental analysis is to use counterfactuals to understand what would have happened in the communities which received interventions had the intervention not taken place. Given that ASP did not make use of randomization, a two staged matching procedure was used to achieve balance on observable variables. First, treated communities were matched with non-treated communities on a number of variables. Second, after data collection households were matched using multivariate matching with genetic weights. Finally, when feasible, a differences in differences approach was used, with changes measured rather than only the 2016 outcome. Regression analyses were then used to estimate effects.

The key findings of the impact analysis include:
  • Indirect beneficiaries of the leasing component – individuals who sold grapes to companies that received leases – had substantively large increases in agricultural incomes;
  • Analyses often suggest little if any impact when it comes to rural poverty. However, context is important. During the project period, ASP was a small part of the very large aid inflows to Georgia, much of which was directed to the area where ASP activities took place. Hence, a lack of significant changes suggests that ASP performed on par with, but not better than other aid projects which took place in control communities;
  • Project outreach in the small scale infrastructure communities was inadequate, resulting in less effective project design and missing an opportunity for the development of human and social capital;
  • The project’s main success within the food security and agricultural productivity impact domain is the increase in amount of land irrigated; the project does not appear to have had any detectable impact on food security;
  • ASP does not appear to have contributed to the sustainable development of the agricultural leasing sector in Georgia;

To read more about the impact evaluation, see the full report, which is available here.

Monday, October 23, 2017

Survey incentives: When offering nothing is better than offering something

Why do people take the time to respond to surveys in Georgia? A telephone survey experiment CRRC-Georgia carried out in May 2017 suggests that small financial incentives may actually discourage people from participating in surveys. This finding suggests people may respond to surveys for intrinsic (e.g. because they are curious or want to help) rather than extrinsic reasons (e.g. doing something for the money).

During the experiment, 2320 respondents were asked whether they would be willing to participate in future phone surveys. Half were offered a GEL 2 transfer (about US$0.82 at the time of the survey) to their telephone in exchange for doing so. The other half was not offered any incentive. Respondents were randomly assigned whether they were offered an incentive or not.

The difference in responses isn’t impressive, but is statistically significant. Approximately 4% fewer people said they would participate in future surveys when offered the incentive. The chart below displays the effects of different variables on willingness to participate in future surveys in terms of odds ratios. The first model looks at the effect of being offered GEL 2 alone, while the second model controls for age, sex, and settlement type. The odds of someone responding positively when offered the incentive where approximately 0.8 to 1 in both regressions, meaning that the offer made it less likely that individuals would be willing to participate in a future survey. The second model also shows that except for those in the 36-55 age group, demographic characteristics have no effect on people’s likelihood of agreeing to participate in future surveys.


Note: For the regression models presented above, “No” was coded as the base category, “Don’t know” as the second category, and “Yes” as the third category. The logic behind coding “Don’t know” as a middle category is that the person is not refusing to participate in future surveys, but rather is saying they might or might not. 

The results of this experiment show that people in Georgia are slightly less likely to want to participate in future surveys if you offer them a small amount of money compared with offering nothing. This finding may at first seem strange. However, a potential explanation is that GEL 2 may have seemed like a paltry sum, and people may have been offended. In turn, rather than engaging people’s intrinsic motivations like a sense of duty to help others or simple curiosity, the offer of GEL 2 could have activated people’s extrinsic motivations. In turn, the extrinsic incentive wasn’t large enough to counter the loss in the intrinsic value of participation, at least on average.

For a look at a comparable effect in a very different context, this study on attitudes towards having nuclear waste facilities found a similar pattern: when offered money, people were less likely to support having such a facility in their community.

Have other thoughts on what might have encouraged those offered GEL 2 to participate in future surveys to decline participation more frequently? Let’s have a conversation on Facebook or Twitter.


Monday, July 24, 2017

Nudging Marshrutka Safety

[Note: Dustin Gilbreath is a Policy Analyst at CRRC-Georgia. This article was originally published on Eurasianet. ]

Auto safety is a perennial issue across Eurasia, as the generally poor condition of highways and byways, the proliferation of haphazardly maintained vehicles and a proclivity for reckless driving mean that death is a constant part of life on the road.

Among the most hazardous forms of public transportation are the ubiquitous communal minibuses known as marshrutkas, which ferry passengers around and between cities and towns. Marshrutkas are a mixture of taxi and public bus, and, for passengers, make up in convenience what they lack in comfort. But there is also a significant risk involved in using marshrutkas because many are old and in need of repair, and they are operated by overworked, stressed-out and distracted drivers.

But there is good news for marshrutka users: an experimental project conducted in Georgia suggests that a cost-efficient monitoring program could significantly increase rider safety.

The monitoring format, developed by the Caucasus Research Resource Centers-Georgia, underwent a month-long test, starting last September 20. CRRC recruited paid observers to ride on marshrutkas and monitor the driving behavior of operators. Monitors tracked marshrutka trips in three phases. In the first, they recorded whether a group of drivers engaged in dangerous driving behaviors, including passing in places where it was illegal, and distracted driving behaviors like smoking and talking on a cell phone. This contingent formed the trial’s control group.

For the second phase, monitors followed a different group of drivers, who were told in advance that they were being observed and that if they were judged the safest driver in the survey, they would receive a fuel voucher. The drivers in the second group were also told that an anonymous monitor would at some point in the near future come back to observe their road behaviors.

The last step involved monitors returning to both the control and treatment groups unannounced to observe driving.

By comparing the results of the first phase to the second, it was possible to determine the effect of overt observation on driving patterns. Evaluating participants in the second phase to the same minibuses in the third provided insight into whether those who knew they were monitored, and were told they would be monitored again, maintained safer driving practices. Lastly, by comparing the first-phase drivers to their third-phase performances, it was possible to test for the consistency of driving behaviors by the control group.

The results of the trial indicated that a small, anonymous monitoring program could be effective in improving driver practices. While in the first round of observation, 96 percent of drivers engaged in some form of dangerous driving, among those in the second group, who were told in advance that they were being monitored, the number was 70 percent. And while 79 percent of drivers made illegal passes in first phase, 43 percent from the second group engaged in such behavior.

In the third phase, carried out several weeks after the first two phases, drivers from the second group still engaged in 14 percent fewer dangerous driving behaviors than those from the first group who had not been told in advance that they were being observed.

CRRC-Georgia’s project involved the monitoring of 360 inter-city minibus trips in a randomized control trial (RCT). RCTs are considered the gold standard in social science because they provide firm evidence of cause and effect through randomly giving a treatment to some individuals, and not others and then comparing outcomes.

While the marshrutka safety experiment raises hopes that a monitoring program could encourage changed behaviors, the evidence is not definitive. The experiment did not take weather into account, a factor that can potentially alter driving patterns. It also could not measure precisely for the possibility of contamination of the source pool, i.e. drivers who had been observed later talking about the project with colleagues, and encouraging other drivers to be more careful behind the wheel.

While the experiment was carried out in Georgia, there is no particular reason to suspect that such a policy would not work in other areas and contexts.

Monitoring projects could be conducted either by non-governmental organizations or by municipal government agencies. A government-run project would likely stand a better chance of improving safety, as drivers could be fined for hazardous driving, as well as rewarded for safe driving. This policy would likely have a greater impact since social scientists have repeatedly shown that individuals strive to avoid losses much more intensively than they seek out gains. 

[Note: Dustin Gilbreath is a Policy Analyst at CRRC-Georgia. This article was originally published on Eurasianet. The full report this article is based on is available here: http://bit.ly/2txNQRR. The data and replication code for the analysis in this article is available here: http://bit.ly/2us0tCr. The research presented in this article was funded through the East-West Management Institute’s (EWMI) Advancing CSO Capacities and Engaging Society for Sustainability (ACCESS) project, funded by the United States Agency for International Development (USAID). The content of this article is the sole responsibility of the author and does not necessarily reflects the views of USAID, the United States Government, or EWMI.]

Monday, June 26, 2017

CRRC’s Fifth Annual Methodological Conference: In Search of Methodological Innovation

CRRC’s fifth annual Methodological Conference took place on June 23 and 24, 2017 in Tbilisi. This year the conference’s focus was on policy analysis in the South Caucasus, and the search for methodological innovation. Over 50 participants representing institutions in the United States, United Kingdom, Georgia, Azerbaijan, Armenia, Russia, and Canada attended.

Alexis Diamond of the Keck Graduate Institute (KGI), San Francisco gave an opening address for the conference titled: Deliberate ignorance: The dangers of knowing too much too soon. The talk covered a wide range of issues in evaluation, however, emphasis was placed on the importance of honest evaluation.
The first day of the conference had four sessions, with papers on a wide variety of subjects from the geographies of polarization and inequality in Tbilisi to a field experiment on marshrutka safety and a machine learning approach to profiling tax awareness in Armenia. 
The opening slide of David Sichinava’s presentation on Spatial Patterns of Emerging Inequalities in Tbilisi, Georgia.
The second day of the conference was dedicated to workshops. Alexey Levinson of the Levada Center, Moscow lead a workshop on open-ended group discussions and Aaron Erlich of McGill University discussed the fundamentals of multiple imputation. The conference also included workshops on case studies in public health, web surveys, and synthetic controls.
Aaron Erlich discussing why and when to use multiple imputation.
For more information, the full conference program can be accessed here.

Monday, June 19, 2017

Back to the USSR? How poverty makes people nostalgic for the Soviet Union

A recent CRRC/NDI survey asked whether the dissolution of the Soviet Union was a good or bad thing for Georgia. People’s responses were split almost evenly: 48% reported that the dissolution was a good thing, whereas 42% said it was a bad thing for the country. Such a close split raised questions in the media about why people took one view or another.

While it is tempting to explain assessments of a past event, such as the dissolution of the Soviet Union, using people’s attitudes towards foreign policy issues, this blog post only looks at respondents’ socio-demographic and economic characteristics and some reported behaviors that could potentially shape their attitudes. Specifically, we look at the impact of gender, age, education, ability to speak English and Russian, frequency of internet use, settlement type and the number of durable goods a household possesses, out of the ten durables the survey asked about: a refrigerator, color TV, smartphone, tablet computer, car, air conditioner, automatic washing machine, personal computer, hot water, and central heating. We interpret the number of durables owned as a measure of the households’ economic status. Surely, this measure is not perfect and gives us only partial information about the household’s economic conditions. However, this is the best available measure from this particular survey, provided that many people do not like reporting their income or expenditures, or do not provide accurate information on these.

The chart below shows the results of a logistic regression model which predicts the odds of a respondent saying that the dissolution of the Soviet Union was a good thing for Georgia. The dots on the chart indicate point estimates for each independent variable, and the lines show 95% confidence intervals. If a line does not cross the vertical red line, we are 95% confident that the variable has an impact on the dependent variable, i.e. the belief that the dissolution of the Soviet Union was a good thing for Georgia. The further a horizontal line from the vertical red line, the larger the effect of the variable.

The model shows that gender and the ability to speak either English or Russian do not influence people’s assessments of the dissolution of the Soviet Union. As one might expect, age has a significant, negative impact: the older a person is, the lower is the probability that s/he will express a positive attitude towards the dissolution of the USSR. Education, frequency of internet use and possession of durables have the opposite impact: people with tertiary education are more likely to assess the dissolution positively than people with less than tertiary education. Likewise, people, who use the internet at least once a week assess the dissolution more positively than people who use the internet less often or never. Also, the more durables a household owns, the higher the probability of assessing the dissolution of the Soviet Union as a positive event for Georgia.

As expected, settlement type also matters: the chart shows the effect of living in Tbilisi, other large towns, predominantly Georgian-speaking rural settlements and ethnic minority settlements, which are compared to small towns – the reference category. Large towns include six cities with more than 40 thousand people, whereas smaller urban settlements are grouped into a small town category. We define an ethnic minority settlement as a location in which 40% or more of the inhabitants are ethnic minorities. Normally, these are towns and villages with large Armenian or Azerbaijani populations in the Kvemo Kartli, Samtskhe-Javakheti and Kakheti regions.

While residents of large towns and rural settlements have similar opinions about the dissolution of the Soviet Union as residents of small towns, Tbilisi residents are more likely to assess the dissolution positively. In contrast, those living in minority settlements tend to assess the dissolution negatively.
Based on the above, we conclude that age, education, frequency of internet use, possession of durables and settlement type influence an individual’s assessment of the dissolution of the Soviet Union. As a next step, we tested whether age, education, frequency of internet use, and possession of durables influence individuals’ attitudes differently in different settlement types.

The analysis shows that the impact of age, education and internet usage does not vary by settlement type. However, we observe a very different picture in the case of household possessions: possessing more durables increases the probability of positive assessment of the dissolution of the USSR in all settlement types except for (non-minority) villages and small towns. Its impact is largest, however, for residents of ethnic minority settlements. If an individual living in such a settlement has no durables, his or her probability of assessing the dissolution of the Soviet Union positively is below 20%. However, as the number of durables in the household increases, the probability of a positive assessment increases nearly linearly, and exceeds 60% when the household owns all ten items asked about on the survey.

Hence, we conclude that age, education, settlement type, and economic conditions significantly influence people’s assessments of the dissolution of the Soviet Union. The impact of a household’s economic situation is largest in ethnic minority settlements. Therefore, economic deprivation, arguably caused by and interrelated with a number of other factors, seems to be the most important driver of negative assessments of the dissolution, rather than minority status per se.  

To have a closer look at the CRRC/NDI data, visit CRRC’s Online Data Analysis tool.

Tuesday, April 25, 2017

How many Tetri are in a Lari? The importance of municipal statistics for good governance

[Note: This post was co-published with Eurasianet and authored by Koba Turmanidze, CRRC-Georgia's Director.] 

The government of Georgia committed itself to collect and publish policy-relevant data in a timely manner under the Open Government Partnership. Yet while most ministries and state agencies are happy to provide national-level statistics, they often fail to break them down to the municipal level. 

As a result, if you think about it in monetary terms, the current system means that officials do not know how many tetri are in a lari. 

Reliable municipal statistics can contribute to good governance in several important ways. First, municipal-level data can let citizens assess the quality of state services they receive compared to other municipalities, or to the national average. Second, municipal-level data can help policy makers improve the targeting of programs, and therefore, spend public money more efficiently. Third, it can help both government and citizens evaluate the successes and failures of municipal governance.

The following scenarios highlight the benefits of comprehensive data on a local level: 

Imagine you want to move from one town to another for a better job. You consider moving with your spouse and a child of school age. However, your spouse does not want to move, arguing that your town has much better public schools than the new one. In such cases, it would help if you could look at municipal-level education data to see if schools in the two towns are similar or different in terms of the student-teacher ratio, exam scores, the success rate on national examinations, etc. 

Imagine you are a civil servant and are working with an investor to build a new factory in a municipality. You want the factory to be built in the municipality where its social impact will be highest. To persuade the investor, you use municipal statistics to demonstrate that the municipality of your choice has high unemployment, yet its labor force is younger and better trained than in comparable municipalities. 

Imagine you are an analyst in a think tank and your task is to advise the government on whether to extend a poverty reduction program or not. The government claims the program helped to reduce poverty by two percentage points nationwide, but you have reasons to suspect that the reduction happened in certain settlements, whereas in others the program had a negligible impact. You look at relevant data on the program and poverty statistics, and conclude that the program’s effect across municipalities was truly unequal. Importantly, it made no difference in the most economically deprived communities. Therefore, you advise the government to redesign the program to improve its impact on the communities with the highest poverty rates, before pouring more money into it. 

Unfortunately, we can only imagine the above. These three scenarios remain purely hypothetical, since, in Georgia, reliable municipal data is rarely available on education, employment and poverty. 

CRRC-Georgia’s repeated interactions with a multitude of state agencies over the past three years have uncovered at least three problems regarding municipal data. First, when municipal data of potentially good quality exists, it is often not processed and made available to the public. Second, if municipal data is accessible, its quality is often questionable. Third, municipal data often does not exist at all, since the responsible agency does not recognize its value, or is unable to collect it due to lack of relevant training. 

Below are three concrete cases that correspond to these three problems: 

Case 1: Until recently, the National Assessment and Examination Center (NAEC) maintained detailed and high-quality data on the results of the Unified National Exams (UNE) for many years. The data allowed one to see which municipality’s and even school’s students were most successful in the exams. Such data was not proactively shared on the Center’s website, but was available upon request. The situation changed when the Center introduced electronic applicant registration in 2011. Under the new system, an applicant’s place of residence and school was no longer recorded. However, the Center could still identify the municipality based on an applicant’s ID number. 

For the 2015 UNE results, NAEC processed the data this way and made the data file available on its website. However, when CRRC-Georgia requested the same data for 2016, the Center turned the request down, arguing it no longer processed data per municipality, and would not do so for our sake. As a result, it is no longer possible to analyze municipal- or school-level performance and map it as we did in this blog post. At the time, this map drew attention to large differences in educational attainment countrywide, including an important fact – that Unified National Exam scores in Upper Ajara were among the worst in the country. In part in response to this fact, AGL, a Norwegian company building a hydro-electric dam in upper Ajara created a tutoring program for students in the region to help them prepare for the exams. If the NAEC withholds such data, it will hinder the ability of interested parties to spot trends and develop remedial policies.

Case 2: The Social Service Agency (SSA) is a leading organization in the country in terms of providing access to comprehensive data on poverty and targeted social assistance at the national and municipal levels. Among other statistics, the Agency reports monthly data on applicants and recipients of social aid. The 2014 census data, however, casts some doubt on whether the SSA poverty statistics are trustworthy. 

The scale of mismatch between the agency’s data and the 2014 census results is evident from the chart below. Using Geostat’s population estimates, the agency calculates the share of the population registered for targeted social assistance in each municipality. The census was conducted in November 2014, so it is possible to re-calculate the share of those registered for targeted social assistance based on the census data and compare it with the agency’s estimates. 

Let’s take the extreme case of Lentekhi. The agency reported that 44 percent of the population applied for targeted social assistance. When the census data is used, the finding is that 89 percent of Lentekhi residents registered for social assistance. Thus, the SSA estimate was 45 percentage points lower than the actual percentage. The chart below plots the differences between the shares of the population registered for targeted social assistance, as calculated and reported by the SSA on the one hand, and updated calculations based on the 2014 census data on the other, for each municipality in November 2014. Overall, the agency underestimated the share of applicants by 14 percentage points, on average. However, publicly available data has yet to be adjusted based on the 2014 census.    


Case 3: In a number of cases municipal statistics do not exist. Measuring the scale of economic activity (level of employment by employment sector, total value added, etc.) in every municipality would require large-scale surveys that are both time-consuming and expensive. Geostat’s periodic Integrated Household Survey cannot provide this information, due to the cost that such a large sample size would entail. 

However, the Revenue Service (RS) under the Ministry of Finance of Georgia could help solve this challenge. Based on taxpayers’ IDs, the agency can provide information about the number of taxpayers, be it individuals or organizations, and amount of taxes collected in each municipality. This information would serve as a good proxy of economic activity by municipality. However, as the RS told CRRC-Georgia, it can only break the data down for regions. Officials claimed that breaking the data down further was not possible. 

Undoubtedly, the collection and analysis of municipal data requires additional resources. However, the three concrete cases highlighted above show that a little increase in awareness regarding municipal data could go a long way toward promoting better municipal governance in important ways. Investors could have clearer insight into the best investment destinations, for one. Civil society groups would also have better ways to assess the successes and failures of government actions. Citizens likewise would have a better idea of where their place of residence stands compared to other parts of the country, or the national average. Government could have better tools to ensure equal access to services in the country, or to achieve efficiencies in the provision of services. 

All of this is possible. Unfortunately, it is not reality. And as a result, the government doesn’t know how many tetri are in a lari.

Tuesday, January 24, 2017

Developing the “culture of polling” in Georgia (Part 2): The misinterpretation and misuse of survey data

[Note: This is the second part of a guest blog post from Natia Mestvirishvili, a Researcher at International Centre for Migration Policy Development (ICMPD) and a former Senior Researcher at CRRC-Georgia. The first part of this blog post is available here. This post was co-published with the Clarion]

The misinterpretation of survey findings is a rather widespread problem in Georgia. Unfortunately, it often leads to the misuse of data, which not only diminishes the importance of survey research, but also leads to more serious consequences for the country.

To illustrate how one might misinterpret survey data, the following example from CRRC’s 2015 Caucasus Barometer survey can be used. When asked, “What do you think is the most important issue facing Georgia at the moment?”, only 3% of the population mentioned low pensions, 2% the unaffordability of healthcare, and 2% the low quality of education. A number of issues including the violation of human rights, unfairness of courts, corruption, unfairness of elections, unaffordability of professional or higher education, the violation of property rights, gender inequality, religious intolerance and emigration were grouped into the category “Other”, because, in total, only 7% of the population mentioned these issues.

Based on these findings, one might think that these issues are unimportant in Georgia. However, this would be a misinterpretation, which happens for a number of reasons. Here, I focus on two. The first is:

1. Not paying attention to the exact formulation (wording) of the survey question, answer options, and instructions 

One reason a large share of the population did not mention the violation of human rights, gender inequality and religious intolerance as important issues is because each respondent could name only one issue. The options they chose (unemployment and poverty were named most often) were more important to them than human rights, gender inequality, and religious intolerance.

If a different question – “How important is the issue of human rights [or gender inequality, or religious intolerance] for Georgia?” – had been asked, the share of people who would answer that these issues are important would very likely be much higher than one or two percent. This wording would make people judge the issue not in relative, but absolute terms.

While working with survey findings, the exact wording of question(s) should always be taken into account. When the question is interpreted or reworded, it will almost inevitably lead to some degree of misinterpretation. More often than not, fieldwork instructions should also be taken into account. For example, was a show card used for the question? Was the number of answer options a respondent could choose limited or not?

Thus, it is crucial that survey results are understood and reported, keeping in mind the exact wording of the question(s), answer options provided, and any instruction(s) that had to be followed during the interviews. This will help minimize the risk of misinterpretation.

A second common cause of misinterpretation of public opinion polls in Georgia is:

2. Interpreting public opinion survey results as ‘reality’ rather than perceptions 

Even if the question discussed above had been asked so that the absolute rather than relative importance of the issues was measured and the survey findings still suggested that people thought the violation of human rights, gender inequality and religious intolerance were not important issues for the country, the findings should not be interpreted as a direct reflection of ‘reality.’ As discussed in the first part of this blog post, public perceptions are not ‘reality’.

Interpreting public perceptions as objective ‘reality’ is incorrect, because both perceptions and misperceptions, information and misinformation shape public opinion. It is equally important to remember that, sometimes, ‘reality’ simply does not exist. Moreover, as a number of studies have shown, it is often the case that people are simply wrong about a wide variety of things.

None of the above, however, diminishes the role and importance of public opinion polls. In fact, the misperceptions that survey findings can uncover are often among the most important outcomes for policymakers. Instead of putting an equal sign between public perceptions and ‘reality,’ data analysts and policymakers should critically analyze and address gaps between the two.

Going back to the above example, an accurate interpretation would consider the findings in the context of other studies that are specifically focused on human rights (or gender equality or religious tolerance). Indeed, numerous studies indicate that Georgia has serious problems with all three issues i.e., the population does not have much respect for human rights, gender equality, or people of other religions. Only looking at the latest Human Rights Watch report on Georgia makes this quite clear.

Looking at inconsistencies between people’s answers to different questions, or between survey findings and other types of data when available and relevant, is a good way to uncover misperceptions. For example, a 2014 CRRC/NDI survey found that roughly every fourth person reports there is gender equality in Georgia. However, about half of those who think so also think that taking care of the home and family makes women as satisfied as having a paid job, and that in order to preserve the family, the wife should endure a lot from her spouse.

The answers to these three questions should be presented and discussed not separately, as independent findings, but rather as interrelated findings that, taken together, give a better understanding of the assessments of and attitudes towards gender equality in Georgia. In this context, the question that needs to be raised and answered is why and how this inconsistency between answers occurs.

The misuse of survey findings happens when findings are presented and used in a way that reinforces people’s misperceptions and prejudices. The misinterpretation of findings often leads to their misuse, and eventually, can lead to serious issues.

Again, going back to the most important issue example, it would be a misuse of survey findings to conclude that since the violation of human rights, religious intolerance or gender inequality seem to not be perceived as important issues in Georgia, no policy is needed to address them. As demonstrated above, alternative sources show that these issues need to be addressed, and, at the very least, awareness of them needs to increase. Thus, policy intervention is needed.

What the survey findings tell us in this case is that people underestimate the importance of these issues. In turn, this contributes to the worsening of the problems. If you believe gender inequality or religious intolerance are not important, you probably would not care about these issues either. Thus, the larger is the gap between public perceptions and reality, the more important it is for policy makers to address the issue.

Public opinion should not be used as a directive for policy making without careful analysis of misperceptions and alternative sources of information.

Unfortunately, in Georgia sometimes it’s exactly the misperceptions that drive policy. Speaking of recent developments, misperceptions about homosexuality have lead politicians to talk more about the prohibition of same-sex marriage, something that has never been allowed in Georgia in the first place, than about human rights issues. Misperceptions about gender roles led politicians to reject a proposal that would define femicide as a premeditated murder of a woman based on her gender. Looking forward, the country cannot allow the misperception that the EU threatens Georgia’s traditions to drive the country’s foreign policy.

Now more than ever, when Georgia is still attempting to transition into a stable, democratic country, the country needs policymakers and researchers who have the knowledge and skills to critically analyze survey findings and use their potential for the development of the country.


Monday, January 16, 2017

Developing the “culture of polling” in Georgia (Part 1): Survey criticism in Georgia

[Note: This is a guest post from Natia Mestvirishvili, a Researcher at International Centre for Migration Policy Development (ICMPD) and former Senior Researcher at CRRC-Georgia. This post was co-published with the Clarion.]

Intense public debate usually accompanies the publication of survey findings in Georgia, especially when the findings are about politics. The discussions are often extremely critical or even call for the rejection of the results.

Normally criticism of surveys would focus on the shortcomings of the research process and help guide researchers towards better practices to make surveys a better tool to understand society. In Georgia most of the current criticism of surveys is, unfortunately, counterproductive and mainly driven by an unwillingness to accept the findings, because the critics do not like them. This blog post outlines some features of survey criticism in Georgia and highlights the need for constructive criticism aimed at the improvement of research practice, because constructive criticism is extremely important and useful for the development of the “culture of polling” in Georgia.

Often, discrepancies between the findings and the critics’ opinion about public opinion cause criticism of surveys in Georgia. Hence, the survey critics claim that the findings do not correspond to ‘reality’. Or rather, their reality.

But, are surveys meant to measure ‘reality’? For the most part, no. Rather, public opinion polls measure and report public opinion which is shaped not only by perceptions, but also by misperceptions i.e., the views and opinions that people have. There is no ‘right’ or ‘wrong’ opinion. It is equally important that these are opinions that people feel comfortable sharing during interviews –while talking to complete strangers. Consequently, and leaving aside deeply philosophical discussions about what reality is and whether it exists at all, public opinion surveys measure perceptions, not reality.

Among the many assumptions that may underlie criticism of surveys in Georgia, critics often suggest that:

  1. They know best what people around them think;
  2. What people around them think represents the opinions of the country’s entire population. 

However, both of these assumptions are wrong, because, in fact:

  1. Although people in general believe that they know others well, they don’t. Extensive psychological research shows that there are common illusions which make us think we know and understand other people better than we actually do – even when it comes to our partners and close friends;
  2. Not only does everyone have a limited choice of opinions and points of view in their immediate surroundings compared to the ‘entire’ society, but it has also been shown that people are attracted to similarity. As a result, primary social groups are composed of people who are alike. Thus, people tend to be exposed to the opinions of their peers, people who think alike. There are many points of view in other social groups that a person may never come across, not to mention understand or hold; 
  3. Even if a person has contacts with a wide diversity of people, these will never be enough to be representative of the entire society. Even if it were, individuals lack the ability to judge how opinions are distributed within a society.


To make an analogy, assuming the opinions we hear around us can be generalized to the entire society is very similar to zooming in on a particularly large country, like Canada, on a map of a global freedom index, and assuming that since Canada is green, i.e. rated as “Free”, the same is true for the rest of the world. In fact, if we zoom out, we will be able to see that the whole world is all but green. Rather, it is very colorful, with most of the countries being of different colors than green, and “big” Canada is no indication of the state of the rest of the world.


Source: www.freedomhouse.org

People who think that what people around them think (or, to be even more precise – who think that what they think that people around them think) can be generalized to the whole country make a similar mistake.

Instead of objective and constructive criticism based on unbiased and informed opinions and professional knowledge, public opinion polls in Georgia are mostly discussed based on emotions and personal preferences. Professional expertise is almost entirely lacking in those discussions.
Politicians citing questions from the same survey in either a negative or positive context, depending on whether they like the results or not, is a good illustration of the above claim. For example, positive evaluations of a policy or development by the public is often proudly cited by political actors without doubting the quality of the survey. At the same time, low and/or decreasing public support for a particular party according to the findings of the same survey is “explained away” by the same actors as poor data quality. Subsequently, politicians may express their distrust in the research institution which has conducted the survey.

In Georgia and elsewhere, survey criticism should be focused on the process of research and should be aimed at its improvement rather than the rejection of the role and importance of polling. It is the duty of journalists, researchers and policymakers to foster healthy public debate on survey research. Instead of emotional messages aimed at demolishing trust in public opinion polls and pollsters in general, rationally and carefully discussing the research process and its limitations, research findings and their meaning/significance and, where possible, pointing to possible improvements of survey practice is needed.

Criticism focused on “unclear” or “incorrect” methodology should be further elaborated by professionally specifying the aspects that are unclear or problematic. Research organizations in Georgia will highly appreciate criticism that asks specific questions aimed at improving the survey process. For example, does the sample design allow for the generalization of the survey results to the entire population? How were misleading questions avoided? How have the interviewers been trained and monitored to minimize bias and maximize the quality of the interviews?

This blog post argued that survey criticism in Georgia is often based on inaccurate assumptions and conveys messages that are not helpful for research organizations from the point of view of improving their practice. These messages are also often dangerous as they encourage uninformed skepticism towards survey research in general. Rather than these unhelpful messages, I call on actors to engage in constructive criticism which will contribute to the improvement of the quality of surveys in Georgia, which in turn will allow people’s voices to be brought to policymakers and their decisions to be informed by objective data.

The second part of this blog post, to be published on January 23, continues the topic, focusing on examples of misinterpretation and misuse of survey data in Georgia.

Thursday, December 22, 2016

Electoral forensics on the 2016 parliamentary elections

In order to help monitor the fidelity of the October 2016 parliamentary election results, CRRC-Georgia has carried out quantitative analysis of election-related statistics within the auspices of the Detecting Election Fraud through Data Analysis (DEFDA) project. Within the project we used methods from the field of election forensics. Election forensics is a field in political science that attempts to identify election day issues through looking at statistical patterns in election returns. This blog post reports the results of our analysis of the 2016 proportional election results. The full report of the analysis is available here.

Our analysis suggests that the results of the 2016 elections were roughly equivalent to the 2012 proportional list elections.

Before going further into the results, two caveats and a note on methods are needed. To start with the two caveats:

  • Results are probabilistic. A test may return a statistically anomalous result, and this suggests that a given result is highly unlikely to have occurred by chance alone. The way in which we calculate the test statistics is likely to provide 1 false positive for every 100 tests performed.
  • If a test does suggest a statistical anomaly, it does not necessarily mean that election-related malfeasance caused the result, but that it may have. Statistical anomalies can be caused by benign activities such as strategic voting or divergent voting patterns within a region. Electoral malfeasance does often cause a positive test result, however. Hence, substantive knowledge and judgment of each positive test are required to determine whether malfeasance actually did occur.

When it comes to methods, to be frank, they are relatively complex. Rather than dive into the details here, we recommend that interested readers see Hicken and Mebane, 2015, here. Below we present the results of the following election forensics tests:

  • Mean of second digit in turnout;
  • Skew of turnout;
  • Kurtosis of turnout;
  • Means of the final digit in turnout;
  • Frequency of zeros and fives in the final digit in turnout;
  • Unimodality test of turnout distribution.

Results

In 2016, three of the six tests were set off:


By comparison, in 2012 two of six tests were also set off. However, one test – of the second digit mean – was exceptionally close to being set off. Due to the nature of the method – bootstrapping uses resampling with replacement – this test just as well could have been set off if run again.


Given the borderline nature of the 2012 tests, providing a conclusive comparison of the two elections is somewhat difficult. However, since the test results are roughly equivalent, the tests are indicative rather than definitive, and the elections by most accounts have been considered broadly free and fair, despite having clear issues, and the 2012 elections were considered to be broadly free and fair, despite also having clear issues, we consider the 2016 election results to also be broadly free and fair.
For more on the subject, take a look at our final report for the DEFDA project, available here.

Note: The DEFDA project is funded by the Embassy of the United States of America in Georgia, however, none of the views expressed in the above blog post represent the views of the US Embassy in Georgia or any related US Government entity.

Monday, December 19, 2016

Number of logical inconsistencies in 2016 election protocols decline

Following the 2016 parliamentary elections, a number of politicians questioned the results based on logical inconsistencies on election protocols. Some of the election protocols, which summarize election results for individual voting stations, reported that more voters had come to the polls than actually cast ballots while others reported that more votes had been cast than voters came to the polling station.  While both did happen, the Central Election Commission has made dramatic improvements compared to Georgia’s 2012 parliamentary elections.

In the 2012 parliamentary elections, according to an analysis of data the Central Election Commission provided, in the proportional list elections alone there were over 30,000 more voters that came to the polls than cast ballots. In 2016, there were less than 3000 such voters – a clear improvement.

Not only were there more voters than votes in many precincts – there were more votes cast than voters that came to the polls, again according to the official record. In the 2012 parliamentary elections, there were 696 more votes than signatures for those votes. By comparison, in 2016 there were 76 – again a clear improvement.

A third logical inconsistency present in the data is declining turnout. In the 2012 elections, in 8 precincts, there were more votes at 12PM than at 5PM. That is to say that the precincts recorded declining turnout. In 2016, by contrast, only one precinct reported declining turnout, again, a clear improvement.


While the CEC has clearly improved its recording of the vote in 2016, and small mismatches are bound to happen, any voter may reasonably ask themselves – if the CEC cannot make election protocols add up, how do I know my vote counted? Thus, we strongly recommend that the CEC make efforts to minimize the number of logical inconsistencies in future elections. Some recommendations on how the CEC might do so are available in our report on the 2016 elections.

Note: The DEFDA project is funded by the Embassy of the United States of America in Georgia, however, none of the views expressed in the above blog post represent the views of the US Embassy in Georgia or any related US Government entity.


Tuesday, June 28, 2016

CRRC’s Fourth Annual Methodological Conference: Research for Development in the South Caucasus

CRRC’s fourth annual Methodological Conference took place on June 24 and 25, 2016 in Tbilisi. Over 50 participants representing numerous institutions from seven countries attended.


David Lee, Chairman of CRRC’s Board of Trustees, opened the conference highlighting the importance of the issues discussed at the conference not only for the region, but also for the world.


The conference had a wide variety of workshops, such as Koen Geven’s  workshop on Causal Inference and Estimating Treatment Effects and  Julie A. George’s Methodological Approaches to Estimating Voter Fraud.


With four conference sessions focused on migration, politics, ideology and media, and gender inequalities in the labor market, the conference participants – academics and policymakers alike – had the opportunity to discuss the challenges with and ways forward towards generating more reliable knowledge on the issues.


CRRC-Georgia’s President, Koba Turmanidze, closed the conference noting that next year’s Methodological Conference will continue to focus on policy research and methodological issues, which can lead to better development policy in the region.

For more information, the full conference program can be accessed here.

Saturday, August 08, 2015

What do CB interviewers’ ratings of respondents’ intelligence tell us?


CRRC’s Caucasus Barometer (CB) surveys regularly collect information about how the interviewers assess each of the conducted interviews – so called paradata that provides additional insight into the conditions surrounding the interviews (e.g., whether someone besides the respondent and the interviewer was present during the face-to-face interview), as well as interviewers’ subjective assessments of, for example, level of sincerity of the respondents. This type of knowledge is especially important not only because the populations of the South Caucasus countries often distrust polling and pollsters (Hayes et al., 2006), but also because the conditions during the face-to-face interviews are rarely perfect in the region. The latter usually stems from objective reasons, like, for example, crowded dwellings (especially in the winter, when families normally heat only a few rooms, where all household members tend to gather). This blog post looks at the information provided by CB 2013 Interviewer Assessment Forms in Armenia, Azerbaijan and Georgia, trying to determine whether there is a bias in interviewers’ assessments. Specifically, we will have a look at interviewers’ ratings of respondents’ intelligence.

Overall, CB interviewers tend to rate the majority of respondents as average to (moderately) intelligent, but rarely as “very intelligent”. Interestingly, Georgian interviewers’ ratings are more skewed towards the positive edge of the scale, compared to those in Armenia and Azerbaijan.


Note: The data was not weighted for the analysis performed for this blog post. 

These figures, of course, in no way provide objective assessments of the intelligence of the respondents – neither was it the aim of this exercise. We will now look at how these assessments correlate with respondents’ answers on their basic socio-economic characteristics, including gender, age and level of education.

In all countries, there is a strong positive correlation between interviewers’ assessment of intelligence of the respondents and the two variables measuring respondents’ level of education - highest level of education achieved by the respondent, and the years s/he spent in formal education. The strength of correlation is somewhat stronger in Azerbaijan (.549 for the first variable) and somewhat weaker in Georgia (.455) and Armenia (.468).

Azerbaijan is the only country where, according to CB 2013, there is a relatively weak, but significant correlation between interviewers’ assessment of respondents’ intelligence and the respondents’ gender (-.192), suggesting that there is a systematic tendency to rate male respondents’ intelligence higher than that of females’. This finding is all the more interesting since a bit over half of CB2013 interviewers in Azerbaijan were female (22 male interviewers, 24 female interviewers). In all countries, there is a tendency to rate the intelligence of those living in the capital cities higher than those living in other settlements – the respective correlation coefficients are not high (-.094 in Azerbaijan, -.119 in Georgia and -.155 in Armenia), but are significant. There is, however, no correlation between these assessments and respondents’ age.

Interviewers’ ratings of respondents’ intelligence do not seem to be straightforwardly related to the attitudes towards democracy, or reported trust towards major social and political institutions, although respective findings differ by countries. It’s only in Georgia that we can see weak, but negative correlation between trust towards the president of the country and assessment of respondent’s intelligence by interviewer (-.141), while the correlations between these variables are not significant in Armenia and Azerbaijan.  

What other variables might, in your opinion, affect an interviewer’s assessment of a respondent’s intelligence?

You can have a look at CB’s Interviewer Assessment Form at the end of each CB questionnaire, e.g., here; and, of course, you can learn all about CB data on CRRC’s Online Data Analysis tool.


Tuesday, June 30, 2015

CRRC’s third annual Methodological Conference: Transformations in the South Caucasus and its Neighbourhood


The third annual CRRC methodological conference took place on June 26 and 27 at Rooms Hotel, Tbilisi. With over 50 participants and a packed program of presentations, workshops, and speeches the conference drew together policy practitioners and researchers from the South Caucasus and beyond.

Rory Fitzgerald, Director of the European Social Survey and Senior Research Fellow at City University London, delivered an engaging workshop on the challenges of cross-national surveys using the example of the European Social Survey (ESS).


Mihaylo Milovanovitch, Network Fellow at the Edmond J. Safra Center for Ethics, gave a memorable presentation on a method for measuring ethics in the Armenian education system. The research linked corruption with educational outcomes in Armenia.


Alexi Gugushvili, an Academic Swiss Caucasus Net (ASCN) Research Fellow in South Caucasus Studies at the Russian and Eurasian Studies Centre of the St Antony’s College, University of Oxford, delivered the final keynote speech, Money Can’t Buy Me Love: Foreign Land Ownership Regime and Attitudes in Georgia.  In the speech, Alexi argued that the land ownership debates of recent years in Georgia arise from “the confluence of factors such as the communist legacy, historical memory, rural nationalism, agricultural underdevelopment and inequality”.

For more information, the full program and some of the papers presented at the conference can be accessed here.

Sunday, June 29, 2014

CRRC Methodological Conference on Measuring Social Inequality in the South Caucasus and its Neighborhood

The second annual CRRC methodological conference took place on the 25th of June at Tbilisi State University. With over fifty attendees and a packed program of presentations, the conference drew together policy practitioners and researchers from the South Caucasus and beyond.

This year, for the first time, there was also a number of pre-conference workshops on the 24th of June at the CRRC-Georgia offices. Michael Robbins of the Arab Barometer presented on the matching techniques he has used to examine the Arab Spring, and Mihail Peleah from UNDP Europe and CIS presented an introduction to the methodology behind the UNDP’s Social Exclusion Index.


These provided an excellent introduction to the themes of social inequality in the South Caucasus and its wider neighborhood, also giving participants an opportunity to reflect on the implications of the methodological choices that we make on the results that we generate. There was a lively discussion about how to define and work with broad topics like social exclusion and inequality, and participants showed a keen interest in how these concepts had been applied in the Arab world, North Africa, Eastern Europe and Central Asia.

During the main conference, the geographic scope was expanded further to include in-depth studies on access to higher education, water subsidies and migration push factors in Armenia, inequality in educational achievement, local government performance, and domestic violence in Georgia, access to the benefits of a more technologically connected world in Azerbaijan, visual sociology in the post-soviet space, and data collection and visualization across the South Caucasus.
The broad geographic and methodological scope of the studies, as well as the high standard of papers received made this an excellent second edition to the CRRC series of methodological conferences in the South Caucasus. For more information, the full program and papers presented at the conference can be accessed here.
