Showing posts with label Index. Show all posts

Thursday, January 22, 2015

A taxi driver’s tale, Part 2: The poverty of social status in Georgia


Looking at the association between an individual’s social status and his/her standing in the labor market, the first part of this blog post concluded that higher labor market mobility is characteristic for people with high social status, and that those with high social status have better chances of finding an attractive job. Yet, the question remains whether people with higher social status actually live better lives i.e., enjoy economic well-being and have better perceptions about their and their children’s future. To answer this question, this blog post examines how social status is associated with individual and household well-being. Data again comes from CRRC’s 2013 Caucasus Barometer (CB) survey.

According to Geostat, the subsistence minimum in Georgia was GEL 137 in 2013 (approximately USD 80). CB 2013 asks a question about personal income last month, but the answer options are given in categories (income ranges). The subsistence minimum of $80 falls into the category between $51 and $100. It is used in the blog post as a reference category to compare, on the one hand, individuals with higher incomes and, on the other hand, individuals with lower incomes. The group of respondents reporting not having personal income are considered a separate group.

As expected, social status is positively associated with personal income. Almost half of the representatives of the high social status group made more than $100 last month, whereas only 30% of the low status group and 36% of the middle status group managed to exceed the same threshold. Interestingly, the no income category prevails in the high and middle social status groups. One in every three people in these groups reports having no personal income compared to one in every four in the low status group.

Unsurprisingly, the higher its social status, the more money a household spends. Geostat reported GEL 900 (approximately USD 500) as average monthly household expenditures in 2013. In CB’s corresponding question, this falls into the category between $401 and $800. Again, this is used as a reference category to differentiate households spending more than the average from households spending less than the average. A higher social status is still positively associated with higher spending. However, the overall economic condition of Georgian households looks quite poor. As the chart below shows, even in the high social status group, the majority of households spent under $401 last month, and only 19% spent more than the reference category. In the low social status group, almost everyone (91%) spent less than the reference category, meaning that the low status group households spend significantly less than Georgian households on average.


The poor economic condition of the majority of the Georgian population is confirmed by CB questions about personal savings and debt. The vast majority of Georgians do not have savings, regardless of their social status. However, the high social status group (17%) is almost twice as likely to have some savings compared with members of the low (8%) and middle (9%) status groups. Likewise, money is more often owed to the representatives of the high status group (25%) compared to the middle and low status group members (18% and 12% respectively). The data does not show significant differences in terms of personal debts. Approximately 40% of each group reports owing money.

So far, it has been demonstrated that high social status is helpful to overcome economic hardship, but does not guarantee it. The reported gap between a household’s income and the amount of money it needs to cover its basic needs reinforces this statement. Half of the high status group representatives affirm that during the past 12 months there were occasions when their household did not have enough money to buy food. In the middle and low status groups, more than 70% reported the same. Moreover, the majority of the middle and low status groups and 40% of the high status group had to borrow money to cover utilities in the past six months.

The chart below shows that even representatives of the high social status group can largely satisfy only basic needs. Half reported that money is enough for food and clothes, but not for expensive durable goods (a new refrigerator or washing machine, for example). In the low status group, 35% stated that money is not enough even for food. Interestingly, a quarter of the middle and one in every ten of the high status group report facing the same problem.


It is not surprising that the poor economic realities of households are reflected in perceived place on an imaginary economic “ladder”. The chart below shows that only 19% in the high social status group perceive their household’s economic rung as high (45% place their households on the middle rungs and about one third towards the lower end). In the middle and low social status groups, the majority believes their households stand on the low rungs (46% and 54% respectively).

Note: Original answers were on a 10-point scale. For this graph, answers were re-coded as follows: rungs 1 through 4 – Low, rungs 5-6 – Middle, rungs 7 through 10 – High. 

At the same time, belonging to a higher social status group helps people to be more optimistic – 71% of the high status group believes that they will be better off in five years. Despite pressing current economic conditions, the other two groups are also quite optimistic – 57% of the middle and 43% of the low status group believe in a better future. Optimism absolutely flourishes, and the relevance of current social status fades when individuals contemplate their children’s future. Over 90% of all social status groups believe in a brighter financial situation for their descendants. Notably, all three status groups agree that the most important factor that will contribute to the well-being of the next generation is education.

This blog post described how social status is associated with economic well-being and perceptions about the future. The most important message to the taxi driver is that a higher social status in contemporary Georgia leads to more mobility on the labor market, as well as relatively higher income and spending. However, social status alone is hardly enough to overcome poverty and substantially improve well-being. Perhaps this explains why a man with more than one university diploma chooses to continue driving a taxi.

Monday, January 19, 2015

A taxi driver’s tale, Part 1: Social status in the Georgian labor market


Taxi drivers tell perhaps the most telling story of Georgia’s economic transition. They often complain that the transition made their high social status useless, thus pushing them into taxi driving. This often heard and mocked complaint highlights the contrast between what is expected from and what is delivered by the labor market. Taxi drivers expect their social status to remain at work in economic life, while the mockers believe that social status has no relevance for Georgia’s current labor market. Based on CRRC’s Caucasus Barometer (CB) survey data, this blog post shows that the taxi drivers are not entirely wrong. According to 2013 Caucasus Barometer survey, higher social status is associated with a higher likelihood of employment, a better job, and greater mobility on the labor market.

The taxi drivers often “operationalize” their social status as having a diploma or two from one or more higher educational institutions. In Georgia, another common cue to signal high social status is family background, normally operationalized in the same way. Not only are these two cues at the core of the taxi driver’s tale, but notably, the same characteristics often prevail when traditionally selecting a favorable bride or groom. Hence, the two cues fit the Weberian understanding of social status as perceived prestige and esteem that is related to economic relations, but cannot be reduced to it.

Following the taxi drivers’ perspective, this post proposes a simple index of social status, which includes two components: (1) respondent’s level of education, and (2) level of education of the respondent’s parents. In both cases, education variables are recoded so as to have three categories: (1) secondary or lower education, (2) secondary technical education, and (3) incomplete or complete tertiary education.

The index is a simple sum of these indicators and hence, it ranges from 0 to 4. At the highest extreme of the index stands a person with tertiary education having at least one parent with tertiary education (score 4). A person without any of these characteristics stands at the lower extreme of the continuum (score 0). Individuals with scores between the extremes are counted as having middle social status. As shown below, more than half the population belongs to the middle status group, whereas 28% and 19% fall into the low and the high social status groups respectively.  


Looking at the distribution of social status groups across settlement type, age and gender, it is notable that 39% of Tbilisi residents are in the high status group compared to only 7% of residents of rural areas. Low (42%) and middle (51%) status groups are predominant in rural areas. Urban settlements outside the capital have the highest percentage of the middle status group (62%). Interestingly, no important differences can be observed by gender. Younger cohorts tend to have higher education as well as more educated parents compared to older cohorts, and are thus more likely to belong to a higher status group.  

But, does social status have implications for an individual’s standing on the labor market? The Caucasus Barometer uses several questions to measure respondents’ employment status. While those who are employed or self-employed are identified using one survey question (“Which of the following best describes your situation?” with answer options including “Working either part-time or full-time” and “Self-employed”), identifying the unemployed is a trickier affair. To do so, it is necessary to separate those who do not work by choice and those with physical constraints to labor force participation from those who do not work resulting from a failure to find a job, i.e. the unemployed. To identify the latter group, a combination of two questions has been used - is the respondent interested in a job and if so, is he or she ready to start working within two weeks if a suitable job were available. Respondents who do not meet these two conditions are not formally unemployed and are not counted as part of the active labor force.  

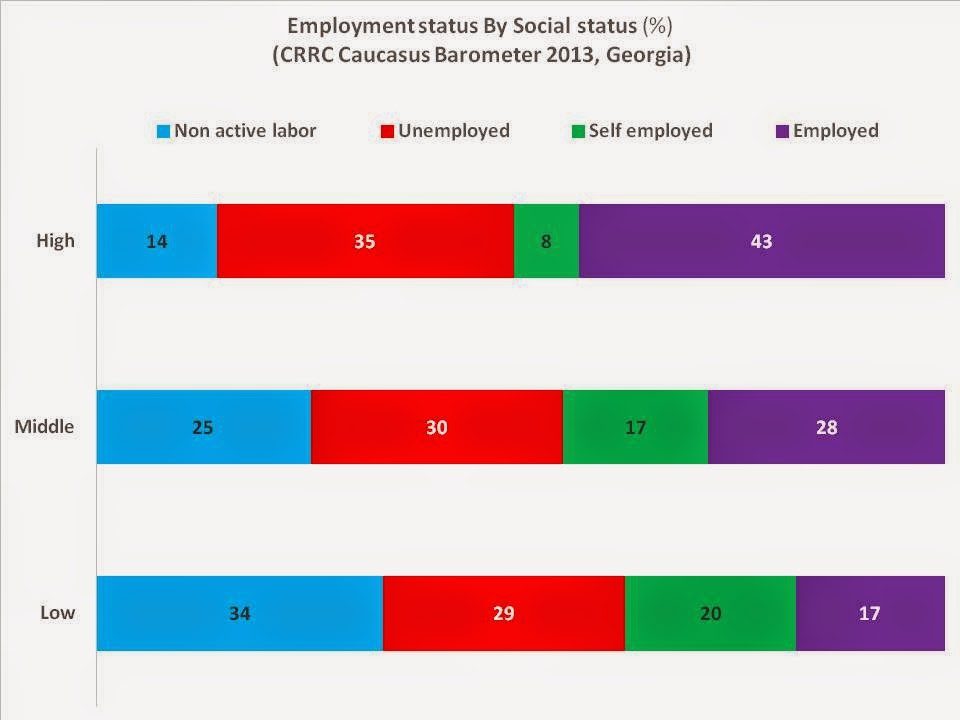
From cross-tabulating an individual’s social status and his/her employment status, it is evident that the plurality of the low status group is out of the labor force (34%) or unemployed (29%). In contrast, the plurality of the high status group is employed (43%). However, it is noteworthy that one in three of the high social status group is unemployed (35%), while almost half of the individuals with low social status, on the other hand, were never employed.


Thus, the higher the individual’s social status, the higher his/her employment chances. Moreover, the status group a person belongs to indicates his/her occupational status. More than half of the high social status group works in high status positions, i.e. managers and professionals. A plurality of the low social status group (41%) works as unskilled laborers (elementary occupations, sales people, and baby sitters). Nonetheless, the majority of the low and middle status group enjoy mid-level occupations, such as technician, clerk, or skilled agriculture worker.

Note: The variable used to measure occupational status is JOBDESC. Respondents were asked, “Which of the following best describes the job you do?” Suggested answer options included: Manager; Professional; Technician / Associate professional; Clerical support worker; Service / Sales worker; Skilled agricultural / Forestry / Fishery worker; Craft and related trades worker; Plant and machine operator / Assembler; Elementary occupation; and Armed forces occupation. For this blog post, the options “Manager” and “Professional” were combined into the category ‘high’. “Armed forces occupations”, “Plant and machine operators”, “Craft and related trade workers”, “Skilled agricultural workers”, “Clerical support workers”, and “Technicians” were combined into the category ‘middle’, and “Elementary occupations” and “Service/sales workers” were grouped into the category ‘low’.  

Social status is also associated with employment sector and type of work for those who work. People who belong to the high status group rarely own businesses (18%) and are generally either state employees (41%) or employees of private companies (40%). At first glance it may seem paradoxical that those in the lower status group are more likely to own a business (55%), however, taking a closer look at Georgian reality makes it clear that these business owners are mostly self-employed agricultural workers or petty traders. Those in the middle status group are more or less equally distributed between the public, private and self-owned business sectors. As noted, people belonging to the low and middle status groups are more likely to work in agriculture (40% and 19% respectively). Individuals in the high status group are employed by educational institutions (24%) more often than in any other sector.

Importantly, the data shows that the Rose Revolution marked an important threshold for the Georgian labor market. The majority of employed individuals of all status groups started working at their primary workplace after 2004. This year perhaps also marked an important shift in the structure of the economy as 46% of the high and 33% of the middle status groups lost their job after 2004.
Not only are high status individuals more mobile, but so too are their household members who were more than twice as likely to find a new job in the last 12 months compared to the household members of individuals belonging to the low status group (16% vs. 7%). However, exactly the same was true about losing a job in the last 12 months – household members of those in the high status group lost jobs twice as often as those in the low status group.

This blog post has shown that the taxi driver’s tale of frustration has an observable underpinning – social status, operationalized as an individual’s and his/her parents’ education, is associated with an individual’s standing on the labor market. People belonging to the high status group are more likely to be employed, generally have better jobs, and exhibit greater mobility on the labor market. Hence, the preliminary conclusion drawn from this blog post is optimistic for the taxi driver, who perceives his current job as inferior to his status. If he belongs to a high social status group, he is more likely to find a better job. The second blog post in this series will describe how social status is related to household income and spending, as well as an individual’s perceived economic rung.

Tuesday, October 05, 2010

Armenia’s ranking in the World Governance Indicators

The recently updated database of the World Governance Indicators (WGI) shows an improvement in Armenia’s ranking in political stability, fight against corruption, government effectiveness and regulatory quality. A project of World Bank and Brookings Institution, WGI provides governance ranking of over 200 countries since 1996 on six indicators: Voice of Accountability, Political Stability and Absence of Violence, Government Effectiveness, Regulatory Quality, Rule of Law and Control of Corruption. WGI uses a 0-100 percentile ranking indicating the rank of the country among all countries in the world where 0 is the lowest and 100 the highest rank. Despite the reported progress, however, Armenia is still at the lower 50 percentile of the countries included in the study.

Where does Armenia stand in the list of the post-Soviet countries? Armenia is scoring higher than most of the post-Soviet countries (excluding the Baltic states) on all the indicators except Political Stability and Voice of Accountability. Armenia’s score on Voice of Accountability, an indicator capturing citizens’ participation in selecting the government, freedom of expression, freedom of association and free media is not only low, but it has deteriorated over the last decade.

Armenia along with the rest of the post-Soviet countries is also ranked low on the Control of Corruption indicator, with the majority of the countries at the 0-25 percentile. Georgia is scoring significantly better than other post-Soviet countries.


Actually, Georgia is leading the list of the post-Soviet countries on all the indicators except the Political Stability and Absence of Violence indicator, where it is ranked at the same percentile with Russia, Uzbekistan and Tajikistan (0-25 percentile). In the light of the contested presidential elections of 2008 it is rather surprising that Armenia (ranked at the 25-50 percentile) has recorded improvement on the indicator since 2004.

The aggregate indicators combine the views of large samples of the citizens, experts, enterprises and other available indexes. Detailed methodology and documentation is available on the WGI website. The website also provides a user friendly analysis tool, which creates tables and maps by country, allowing also by year comparisons. Full dataset are publically available and can be downloaded here. And, as always, a reminder that CRRC has done a comprehensive corruption survey of households and business, with materials available here.

Monday, September 20, 2010

The 2010 World Giving Index

By David McArdle

In recent weeks, CRRC have focused on levels of happiness and satisfaction in the Caucasus. In line with this theme, the World Giving Index 2010 (WGI) has released their latest figures, which they hope will act as a marker of cohesiveness in a society.

Charities Aid Foundation (CAF) published the WGI report, discussing how they believe that almost all countries, cultures and faiths have their own traditions of giving which are complex and shaped by their history, customs and religion.

The report finds that the association between happiness and giving is greater than that of national GDP, or wealth, and giving. Perhaps the level of giving in a country speaks to the strength of its civil society – the extent to which individuals are willing and able to contribute towards addressing the needs of others both in their own localities and across borders.

The results of the WGI placed Australasian neighbours Australia and New Zealand in the top two positions, respectively. As for the Caucasus countries, Azerbaijan was placed as the top country in the Caucasus with regard to giving, ranked 67th out of the 153 countries listed on the WGI, sharing its spot with Botswana, Mongolia, Mexico and Mauritius.


Meanwhile, Armenia was 115th and shared its ranking with El Salvador, Ecuador and Latvia.

Finally, Georgia was situated at a rather low 134th, joined alongside India, Turkey and Cote D’Ivoire (and please refer to the Index’s methodology section for an insight into how ‘giving’ is defined. For instance, the Index regards the term ‘giving’ as not exclusively connected with the donation of monies).


For access to the colourful and accessible report in full, please follow the link to CAF’s site. We’d like to thank Jonathan K. for drawing our attention to this.

Tuesday, August 10, 2010

Life Satisfaction: Denmark, Georgia & Moldova Compared

By David McArdle & Jesse Tatum

On a roll with the life satisfaction comparisons, we were curious to place Georgia within a broader context. Using the 2006 Life Satisfaction Index (LSI), which uses subjective well-being indicators to measure people’s levels of life satisfaction and happiness, we chose Denmark, ranked the ‘happiest’ country on earth, and Moldova, the post-Soviet state considered the least happy, as the respective benchmarks (see Table 2, an abridged version of the LSI at the end of this post). Then, with data from the 2008 European Values Survey (EVS) we were able to analyze in greater depth any observations which may or may not pertain to greater life satisfaction with regard to the three divergent states.

Firstly, the EVS shows that far more Danes claim to be completely satisfied with life compared with Georgians and Moldovans. The raw numbers themselves are telling: in all, nearly 30 percent of the Danes polled claimed to be completely satisfied with life. Secondly, the EVS data revealed that over twice as many Moldovans than Georgians claimed complete life satisfaction (186 vs. 79; see Table 1). These numbers are fascinating all the more so because Moldova is ranked marginally lower on the LSI than Georgia.


For the large number of Danes completely satisfied with life, factors such as life control, stated happiness, health and national pride seem to play a more determining role compared with those completely satisfied with life in Georgia and in Moldova. The number of those who ranked religion as very important, however, did not rise with increased satisfaction.

Similar to Denmark, those completely satisfied with life in Moldova also indicated that they are more in control of life and happier compared with respondents in Georgia. The importance of religion was, as in Denmark, less acute than in Georgia.

Life Control, aka ‘agency’

It is in ‘happy’ Denmark but also, surprisingly, in ‘unhappy’ Moldova where the respondents completely satisfied in life also more often stated that they have greater control over their lives. In Georgia, however, those who are completely satisfied with life did not answer that they are also in control of it with the same frequency as in the other two countries. Feeling in control of life, then, seems to play less of a role in Georgia in terms of life satisfaction than it does in the world’s happiest country and in the least happy post-Soviet state.

In Denmark a clear majority of 72 percent of those fully satisfied with life chose marks 8–10 on the scale where ‘10’ equals complete control over one’s life. In fact, in further confirming the recent label of ‘world’s happiest’, only 25 of all the Danes polled said they were completely dissatisfied with life.

With Moldova the case for greater life control and greater life satisfaction commingling is almost as clear as in Denmark. Though far fewer people overall indicated total life satisfaction, fully 62 percent of the satisfied respondents said that they also had a great degree of control over their life. At least in Denmark and Moldova, perhaps being in control of life may help to steer one’s perceptions of life satisfaction in a positive direction.

Compared with both Denmark and Moldova, life control appears to be less of a factor in leading Georgians to higher levels of assessed life satisfaction. For example, nearly the same percentage of the respondents fully satisfied with life and those completely dissatisfied with life said they have a great deal of control over their life (38 percent vs. 36 percent).

Happiness

As was duly noted in the previous blogs, the South Caucasus respondents’ answers on life satisfaction and on subjective happiness generally are not parallel. People say that they can be happy without being satisfied in life, and vice versa. But the EVS figures on Denmark appear to buck this trend, as satisfied Danes are also happy Danes. In all, 75 percent of those completely satisfied with life also asserted to be ‘very happy’.

In Moldova, too, people completely satisfied with life also answered that they were ‘very’ or ‘quite happy’ (28 percent and 63 percent, respectively). In fact, the answer patterns of Moldovans satisfied in life rose accordingly with levels of greater happiness, revealing that perhaps the two do complement each other in the country, in contrast with Georgia. In addition, this shows that although Danes are said to be happier than Moldovans in general, the responses follow a similar pattern: completely satisfied respondents in both countries also say that they have greater life control and are happier, compared with Georgia.


Health

Life satisfaction levels and health are factors which correlated strongly in the LSI study. Similarly, the EVS data reveals that this potential link is far more pronounced in Denmark than it is in Georgia and Moldova. In Denmark 58 percent of respondents who were completely satisfied with life said too that their health was ‘very good’.

In Moldova, however, of those who feel completely satisfied in life, only 11 percent replied that they were in ‘very good’ health. The majority of the respondents (72 percent) claimed to be in either ‘good’ or ‘fair’ health. What is more, 17 percent of those who were completely satisfied in life stated that they were either in ‘poor’ or ‘very poor’ health, a marginally higher number than those who considered their health to be ‘very good’.

In Georgia people with greater life satisfaction were less likely than their Danish counterparts to say they were in ‘very good’ health. For example, Georgians completely satisfied with life are more likely to be in ‘good’ (45 percent) than in ‘very good’ health (27 percent). Moreover, on the opposite end of life satisfaction, sizable numbers of Georgians completely dissatisfied with life said they were in ‘poor’ or ‘very poor’ health (27 percent and 17 percent, respectively), figures which were much higher than those in Denmark.

In short, according to the combination of the responses, health could possibly be associated with helping people to fend off dissatisfaction rather than acting to yield complete life satisfaction. In Denmark a stronger linkage can arguably be made whereby very good health equates with complete life satisfaction. However, this same link between greater health and greater life satisfaction is less evident from the responses in Georgia and Moldova, as even those completely satisfied with life are more likely to see themselves in fair health than in very good health.

Pride in one’s country

If judged by the answer patterns in the three countries, greater national pride sits alongside higher life satisfaction only in Denmark, where 61 percent completely satisfied with life also are ‘very proud’ of being a Danish citizen, whereas only 1 percent of those completely satisfied said they were ‘not at all proud’ of being a citizen. In Moldova, however, being ‘very proud’ of being a national citizen was far less important for life satisfaction levels. And in Georgia nearly all indicated that they are proud of being a Georgian citizen, even for those completely dissatisfied with life (71 percent). Similar to religion, for instance, these figures show that feelings of pride in one’s country can flourish without high levels of life satisfaction.

The figures in Moldova, a country divided, reveal that both those satisfied and those dissatisfied in life were lukewarm on the issue of national pride. Overall, more people said they were still ‘very proud’ (36 percent of those completely satisfied) than otherwise, but the figures were much lower than in Denmark and Georgia, with more people choosing the second option (‘quite proud’) and higher numbers selecting ‘not very proud’, compared with the other two countries.


Religion

The Georgians, whether satisfied or not, appear to cherish religion uniformly. Completely satisfied Danes, however, seem to answer in general consensus (51 percent) that religion is not as important irrespective of life satisfaction levels. Whilst the Moldovans, more often than not, responded that religion is quite important regardless, once again, of life satisfaction scores. In other words, the importance one places on religion appears to be a country-specific issue and does not tie in with overall life satisfaction levels.

Conclusion

Of course there are massive political, social, and economic differences between these three countries. But we wanted to use them here as benchmarks within Europe with which to compare Georgia, as one would in other major indices (e.g. TI’s Corruption Perceptions, the Big Mac, and the Human Development Indices). In the final analysis, however, the results are still fascinating and call for further research. For this, the EVS {HL} offers a supremely user-friendly interface with which one can explore the data sets to find other factors which may help to explain why some countries are happier than others.

Friday, July 02, 2010

Post-Soviet States’ Democratic Decline: Results from Freedom House Report

Freedom House has just released its Nations in Transit report for the year 2010. The report attempts to quantify democratic development in Central European and Eurasian states by observing 8 separate factors – for instance, Electoral Process and National Democratic Governance - which affect the level of democracy in a given country. Each category is graded on a score of 1 to 7, with 1 representing the highest level of democratic progress, and 7 representing the lowest. Much of the media attention has typically focused on Russia. The report concluded with a new low for Russia with regard to its democracy score (6.14) and an overall rapid decline in the last decade attributed mostly to the Putin’s extreme centralization policies. However, it is important to look too at the lack of progress being made in the South Caucasus countries and what this may mean for future democratic efforts in a region prevalent to Russia’s foreign policy goals. Of the South Caucasus countries, democratic development in Georgia and Armenia remained stagnant, while in Azerbaijan it deteriorated.


Armenia’s scores remained exactly the same as those in the previous year, having fluctuated up and down by half a point over the last decade. Of particular concern is the level of corruption in Armenia, which many Armenians claim as having a negative impact on their everyday lives. The corruption rating remained at 5.5 and down from a decade-long trend of 5.75. Similarly, ratings for the country’s electoral processes, national democratic governance, and judiciary remained the same as the year before. To view CRRC's reports on corruption in Armenia, please click here.


Georgia’s scores also remained the same as those in 2009. Of great concern is Georgia’s level of national democratic governance. Whilst the national democratic governance rating remains at an uncomfortable 6.0, the report notes that despite political unrest and demonstrations, both protestors and the government mostly refrained from violence, which had been a severe problem in previous years. As a result, it may be construed that Georgia is making certain attempts at progress in this realm.


In Azerbaijan democratic progress regressed somewhat from the previous year, particularly in the area of judicial independence. In the NIT report, the judiciary is characterized as dependent upon the executive branch, whose power it helped to expand by supporting the 2009 referendum on the constitution. It is also judged to be highly corrupt, inefficient, and that it provides no mechanism for human, property, or civil rights violations. Like Russia, overall democratic progress in Azerbaijan has steadily deteriorated over the last decade.


Each category measured by the report for Russia has experienced either a decrease in democratic scores or has remained the same. In other words, the report has found no signs of improvement in any of the 8 categories. The overall democracy score has slipped from 4.58 in 1999-2000 to an “abysmal” 6.14. Whilst Russia views the South Caucasus as within its sphere of influence it is clear that Russia can offer little in the way of guidance when democracy promotion is concerned.


To see other posts on this blog on previous Freedom House reports, please click here.

Tuesday, August 25, 2009

Failed States Index 2009 | Rankings for the South Caucasus

The US magazine Foreign Policy and the D.C. think tank Fund for Peace released their 2009 rankings of failed states, presenting Armenia as a “borderline” state and Georgia and Azerbaijan in the “in danger” category.

Thanks to last year’s war and protests, Georgia jumped up to #33 from #57 in 2008 and is now nestled between Sierra Leone and Liberia on the list. Azerbaijan stands at #56, and Armenia is ranked the most stable of the three at #101.

According to this study, “failed states” come in many guises, including those that have lost control over their territory, have poor state authority, fail to provide adequate public services, or cannot interact with other states in the international community.

The rankings are based on 12 indicators of state instability and vulnerability. Georgia’s worsening score on many of these can be traced back to the August 2008 war and its fallout: “Refugees/IDPs” (from South Ossetia and Abkhazia), “Group Grievance” (in the breakaway regions), “Delegitimization of the State” (mass protests), “Public Services” (failure to protect citizens from violence), “Factionalized Elites” (political opposition), and of course, “External Intervention.”

Both Armenia and Azerbaijan rate poorly on “Refugees/IDPs,” likely due to the frozen Karabakh conflict. Armenia’s worst score is in state legitimacy, possibly from high levels of corruption. Azerbaijan also gets poor scores on state legitimacy and security -- although, oddly, scores better than Georgia on human rights.

The methodology used to determine the rankings is rather opaque. The indicator scores are based primarily on keyword hits on full text open source articles and reports. This leads one to wonder whether the sheer amount of media attention on a given country has an impact on the results, but without more detail about the data collection, it is difficult to know.

The full results can be found here.

Friday, April 03, 2009

Life in Transition Results | Region Comparison

The EBRD Life in Transition Survey, as we at the CRRC blog previously mentioned, is available for download. The survey, measuring attitudes and values amongst 28 transitional countries divided in to three sub-regions, is one of the most extensive and impressive survey efforts conducted and encompasses all the post-socialist countries (plus Turkey). The three sub-regions are as following:

- Central Eastern Europe and the Baltic States (CEB)

- South-Eastern Europe (SEE)

- The Commonwealth of Independent States and Mongolia (CIS, which includes the South Caucasus)

The CRRC blog has often presented cross-comparisons of the Caucasian countries on a wide variety of subjects based on data from our own Data Initiative (DI). The EBRD report, sharing some of the variables from our DI, allows for a broader comparison of the attitudes, values and material standards between the former socialist countries. While the survey was conducted in 2006/2007, much of the data remains relevant.

Some noteworthy comparative data:

-The general agreement between the three sub-regions is that the level of trust between people has declined after the fall of communism. The CIS region had, according to 72 % of its respondents, societies where people could be trusted before 1989. Today, only 34 % shares this assertion. But, in comparison to CEB (31%) and SEE (25 %), the CIS sticks out as the region where people's trust in other individuals is the highest.


- 40 % in the CIS and CEB agree that the economic situation is better today than before 1989. The SEE, on the other hand, is showing a severely pessimistic stance in this regard since only 20 % of its respondents agreed to this assertion.

- According to the survey, corruption has thrived with the transition. Only 19 % in the CIS thinks that corruption has been reduced in their country since 1989. For CEB only 12 %, and in SEE only 9 % believe that corruption has reduced since 1989.

- Also the view on the political situation is rather gloomy in all three regions. As little as 25 % believe that the political situation is better today than before 1989 in the SEE region. The CIS proves more optimistic with 40 % of its respondents agreeing to this assertion.

- However, despite the negative responses on contemporary trust in society, corruption, politics and economics, the three sub-regions show a marked preference for democracy and market economy. This could be partly explained by the high optimism that the respondents in the three sub-regions hold about the future. The CIS, holding the most optimistic respondents, had 60 % of its respondents agreeing to the claim that children who are born today will have a better life than their own generation. (Or is maybe an issue that people are less hesitant to complain in CEB and SEE?)


Preferences for political and economic systems

This is just a small pick from the report Life in Transition – A Survey of People’s Experiences and Attitudes from the EBRD. The full report includes data on topics, such as, Material Well-Being, Views on Transition, Values/Priorities and Corruption/Trust, separately for each of the transitional countries. A fantastic resource for researchers!

Follow this link to access the EBRD report, its questionnaires and data.

Tuesday, March 03, 2009

Gallup: Azerbaijan is One of Least Religious Nations

According to a Gallup poll, Azerbaijan is considered to be one of the least religious countries in the world. Now, whereas this may be shocking news for those that perceive people in predominantly Muslim countries as devoted or even fanatical believers, those with experience of Azerbaijan probably would shrug their shoulders about this finding. But what exactly does least mean, and what causes the Azerbaijani lifestyle to be the most secular in the Moslem world?


How does religiosity in Azerbaijan look according to CRRC Data Initiative (DI)? According to our dataset, 97,2% of Azerbaijani identify themselves as Muslims, although this does not mean that religion is practiced on a daily basis by all of them. 14% of the Azerbaijani respondents pray every day, 30% admit that they do so “less often” and 25% of the Azeri’s say that they never bow in the direction of Mecca.


How about practice of religion in Azerbaijan from a regional perspective? Indicators determining importance of religion in people’s decision-making show that neighboring Armenians attach the same weight to religion as the Azerbaijani. Georgians, on the other hand, indicate that religion plays a much more important role in their daily lives in contrast to its two neighboring nations. For a more elaborate cross South Caucasian comparison on religious practices, check out this previous CRRC blog post.


Our dataset can not provide a conclusive answer to the second question on why the Azerbaijani lifestyle tends to be secular to its nature. One could point to the effects that Soviet rule might have had on expression of religiosity or that Azerbaijani, in general, perceives Western concepts of secularization and modernization as ideals. However, the depth of Azerbaijan’s secularity has also a pre-Soviet history to it. The country’s own version of Islam, one that has been heavily influenced by Sufi mystics over the centuries, has contributed to the un-dogmatic interpretation of religious decrees that is characteristic for secular nations, such as Azerbaijan.

These are just some possible explanations to the state of religiosity in Azerbaijan. If readers out there have other opinions, insights or critique on this issue, please comment!


Friday, February 20, 2009

Caucasus Currencies against the US Dollar

How have Caucasus currencies developed against the dollar? This question is not entirely trivial, since significant parts of the local economy are dollarised. Some colleagues, for example, have their salaries denominated in dollars.


As the above chart shows, the Armenian currency appreciated quite sharply against the dollar. The other currencies also appreciated, but remained a little more stable. How to interpret this? We turn to EBRD's 2008 Transition Report.

With Azerbaijan, the report tells us that in "an attempt to slow imported inflation and reduce the impact of the weaker dollar on domestic inflation, the NBA [National Bank of Azerbaijan] switched the targeted currency from the US dollar (effective peg) to a currency basket that currently comprises 70% US dollars and 30% euros." (p. 101)

Georgia, the Transition Report notes, has also pegged and defended its currency, trying to keep it stable; as a result "international reserves fell from 1.5 billion USD to 1.04 billion USD at end-September 2008" (p. 129). The EBRD report does not note anything on Armenian exchange rates, except for a continuing consumer price inflation of just below 12%, annually (August 2008).

Over the next few months, exchange rates are going to be one of the issues to watch. Large fluctuations could make life more difficult. In Azerbaijan, the EBRD suggests that "real exchange rate appreciation (through either nominal depreciation or higher inflation, or both) is inevitable. A tighter fiscal policy will be necessary to control inflation of the medium-term." (p. 101)

And on Georgia: "Given the still high level of dollarisation in the banking sector (more than 60% of lending is in foreign currency), a possible depreciation of the currency would affect the quality of banks' portfolios as the repayment capacity of unhedged corporates [sic] and retail clients weakens." (p. 128)

The Armenian economy seems less dollarised, but, as the report notes, its real estate boom was heavily dependent on remittances. As those decrease, one would expect some impact on the currency as well.

Thursday, January 29, 2009

Heritage Foundation | Index of Economic Freedom 2008

(We today noticed that we forgot to post this earlier -- apologies!)

The Heritage Foundation provides visitors with the 2008 Index of Economic Freedom, which covers 162 countries across 10 specific freedoms such as trade freedom, business freedom, investment freedom, and property rights. The 2008 Index provides an even clearer picture of economic freedom by using data-driven
equations which allows countries to be graded between scores of 0 and 100.

According to the 2008 assessment, Azerbaijan’s economy is 55.3% free, which makes it 107th in the world. If we look at the distribution, Azerbaijan falls into Mostly Unfree category.

Azerbaijan has considerable challenges in Investment Freedom, Financial Freedom, Property Rights and Freedom from Corruption. Its overall score is insignificantly different (0.5% points) than the last year. Azerbaijan is ranked 18th out of 30 countries in the Asia-Pacific region, and its overall score is below the world average.


For more info on Azerbaijan, click here.

Georgia is in a much better situation than Azerbaijan, having a 69.2% free economy, which makes it the world’s 32nd freest economy. Its overall score is 0.1% point lower than last year. Similar to Azerbaijan, two categories remain significantly below the world average: Property Rights and Freedom from Corruption. Property Rights may reflect the 2006 and 2007 situation, in which old (illegally, as the government alleged) privatizations were rescinded. As for corruption, is the data really plausible? According to the CRRC Data Initiative (DI) 2007, only 1% of the respondents in Georgia say they had to pay a bribe in the previous year.


Moreover, Georgia is ranked 18th out of 41 counties in the European Region, and its overall score is equal to the regional average. For more info on Georgia, click here.

From the South Caucasus countries Armenia has the best score. It ranks 28th with 70.3% freedom, just narrowly beating Georgia.

But Armenia, like Georgia, scores way below the world average in Property rights and Freedom from Corruption categories. In Georgia's case, we are not convinced by the accuracy of the score on Freedom from Corruption. Note a further post on this issue, for more detail.

To view scores and rankings for any country, or to find out which are the top ten countries, along with detailed data and background analysis, click here.

Wednesday, January 14, 2009

Freedom in the Caucasus | Freedom House 2008 Summary

Freedom House has just released its Freedom in the World report, for the year 2008. The report quantifies political rights and civil liberties. Civil liberties reflect four components: freedom of expression, associational rights, rule of law, and individual rights. Political rights focuses on three main components: electoral process, political pluralism and functioning of government. These indicators are then taken together to determine whether a country is free, partly free, or not free.

It's a mixed picture for the Caucasus. Armenia and Georgia are seen as Partially Free. In both countries civil liberties are rated as 4, on a scale where 1 means most free, and 7 least free. On political rights, Georgia also gets a score of 4. Armenia, by contrast, gets a score of 6 on political rights, down from the previous 5. This is unhappy company: 6 puts Armenia on a level with Russia, Tajikistan, Kazakhstan but also Congo. Azerbaijan, on political rights also gets a score of 6, just one up from the worst possible level of seven (Uzbekistan, Turkmenistan, Saudi Arabia). By comparison, even Afghanistan gets 5, and Turkey gets 3.


On civil liberties, Azerbaijan is also ranked as 5. That puts it squarely in the Not Free category, with the same scores as Russia. The overall map captures the context.

Painfully, Georgia has been removed from the list of electoral democracies. Yet this maybe does not mark quite the change that some people suggest: previously, Georgia was trading on the hopes that elections would work just fine. 2008 provided a hard test, and there was some (ultimately) unsurprising reverting back to old forms of managing things.

A more detailed look shows that Georgia already received a significant downgrade last year, when its 2007 performance brought it down from 3 to a score of 4 on both political rights and civil liberties. Time, maybe, for the government to do its homework in building institutional checks and balances (as they have said they would) but also for the opposition to get off their soapbox to make themselves relevant to the political process.

Generally, when looking at the methodology, we found it broadly plausible. Sure, we could always quibble with details (are political rights and civil liberties always as correlated as Freedom House suggests?) but it's a reasonable way of making the state of freedom comparable across the world.

Check out the website for detailed maps, a good essay summary, some (horrible) pie charts. You want to know how Freedom House rated General Pinochet in the 1970s? Check the comprehensive Excel sheet giving you the scores over time.

Friday, December 05, 2008

Freedom House Report | Democracy in the Caucasus

In June Freedom House released its 2008 annual Nations in Transit Report covering January 1, 2007 through December 31, 2007. The Nations in Transit Report covers the democratic performance of the former Soviet Union, the former Soviet satellite states and the former Yugoslavia.

Let’s take a look at how the nations of the South Caucasus have been depicted this year. Georgia has worsened on several of the indexes this year. This is not surprising given the events surrounding November 7, 2007 (the police violently disrupting protestors, the institution of a nine-day state of emergency and the state taking control of one media channel). Note the counter-intuitive grades: 1 represents the best level of democratic performance and 7, the worst.

Georgia Country Report 2008


After two years of slight improvements in performance, Georgia slid backwards in three categories: Electoral Process, Independent Media and National Democratic Governance. Overall Georgia (4.79) fares far worse in the rankings than the Baltic States (Estonia 1.93, Latvia 2.07 and Lithuania 2.25) and the Eastern European States (i.e. Czech Republic 2.14). Georgia is also worse than the former Yugoslavia (i.e. Macedonia 3.86 and Bosnia 4.11).

In comparison to the other non-Baltic, former Soviet countries however, Georgia is only bested in the rankings by Ukraine (overall 4.25). And while Georgia’s ranking for corruption (5.00) is impressively the best among the non-Baltic former Soviet states it still clearly struggles with both local and national democratic governance according to this rating system.

The non-Baltic former Soviet states rankings have deteriorated towards further authoritarianism and curtailment of media freedoms and the South Caucasus nations are no strangers to these trends.

Armenia and Azerbaijan’s rankings remained exactly the same this year as last year with the former receiving an overall 5.21 ranking and the latter a high, 6.0, putting it in the company of Tajikistan, Kazakhstan and Belarus.

A separate question remains as to how we can compare these ratings over time. Georgia interestingly has a better overall rating in 1999 than now and the corruption levels after spiking in 2004 have now returned to the level of 1999. Perhaps current assessments are based on more skepticism than in the past?

For more information and the complete reports for each country see Nations in Transit 2008

Saturday, November 22, 2008

EBRD Life in Transition Survey | worth analyzing!

One of the most impressive recent survey efforts, measuring attitudes about different countries in transition, has been undertaken by EBRD. Called Life in Transition Survey (LiTS), this is an attempt to look at how 29 'transitioning' countries have developed following 1989. The survey tracks "public attitudes, well-being, and the impact of economic and political change".

LiTS is both encouraging and sobering at the same time. What is encouraging is that overall people, in spite of many hardships, do not want a return to centralized, authoritarian systems. At the same time, incomplete transition has left many people equivocal with regards to market systems. EBRD also notes that social capital remains in short supply.

The basic idea is set out succinctly in this EBRD presentation.

Life in Transition 2
View SlideShare presentation or Upload your own. (tags: ebrd economy)


(Note that we really think such presentations should be available under a Creative Commons license, since technically we are not sure whether we're allowed to share this, although it's available online.)

But beyond this, LiTS offers much more, and much more detail on the Caucasus. Let's look at some of the findings in more detail.
  1. Satisfaction with life is relatively low in Armenia, and the old and poor tend to be most dissatisfied. Only 20% of those aged over 50 are satisfied with their lives. And among the poor, the situation is even worse: only 16% of those with lower income are satisfied with their lives. The situation is similar in Georgia, where only 12% of those aged 50-64 are satisfied with their life. By contrast, satisfaction with the economic and political situation is relatively strong in Azerbaijan, particularly among the 50- 64 age group. This seems to tally with what we saw in our own 2007 Data Initiative (although interesting to compare and contrast with Elvin Effendi's work).
  2. In Armenia support for democracy and a market economy is weak, with just one in four favoring a combination of the two. In Georgia, there are high levels of support for democracy, but less for a market economy, with those aged over 65 most strongly opposed to both (over 50%). In Azerbaijan, support for democracy and a market economy is high, with the middle-aged the most supportive. However, there also is little interest in the political and economic system, with four out of ten believing that the type of political/economic system does not matter.
  3. Azerbaijanis' trust in public institutions, especially in the presidency, government and the political parties is among the highest in the region. By contrast, trust in public institutions is very low in Armenia. The armed forces is the only public institution in Armenia that enjoys public trust.
  4. Georgians report a decline of corruption in the country and the frequency of “irregular payments” to the public officials is significantly lower than elsewhere in the CIS regions. “Irregular payments”, especially in the healthcare and education spheres, remain relatively high both in Armenia and Azerbaijan.
  5. In all three South Caucasus countries people surveyed are more optimistic about the future of their children. The optimism is significantly higher in Georgia, where almost 70% of those surveyed believe that their children’s lives will be better than their own.
Separately, we are really impressed by this entire effort. It is a genuine public good. EBRD is frank about discussing shortcomings and challenges in the societies (and therefore note that the views are those of the Office of the Chief Economist, not necessarily of the entire Bank). This is incredibly refreshing in an environment where blandness prevails. The data set is publicly accessible, there's detailed documentation about questionnaire, fieldwork, methodology. And most of the material is available online.

The full printed report (soon in our libraries, if you find it too expensive) is written so well that it makes engaging bedtime reading. Our only huge regret is that these discussions seem not to have been carried into the relevant societies. If any donor is short of creative ideas, surely this is a way to go: let's get this data studied and analyzed locally, and let's get the discussions onto TV. (If anyone needs help with the dataset, let us know, or come to our offices.)

Thursday, November 13, 2008

World Economic Forum Gender Gap Index | a few surprises

Indices are engaging and instructive, but some really baffle us. The World Economic Forum (WEF), the organisation that organises the annual high-profile Davos meetings, has come up with a gender index, and the Caucasus is featured. The index is intended to measure how the world is closing the gender gap in education, health, and political and economic participation. In principle, this is a great idea, since there are significant challenges and discrepancies (as our data itself shows).


So how does the Caucasus do? Azerbaijan does best, ranking 61, followed by Armenia at rank 78, and Georgia at 82. Surprising, no? Arguably a lot of data (including ours) would suggest exactly the reverse order.

Well, as it turns out the Caucasus says more about the index than the index says about the Caucasus. Let's look more closely. So in which neighborhood is Azerbaijan ranked? Well, it is following Hungary, but ahead of Ukraine, Slovak Republic, Luxembourg, Italy, the Czech Republic, Romania and also Greece. Armenia and Georgia are grouped with Ghana, Suriname, Bolivia, Malawi and Malta. Without even looking at the data, I suspect that female childhood literacy is way ahead in the Caucasus compared with that peer group, and arguably this should be weighed more heavily.

So where could the Caucasus turn to learn how to do it better? Well, according to the report, the Caucasus could start by emulating Mongolia (40), Kyrgyzstan (41), Kazakhstan (45) or even Uzbekistan (55). All of these do much better than the countries of the Caucasus (and, remember, better than many EU countries, too).

Let's look below the hood, to find out what's going on here. Four sub-indices assemble to create the full gender index. Economic Participation, Educational Attainment, Health and Survival, and Political Empowerment. They are meant to measure equality of distribution within the country (not against an external benchmark).

Now looking at Azerbaijan, what happens is that two of the indicators under Economic Participation are missing, but this does not seem to weigh against Azerbaijan's score. So where does Azerbaijan end up on Economic Participation? World rank 4, just missing bronze in the Gender Equality Olympics, even ahead of overall champion Norway.


Uzbekistan? Same story, ranking 11 worldwide on equality of economic participation. Again, see the missing lines of data.


Other data does not even stand up to a basic sniff test. Health and Survival? Mongolia and Kyrgyzstan get perfect scores, giving them highest rank (with several other countries). Now maybe they ARE doing better than Georgia ranked at 127 for Health and Survival, or Azerbaijan (129). But does anyone believe that Mongolia and Kyrgyzstan (or Tajikistan, at 55) do better than Netherlands at 72, or Germany at 57? Equality of distribution may be a nice idea, but what precisely do we end up measuring here? The equality of shared misery is not a meaningful guide to discussion or policy.

So it appears that the ENTIRE rankings that the World Economic Forum suggest are based on a hodgepodge of incomplete data that doesn't get balanced out.

This is a real shame. First, gender indeed is an incredibly important issue and one cannot talk enough about it. Bad quality rankings undermine the cause, rather than supporting it. Secondly, these misconstrued rankings obscure that there could be more nuance in the discussion, which the actual country reports could provide (if, that is, they are to be trusted at all). Unfortunately, Armenia is missing from the country reports.

Or did I get this wrong? Check it out yourself, and stay tuned, we will write to the WEF to find out.

Monday, October 27, 2008

World Press Freedom | Caucasus does badly!

Yet another index, and one with little happy news. How does world press freedom look? Reporters Without Borders, an advocacy group founded in 1985 ("investigate, expose, support"), has just released an international ranking. A total of 173 countries are ranked, and the Caucasus is in the bottom third.

Armenia does best, ranked at 102, but is also down sharply from last year, following the state of emergency. Armenia is behind Ukraine (87) and Moldova (98). Armenia shares its place with Turkey, which with restrictions on various topics has a curtailed public space.

Georgia, also down sharply, is ranked at 120, behind Sierra Leone, Indonesia and other troubled countries, but still ahead of Kazakhstan (125) and Russia (141). The press release notes the state of emergency imposed in late 2007, and that several journalists became victims of the recent conflict.

Azerbaijan is ranked at 150, following Swaziland, the Democratic Republic of Congo, and extraterritorial Israel, presumably the occupied territories. However, Azerbaijan is ahead of Zimbabwe (151), Belarus (154), Uzbekistan (172) and North Korea (173). Arguably, Azerbaijan should hope to move out of this company (where, as the report says, being a journalist "is a high risk exercise involving endless frustration and constant police and judicial harassment") and try to place itself closer to, say, Kuwait (61) or the United Arab Emirates (69), countries that build easy legitimacy through oil wealth.

But what exactly does the index measure? The website provides an overview over the methodology. The index is based on a survey with 49 questions, reflecting distinct criteria, and is available online. Attention is given to "every kind of violation directly affecting journalists (such as murders, imprisonment, physical attacks and threats) and news media (censorship, confiscation of newspaper issues, searches and harassment)." It also looks at whether those that violate press freedoms enjoy impunity. Moreover, it looks at legislation and the degree of self-censorship. Certainly, that's an important component: one friend, moderating a TV talk show found the producers interrupting through his earpiece, instructing him not to touch on certain topics.

While one has little reason to doubt that journalism is not in a happy state, and that unfortunately the rankings are broadly accurate, a little more detail on the methodology would have been useful. How are the different components weighted? To what extent, for example, was the sharp drop for Georgia explained by the recent conflict? Or did the index finally catch on more to problems of self-censorship? Or did it reflect, in particular, the violent closure of Imedi? Providing such detail would be helpful, since it could stimulate public debate, focusing on particular shortcomings.

To take a closer look, go to the website of Reporters Without Borders.

Thursday, July 03, 2008

Maths in Armenia | comparing through TIMSS

What is the average Armenian secondary school student’s competence in Maths and Science? Is Armenia doing fine, or is it time for the education policy makers to review the secondary school curricula. Trends in International Mathematics and Science Study (TIMSS) proposes an answer to these questions. TIMSS is an international evaluation of the mathematics and science knowledge of fourth and eighth grade students around the world. It was first conducted in 1995, and is administered once in every four years since then. In 2003, alongside with over 60 countries from around the world, Armenia also participated in the study.

Singapore (605), Hong Kong (586), Chinese Taipei (585), Japan (570) lead the TIMSS charts both in Maths and Science. The good news is that Armenia is among the countries that have high scores in Maths among the eight graders. Armenia is the 23rd in the chart, with an average score of 478 and is ahead of Serbia (477), Bulgaria (476), Romania (475) - countries that are above the international average score (467). The picture is different when it comes to the Maths scores of the fourth graders. Armenia’s indicators (456) are significantly lower than international average (495), leaving behind only Norway (451), Iran (389), Philippines (358), Morocco (341) and Tunisia (339).

Science scores among both the eight and fourth graders in Armenia are disappointing: 461 for the eight graders vs. 574 international average score and 437 vs. 489.

Interestingly, girls in Armenia show better results both in Maths and Science than boys (that's not the typical story). Look at the average grades below.

Subject

4th grade

8th grade

Male

Female

Male

Female

Mathematics

450

462

473

483

Science

432

441

455

468


Some alternative studies conducted in Armenia suggest that TIMSS sample may not be representative of the overall population. If we understand the argument correctly, the authors of this study argue that students included in the sample in Armenia are from middle-upper classes. Effectively this could mean that the poorest remain underrepresented. This may be an interesting topic for research (any potential fellows out there?).

TIMSS methodology, datasets and the questionnaires are available for further analysis here. The study is not conducted in other countries yet, although Georgia looks poised to join TIMSS.

Friday, April 11, 2008

Armenia and Azerbaijan’s Performance | Millennium Challenge Corporation’s Meta-Index


A previous blog entry on Millennium Challenge Corporation’s Meta-Index, as you may recall, presented Georgia’s performance. For those who do not know, Millennium Challenge Corporation (MCC) uses data from the research of various organizations such as the IFC, the World Bank Institute, UNESCO, Freedom House and others. Millennium Challenge Corporation recently released an assessment through its annual scorecard, which has three main policy categories: Ruling Justly, Investing in People, and Economic Freedom.

Unlike Georgia, were most of the trends are positive, trends in Armenia and Azerbaijan are not very consistent. Armenia has problems, especially in the Ruling Justly categories: the Political Rights, Civil Liberties and the Voice and Accountability are all in decline. The only two Armenian trends, which are currently improving, are the Primary Education Expenditures (UNESCO/National Sources) from the Investing in People category and the Regulatory Quality (World Bank Institute) from the Economic Freedom section.

Armenia


As for Azerbaijan, the news, according to the scorecard, unfortunately is pretty bleak. Most indicators are below the median, and some trends are declining further: among them, the Voice and Accountability trend, which was already quite low; the Inflation trend has increased, although, it looks as if that trend had been stopped in 2006. The Business Start-Up (IFC) and the Fiscal Policy (National Sources) are the only ones with a consistent increase each year.


Azerbaijan

For more info, click here. As always your comments welcome.