Friday, November 25, 2022

Nudging Georgians to self-test for HIV

Note: This article first appeared on the Caucasus Data Blog, a joint effort of CRRC Georgia and OC Media. It was written by Dustin Gilbreath, a Non-Resident Senior Fellow at CRRC-Georgia, The views presented in the article are of the author alone, and do not necessarily reflect the views of CRRC-Georgia, UNDP Georgia, Caritas Czech Republic, Tanadgoma, or The United Nations Development Programme under the Czech-UNDP Partnership for SDGs.

CRRC Georgia data suggests incentivising people to test for HIV and making tests more accessible can encourage more young people to self-test.

HIV and AIDS are highly stigmatised diseases in Georgia: a 2020 report found that half the public would not buy vegetables from someone they knew had HIV, and two in five do not think HIV-positive children should be able to attend school with other children.

This stigma stands in the way of more people being tested for HIV, a critical issue in Georgia.

While the country is on track to meet international standards for the share of HIV-positive people receiving treatment and for those receiving treatment to have viral loads suppressed, only one in three people (36%) with HIV is estimated to be aware of their HIV status.

In this context, CRRC Georgia conducted a study in partnership with Caritas Czech Republic, Tanadgoma, and UNDP in Georgia with the financial support of The United Nations Development Programme under the Czech-UNDP Partnership for SDGs to promote self-testing among young people. The tests were offered by Selftest.ge.  

The study found that running a smartphone raffle and minimising the amount of information needed to order a test made young people more willing to participate in HIV self-testing.

The method was found to be comparable in cost to some of the least expensive global interventions used to encourage people to self-test.

To reach these conclusions, the study made use of three randomised control trials (RCT) — the gold standard for scientific evidence.  RCTs randomly assign large groups of individuals to receive different interventions. By randomly assigning individuals to receive different interventions, researchers can ascertain that the only difference between the groups on average is that one received the intervention and the other did not.

In total, each randomised control trial had between 38,000 and 54,000 participants, reaching 16-22% of those aged 18–34 using Facebook in Batumi, Kutaisi, and Tbilisi.

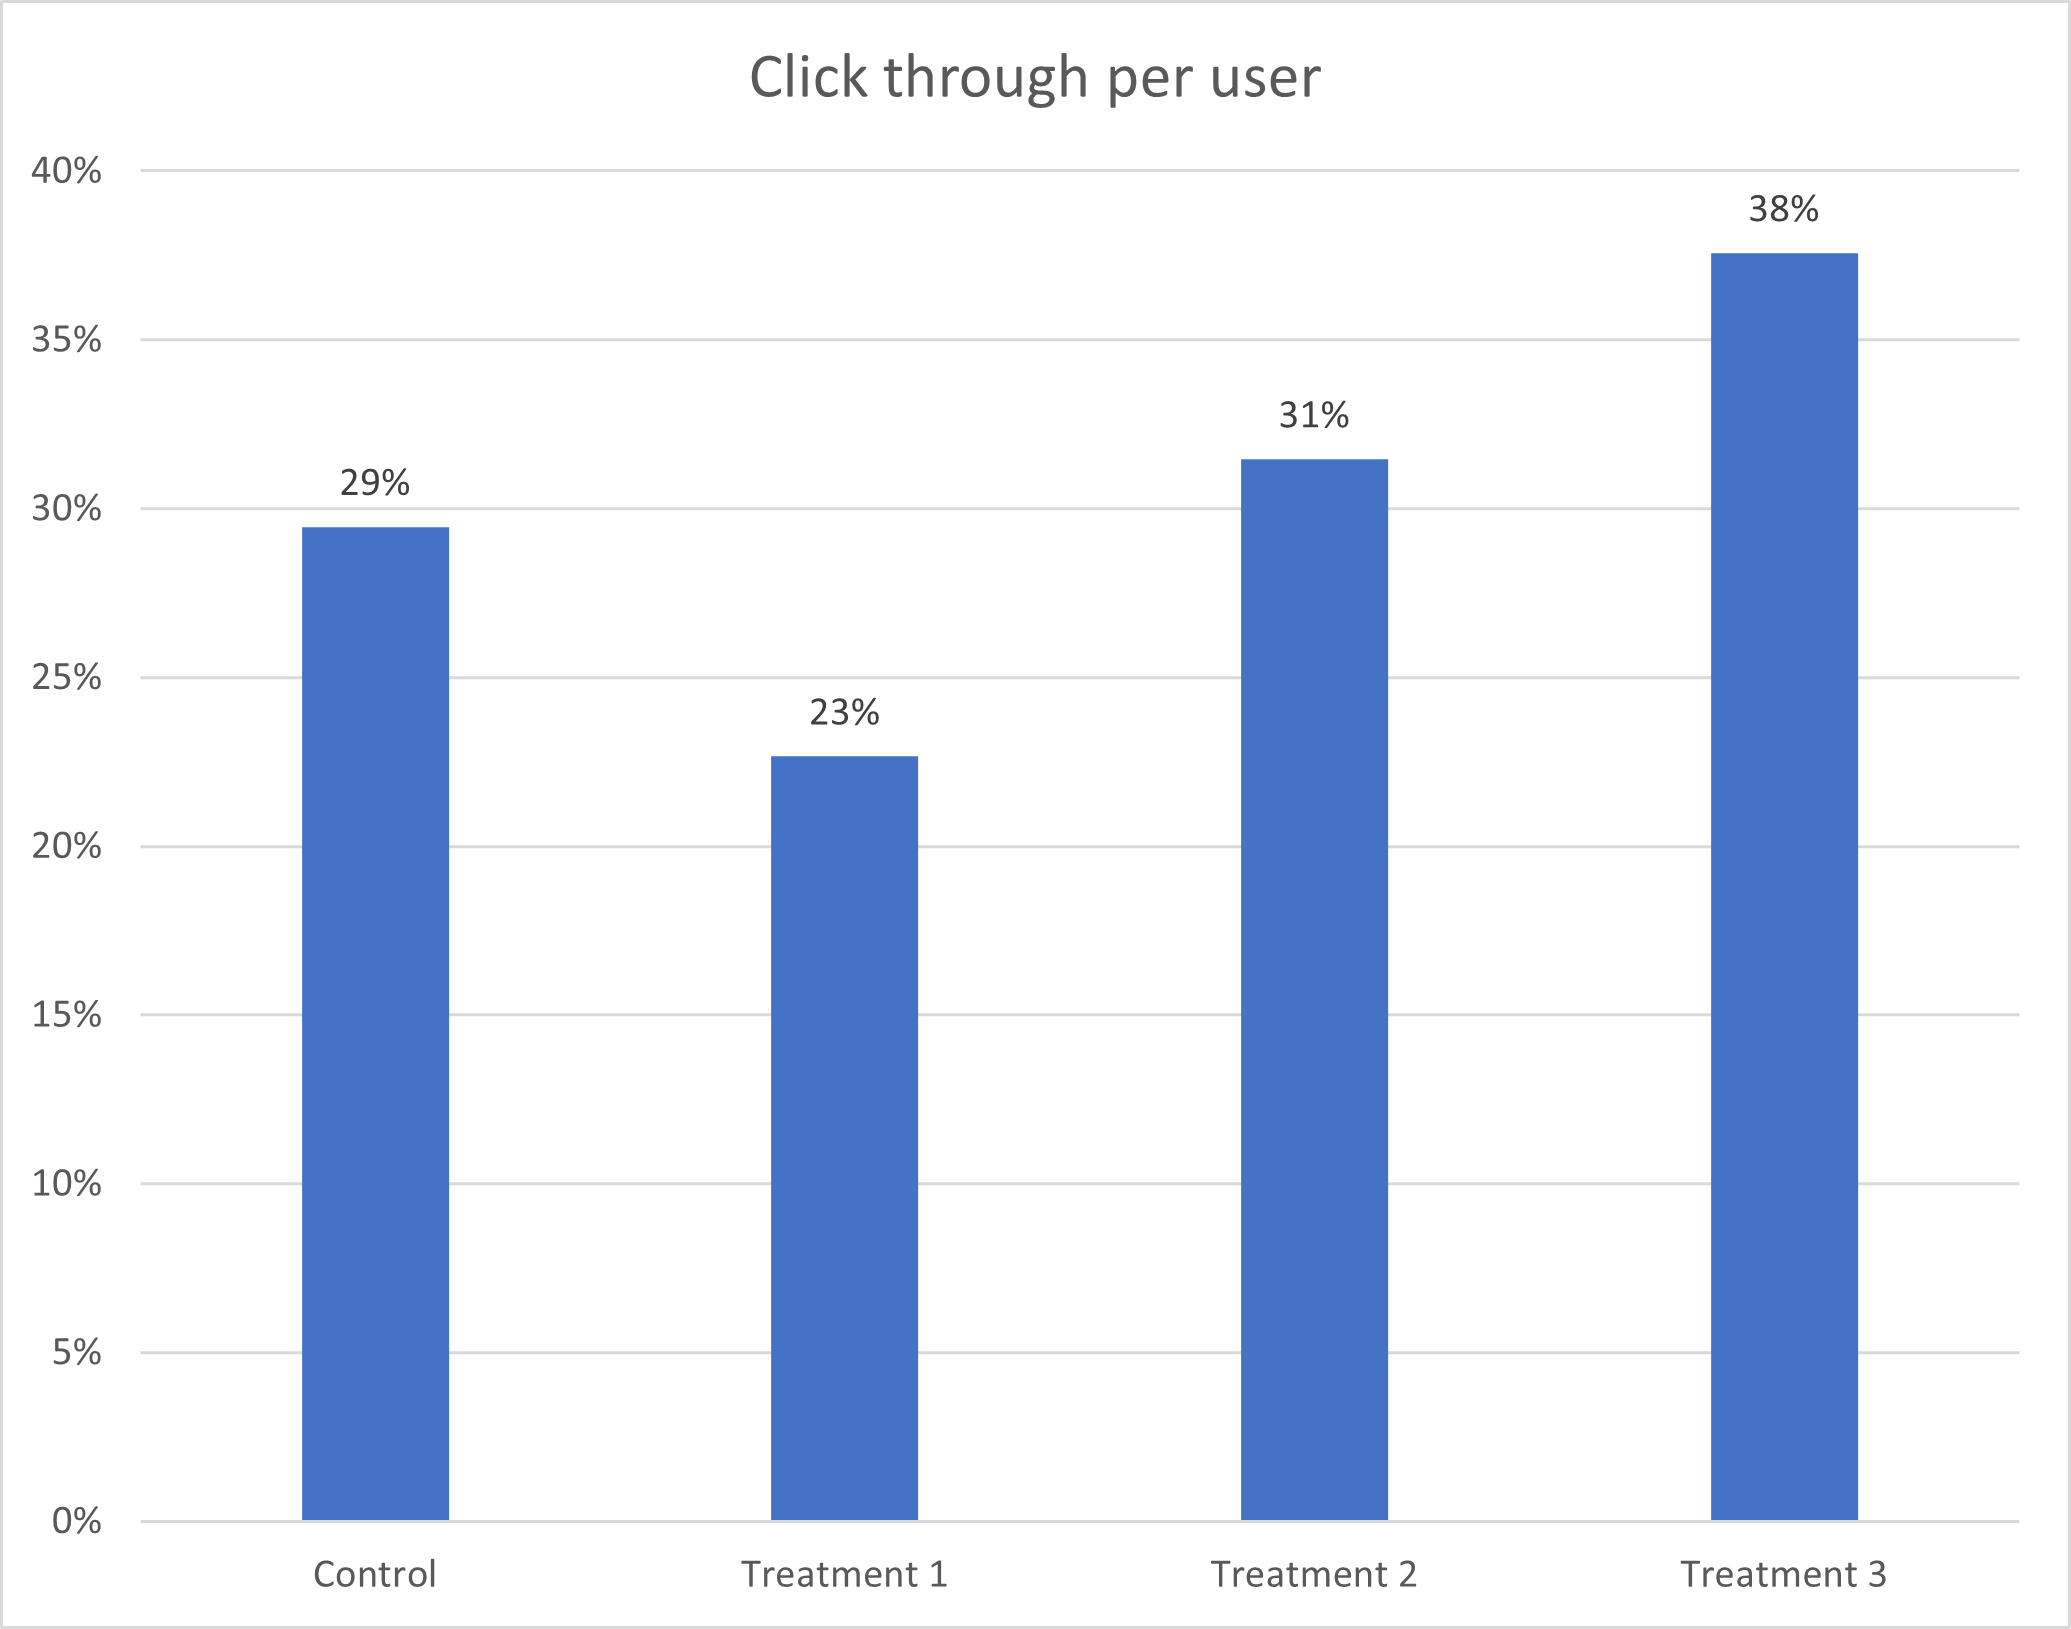
The randomised control trials tested three messages against a basic control message. The first message attempted to assuage people’s fears of being diagnosed with HIV. The second message highlighted that the services of selftest.ge were highly confidential and sensitive to young people’s needs. The third message offered a chance to enter a raffle for an iPhone 13.

The first study found that the iPhone 13 message was more effective than the two others at getting people to click through to the order page, followed by the message which focused on user confidentiality. In contrast to expectations, the message that attempted to assuage young people’s fears about a positive test result had a negative effect — people were less likely to click this message than the neutral control message.
Despite the large scale of clickthrough achieved in the trial, few people ordered self-tests. Project team members suspected that this may have stemmed from individuals not paying full attention to the messages. Therefore, a second trial was conducted with the same messages, but adding a one-sentence highlight of the key message to the Facebook post. However, this failed to produce more orders, with only one HIV self-test order coming through during the second randomised control trial despite thousands of clicks.

In the third and final trial, the study team inferred that the order form was too detailed and complicated for users. A new and simplified order form was trialled on Facebook with the two most effective messages (focusing on anonymity and the iPhone 13 raffle).

This final study started to lead to orders, with the combination of the iPhone 13 raffle and the simplified order form leading to the most self-test orders. In terms of the cost per order, this combination of a simple order form and the iPhone 13 raffle lead to a cost per self-test order of $2.66. This compares favourably to studies conducted internationally, which have identified the cost of testing promotion in the realm of $2 to $50+. 

While the stigma associated with HIV and AIDS in Georgia is a large-scale societal problem, enabling young people to access self-testing is critical to ensuring that people living with HIV know that they have it, and in turn, can seek treatment. This study provides one viable path for actors working on the issue to address this challenge.

The full policy brief which this report is based on is available here.

This post was written within the scope of the project Behavioral insights for low uptake of HIV testing in Georgia, which is implemented by the United Nations Development Programme (UNDP) through the Challenge Fund, with the financial support of the Ministry of Foreign Affairs of the Czech Republic.

The content of this material does not necessarily represent the official views of the Ministry of Foreign Affairs of the Czech Republic, or of the United Nations, including UNDP, or UN Member States.

Tuesday, November 01, 2022

Georgians increasingly feel mistreated by the government

Note: This article first appeared on the Caucasus Data Blog, a joint effort of CRRC Georgia and OC Media. It was written by Eto Gagunashvili, a Researcher at CRRC-Georgia, The views presented in the article are of the author alone, and do not necessarily reflect the views of CRRC-Georgia, or any related entity.

Recent CRRC Georgia data suggests that people in Georgia’s age and foreign policy preferences affect how they feel the government is treating them.

The public’s perception of the fairness of the government’s actions is critical to governance and may reflect the quality of democracy in a country. Today, Georgians tend to feel like their country is no longer a democracy, while the public feels that people like them are not being treated fairly by the government.

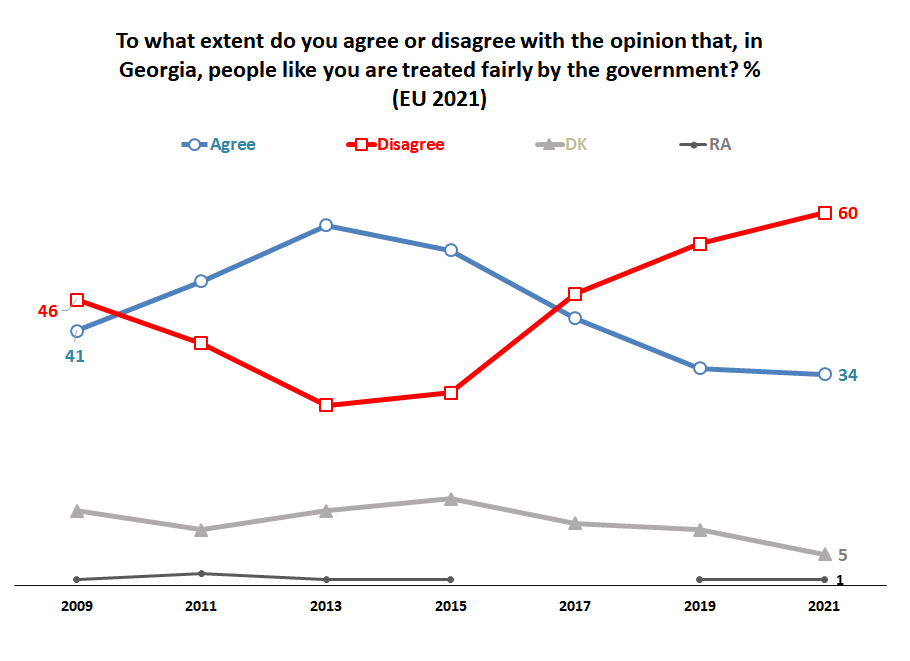
According to data CRRC Georgia collected for the Europe Foundation since 2009 through a survey on Georgian attitudes towards the EU, the share of Georgians who disagree with the opinion that people like them are being treated unfairly by the government has increased from 46% in 2009 to 60% in 2021. 

Today, twice as many people think that the government treats people like them unfairly as those who feel otherwise.

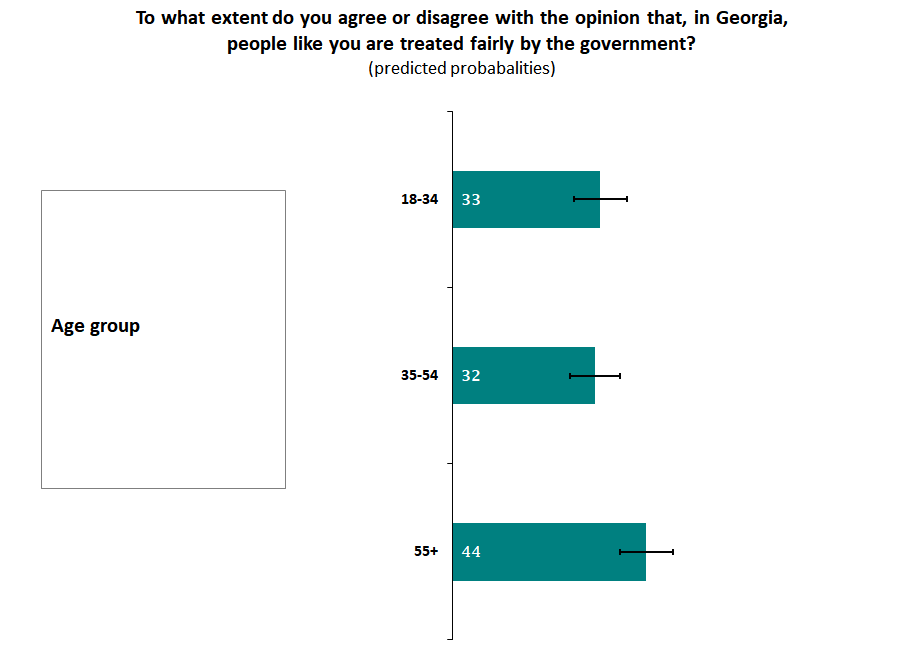
In the 2021 data, older people (55+) were more likely to agree with the opinion that in Georgia, people like them are treated fairly by the government than younger people (18–35). Other social and demographic variables were not statistically associated with whether or not someone thinks the government treats someone like them more or less fairly.

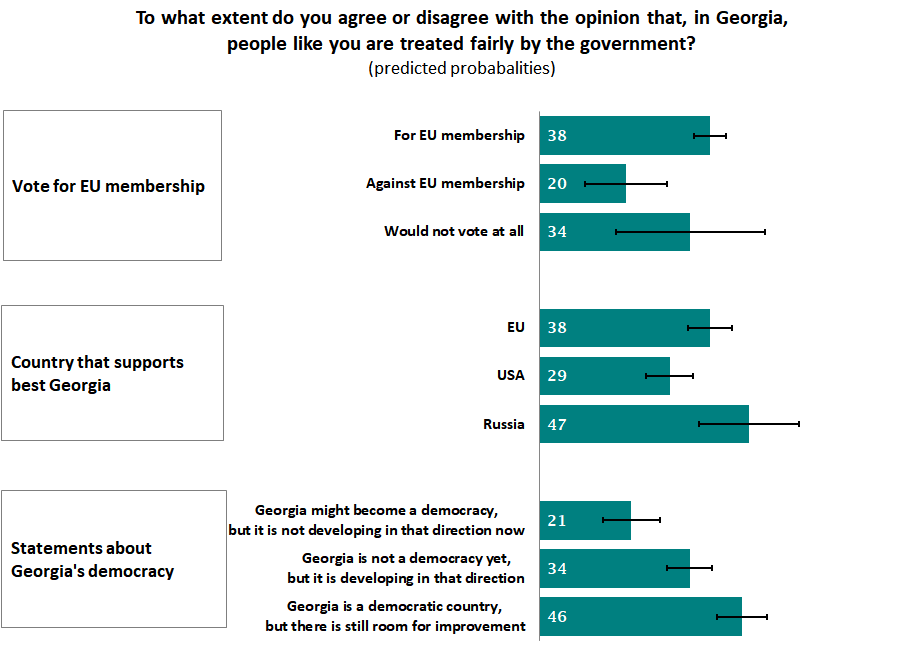
People’s perceptions of how democratic Georgia is, which country can best support Georgia currently, and support for EU membership are correlated with people’s views of whether people like them are treated fairly by the government. 

People who report that they would vote against EU membership were 18 percentage points more likely to agree that the government treats them fairly than those who report that they would vote for EU membership.

People who report that the USA can currently give the best support to Georgia were 18 percentage points less likely to agree with the statement that people are treated fairly by the government compared to people who report that Russia can best support Georgia.

People who think that Georgia is not a democracy yet, but is developing in that direction or think that Georgia is a democratic country with room for improvement were 13 and 25 percentage points more likely to agree that they are treated fairly than people who think that Georgia might become a democracy in the future, but it is not developing in that direction now. 

With the perception that Georgia’s democracy is backsliding, so too comes the public perception that the government is increasingly not treating people like them fairly. However, older people and people who think Russia can best support Georgia were more satisfied with how the government treats them. 

Note: The above data analysis is based on logistic regression models which included the following variables: age group (18-34, 35-54, 55+), sex (male or female), education (Secondary or lower; Secondary technical; Higher; type of settlement (capital, urban, rural); who can currently best support Georgia (EU, USA, Russia), how democratic Georgia is (Georgia might become a democracy in the future, but it is not developing in that direction now; Georgia is not a democracy yet, but it is developing in that direction; Georgia is a democratic country, but there is still room for improvement); Agree/disagree with the statement: "I am Georgian, and therefore I am European”); Would vote for or against EU membership? (For EU membership; Against EU membership; Would not vote at all).

Tuesday, October 25, 2022

Georgians increasingly agree that minority groups face challenges in Georgia

Note: This article first appeared on the Caucasus Data Blog, a joint effort of CRRC Georgia and OC Media. It was written by Sasha Slobodov, an International Fellow at CRRC-Georgia, The views presented in the article are of the author alone, and do not necessarily reflect the views of CRRC-Georgia, or any related entity.

In a recent CRRC survey on discrimination in Georgia, more Georgians agreed that a range of minority groups face challenges in the country than did three years prior, and they increasingly agree on the main issues that those groups face. 

A survey on hate crime, hate speech, and discrimination in Georgia CRRC Georgia conducted for the Council of Europe in 2018 and 2021 found a number of changes in attitudes among the Georgian population toward the issues that minority groups face.

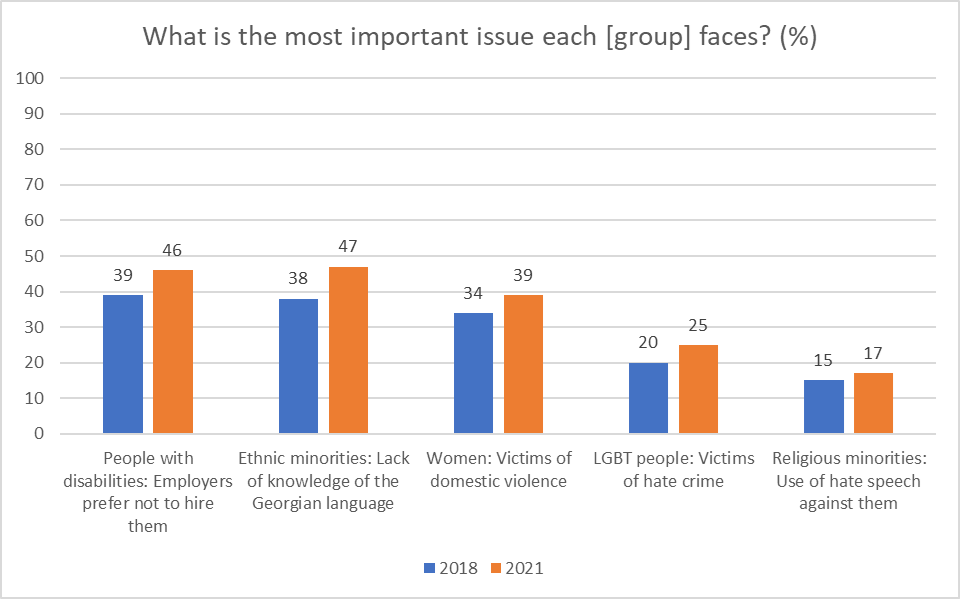
When asked what the biggest issue was that ethnic minorities faced in Georgia, the most frequently noted issue was lack of knowledge of the Georgian language in both 2018 (38%) and in 2021 (47%). For religious minorities, hate speech was believed to be the main issue they faced in both 2018 (15%) and 2021 (17%). 

For women, in 2018, domestic violence was the issue (34%) most commonly cited, increasing to 39% in 2021. As for people with disabilities, a plurality of the public believed that employers preferring not to hire people with disabilities was the main issue they faced in 2018 (39%). This rose to 46% in 2021.  Being a victim of hate crime was considered the largest issue for LGBT people (20%). This number increased to 25% in 2021.

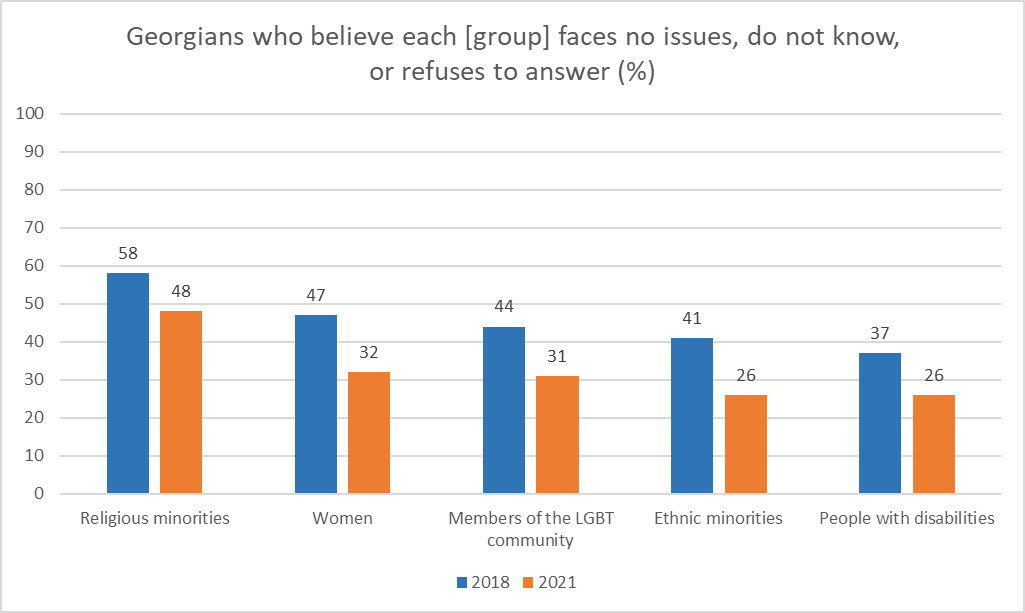
In both years, when asked what the main issues faced by each minority group were, respondents were also given the option to answer that the group faced no issues. Across all groups, the number of respondents who believed that the minority faced no issues decreased. Religious minorities were most often perceived to have no issues (38% in 2018, 27% in 2021), followed closely by women (34% in 2018, 17% in 2021), and then ethnic minorities (26% in 2018, 11% in 2021). The lowest percentage of respondents believed that people with disabilities (17% in 2018, 9% in 2021) and LGBT people (17% in 2018, 9% in 2021) faced no issues at all. 

Many respondents reported that they did not know what the most important issue different minority groups faced was. People were least aware of the issues that LGBT people face (22% in 2018, 18% in 2021), followed closely by religious minorities (19% in 2018, 20% in 2021), and people with disabilities (19% in 2018, 16% in 2021). In both 2018 and 2021,14% reported that they did not know what the primary issue faced by ethnic minorities was. Few people also said they did not know what issues women face, at 12% in 2018 and 14% in 2021.

The above data suggests that Georgians increasingly agree on the biggest issues minority groups face, and that the share of people who believe that minority groups face no issues decreased between 2018 and 2021. Respondents were more likely to agree on the primary issues faced by people belonging to ethnic minorities, people with disabilities, and women, meaning that majorities and minorities were likely to give increasingly similar responses. There was less consensus about the major issues LGBT people and religious minorities face.

Tuesday, October 18, 2022

Inflation and a Georgian’s choice of fuel

Note: This article first appeared on the Caucasus Data Blog, a joint effort of CRRC Georgia and OC Media. It was written by Makhare Atchaidze, a Researcher at CRRC-Georgia, The views presented in the article are of the author alone, and do not necessarily reflect the views of CRRC-Georgia, or any related entity.

A global pandemic and Russia’s invasion of Ukraine have both contributed to skyrocketing rates of inflation worldwide. Georgia is no exception, as people reevaluated their preferences for fuel throughout the past two years.

In August 2022, Georgia’s inflation rate stood at 10.9%, with the price of petrol rising by 18% and the price of diesel by 45% compared with those of August 2021 — this is due in large part to Russia’s invasion of Ukraine.

In response to rising fuel prices, Georgian drivers have been protesting. In early November 2021, during a period of price increases, Soso Pkhakadze, the chair and president of Wissol Group, one of Georgia’s largest oil companies, stated that fuel prices should be even higher due to globally rising prices. 

While arguably a reasonable point, the comment led to protests among Georgian drivers. The Facebook campaign, No to Fuel Prices, was created on November 3 and more than 162,000 people had joined by April 2022. On 27 March, police detained 20 of the campaign’s protestors for paralysing traffic in central Tbilisi as part of demonstrations over fuel prices. Similar large-scale protests have also taken place in Batumi, Kutaisi, Telavi, and Ozurgeti.

According to Geostat, Georgia’s national statistics office, the price of gasoline in March 2022 increased by 45.7%, while the price of diesel increased by 45.65% compared to the same month of the previous year. 

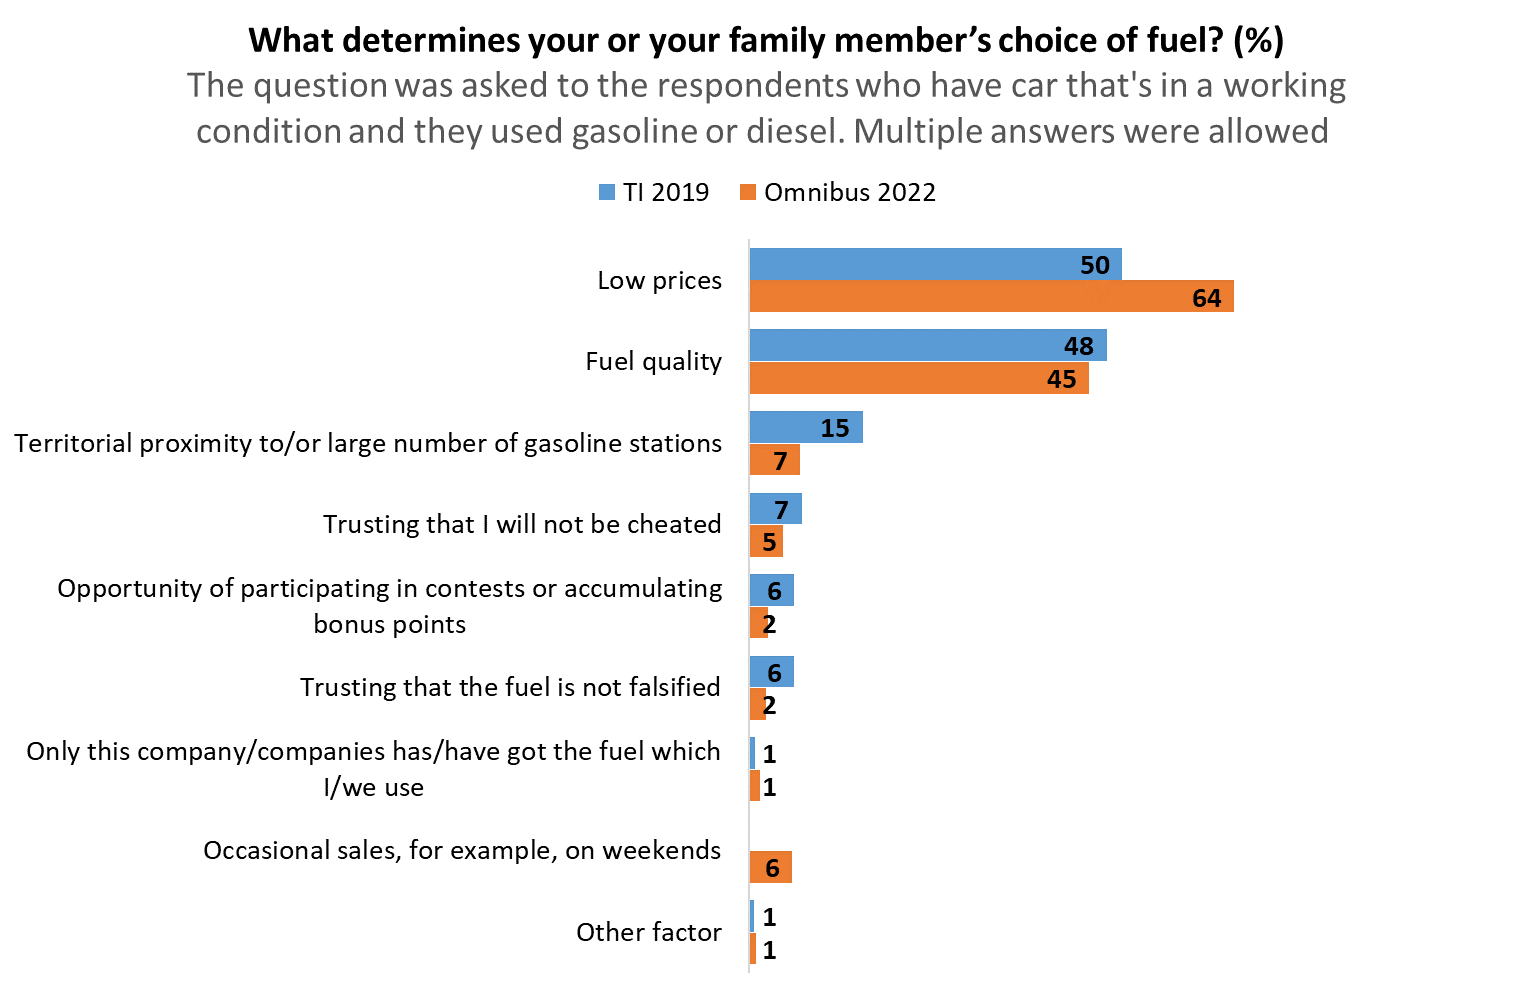
This is in a context where Georgian drivers already were highly price-oriented when selecting which fuel to purchase. Data from the Transparency International survey on public policy, which CRRC Georgia conducted in 2015, 2016, 2018, and 2019 suggests that low prices and fuel quality were the key factors in people’s decision-making on where to purchase fuel. When respondents were asked what factors affect their choice of fuel, 50% mentioned low prices and 48% indicated that they would prefer higher-quality petrol. A further 15% mentioned proximity to the petrol station. Other factors were mentioned by less than 10% of respondents. 

CRRC Georgia’s Omnibus survey conducted in July 2022 suggests that the importance of fuel prices has increased, with nearly two-thirds (64%) naming low fuel prices as a determining factor — a 14 percentage point increase. Notably, the share of people naming proximity halved between 2019 and 2022.

Note: Caption: Respondents were allowed to give multiple answers. Therefore, percentages do not add up to 100%.

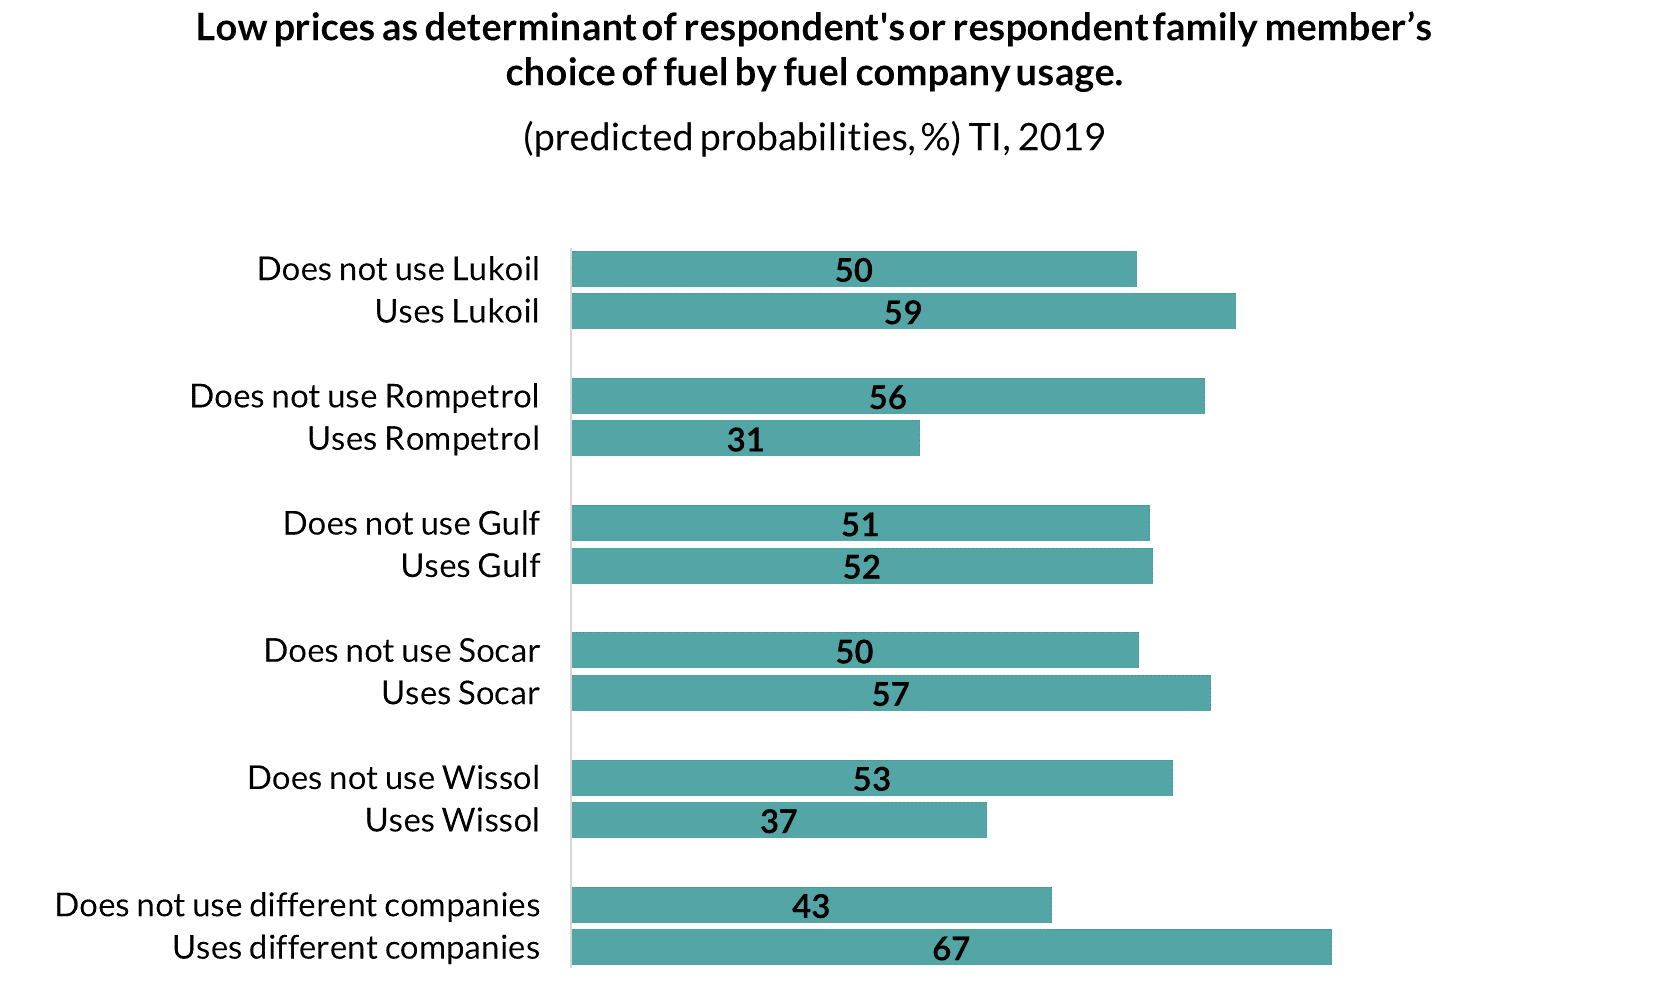
The 2019 data shows that price was a particularly important determinant for people who use non-branded fuel companies, Lukoil customers, and SOCAR customers. In contrast, Rompetrol and Wissol customers were less price-conscious and more concerned with fuel quality.

Note: This chart is based on a binomial logistic regression model. The model includes gender (male, female), age groups (18–34, 35–54, 55+), settlement type (capital, urban, rural), education (secondary or lower, technical, incomplete or complete tertiary), employment status (employed, unemployed), Wissol fuel use (mentioned, not mentioned), Lukoil fuel use (mentioned, not mentioned), Rompetrol fuel use (mentioned, not mentioned), Gulf fuel use (mentioned, not mentioned), SOCAR fuel use (mentioned, not mentioned), and other fuel use (mentioned, not mentioned).

Given the data above, it is perhaps unsurprising that the vast majority of drivers (96%) are concerned about rising fuel costs, and a large majority (82%) report that they are driving less, according to the July 2022 data.

Taken together, the above shows that drivers are increasingly concerned about the cost of fuel. 

The data used in this article is available here. The replication code for the above analysis is available here.

Wednesday, October 12, 2022

How Armenians and Georgians feel about the dissolution of the Soviet Union

Note: This article first appeared on the Caucasus Data Blog, a joint effort of CRRC Georgia and OC Media. It was written by Giorgi BabunaSvili, Senior Policy Analyst, and Kristina Vacharadze, Programs Director at CRRC-Georgia, The views presented in the article are of the authors alone, and do not necessarily reflect the views of CRRC Georgia, or any related entity.

Caucasus Barometer 2021 data shows that a majority of Armenians feel that the dissolution of the Soviet Union was bad for their country, while almost half of Georgians feel that the collapse had a positive impact on Georgia. 

Since the collapse of the Soviet Union, Georgia and Armenia have shared differing yet similar paths. 

Both have experienced wars, revolutions, and economic upheaval, but political direction and public sentiment on major political issues has often diverged. 

Data from the Caucasus Barometer 2021 has shown that a key difference is how the public views the Soviet collapse. In Armenia, a clear majority feels that the dissolution of the Soviet Union left the country worse off, while in Georgia opinion is divided, with half of the public viewing the collapse as having been good for the country. 

The annual survey found that two thirds (67%) of Armenians think the dissolution was bad for the country, whereas around two in five (38%) in Georgia think the same. In contrast, almost half of Georgians think that this was a good thing for the country, while only about a fifth of Armenians agree with the statement.

Opinions were associated with some demographic characteristics.

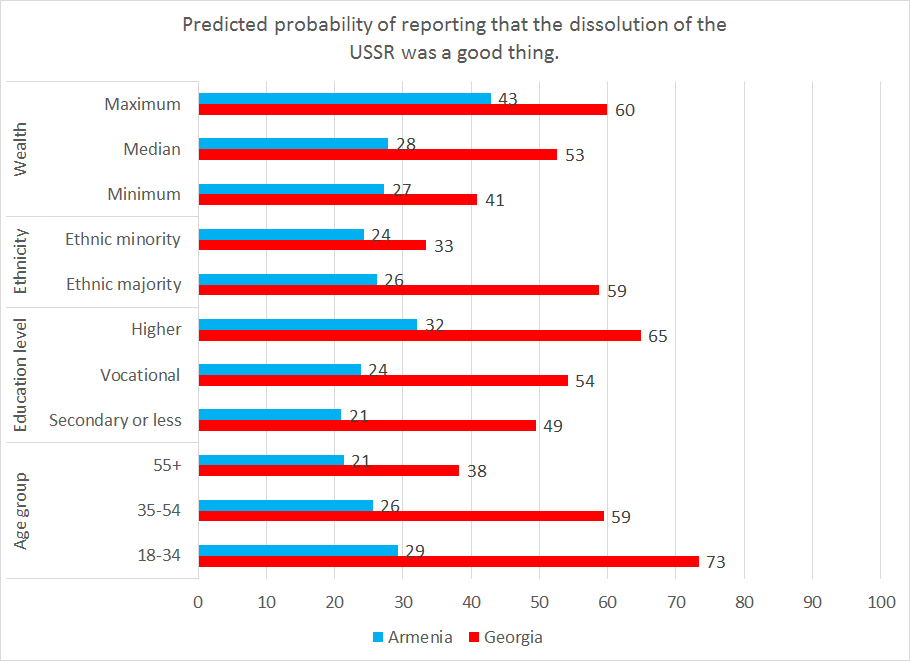
A regression model found that, in both Georgia and Armenia, people with a higher education were more likely to think that the dissolution of the USSR had had a positive impact than people with only a secondary or secondary technical education. In both countries, younger people were more inclined to say that the dissolution of the USSR was a good thing than older people.

There were no statistically significant differences in attitudes associated with gender, settlement type, or employment. However, wealth was a significant predictor of attitudes in Armenia: wealthier people assess the dissolution of the USSR more positively. The same variable was not statistically significant in Georgia.

Ethnic minorities in Georgia tended to feel less positively about the dissolution of the USSR than ethnic Georgians. Association with ethnicity was not tested in Armenia due to the small share of ethnic minorities in the country. 

What reasons do people give for their views?

The survey also investigated the reasons for people’s opinions. In both Georgia and Armenia, the overwhelming majority of those who felt that the dissolution of the Soviet Union had had a positive impact gave their country gaining independence as the main reason. Of those who felt it had been bad for their country, people’s economic situation having worsened was the most common response. 

However, amongst those who felt that the dissolution of the Soviet Union had had a negative impact, different demographic groups prioritised different reasons. 

Older people in Georgia and Armenia were more likely to resent that travel within the former USSR had become more difficult. 

People with a secondary education or below perceive the lack of free healthcare and education as a greater loss than people with higher education do. 

In Armenia, the country’s economic situation having worsened was of greater concern to people without a higher education. 

Older people and people in rural areas saw damaged ties with friends and relatives as a larger problem than younger people and residents of the capital. People in rural areas in Armenia were also more likely to attribute their negative assessment to a decline in the availability of jobs. 

Overall, Georgians felt more positive than Armenians about the impact of the collapse of the Soviet Union on their country, but the reasons that people gave for their assessments were similar in both countries. 

Note: The analyses of different groups’ views in the above uses binary logistic regression, where the dependent variable is either a) thinking the dissolution of the USSR is a good or bad thing, or b) the reason why the dissolution of the Soviet Union was a bad thing. The independent variables included gender, age group, ethnicity, settlement type, level of education, wealth, and employment status.

Tuesday, October 04, 2022

Georgian politics leave many feeling alienated

Note: This article first appeared on the Caucasus Data Blog, a joint effort of CRRC Georgia and OC Media. It was written by Givi Silagadze, a Researcher at CRRC-Georgia, The views presented in the article are of the author alone, and do not necessarily reflect the views of CRRC Georgia, or any related entity.

Recent CRRC Georgia data suggests that half of the public believes that public officials don’t care about their opinions and that they do not have a say in what the government does.

Amid fears of democratic backsliding and as Georgians grow more jaded with the politics of Georgia — be it from opposition or ruling party politicians — data from the Caucasus Barometer 2021 survey suggests that older people, women, and people coming from poorer households feel especially alienated from politics.

Education level and party preference seem to be associated with the degree of political estrangement someone feels. However, in contrast to commonly voiced views, younger people and ethnic minorities do not report particularly high levels of political estrangement.

The Caucasus Barometer asked six questions that made it possible to examine voters’ feelings and attitudes towards the political system and decision-making in the country.

More than two-thirds of the people (69%) do not feel well qualified to participate in politics, 53% consider politics to be too complicated to understand, and half of the public thinks they do not have a say in what the government does (59%) and that public officials do not care about their opinions (51%).

At the same time, a third of the electorate believes that they have a good understanding of the important political issues in the country, while 39% of the public believes that their vote will not make any difference.

Who is more likely to be politically alienated?

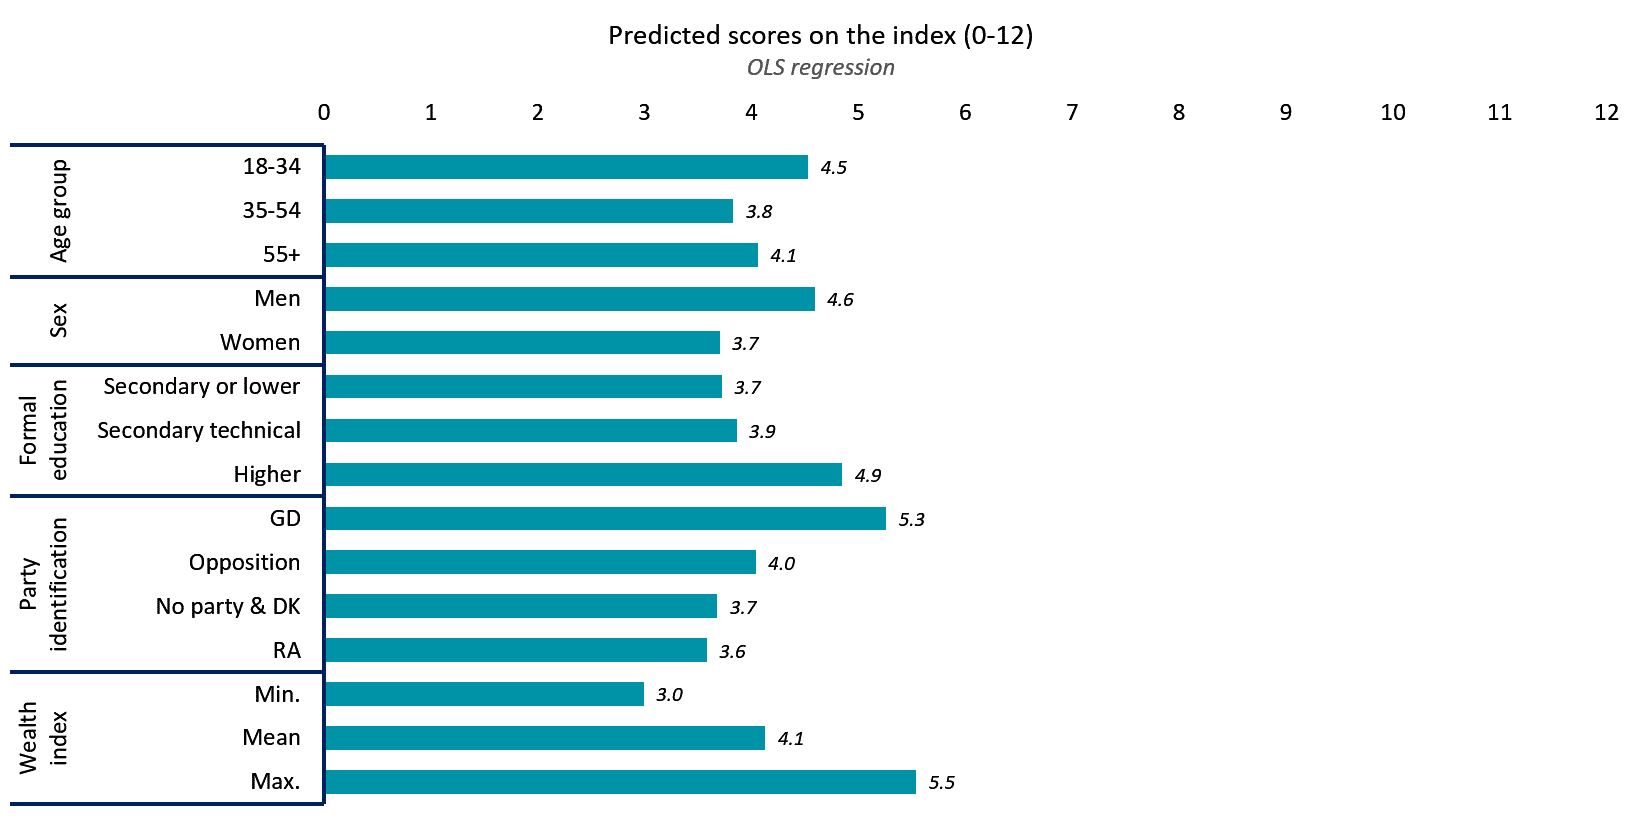
The six questions in the graph above were aggregated into an index of political estrangement. The index ranged between total political estrangement at 0 and the absence of political alienation at 12. The mean score on the index was 4.2, suggesting that the public tends to feel estranged from the political system in the country.

Regression analysis suggests that young people, men, people with higher formal education levels, supporters of the ruling Georgian Dream party, and people from wealthier households are less likely to feel estranged from Georgian politics than older people, women, people with lower education levels, supporters of the opposition, unaffiliated voters, and people living in poorer households.

The analyses indicate that some otherwise vulnerable groups, such as the elderly, women, and poor people feel especially estranged from politics. In addition, political alienation seems to be correlated with education and political preference — particularly whether or not someone supports Georgian Dream.

At the same time, young people and ethnic minorities, who are often assumed to be politically apathetic and disengaged from politics in Georgia, do not seem to feel particularly alienated from political processes and institutions. Therefore, the reasons for their comparatively higher levels of disengagement from political activities must be sought in other areas rather than in the realm of feelings and attitudes towards politics.  

Note: The above data analysis is based on the OLS regression model which included the following variables: age group (18-34, 35-54, 55+), sex (male or female), education (completed secondary/lower or incomplete higher education/higher), settlement type (capital, urban, rural), wealth (an additive index of ownership of 10 different items, a proxy variable), ethnicity (ethnic Georgian or ethnic minority), partisanship (Georgia Dream, opposition, no party/DK), and index of political estrangement (0-12: 0-full political estrangement, 12- the absence of political estrangement).

The data used in this analysis is available here.

Tuesday, September 27, 2022

Do politicians serve Georgia’s public interests?

Note: This article first appeared on the Caucasus Data Blog, a joint effort of CRRC Georgia and OC Media. It was written by Dustin Gilbreath, a Non-Resident Senior Fellow at CRRC-Georgia, The views presented in the article are of the author alone, and do not necessarily reflect the views of CRRC Georgia, or any related entity.

A recent CRRC Georgia and NDI poll suggests that roughly half of the Georgian public, regardless of their partisan affiliations, believe that neither the opposition nor the ruling party serves their interests.

Political polarisation in Georgia has little to do with opinions on policy. An analysis of numerous questions on the regular NDI and CRRC polling suggests that the public has consistent preferences and concerns, no matter the party they support: Georgians tend to want a pro-Western foreign policy for the country, they are concerned about the economy’s development and jobs, and they tend to be socially conservative. 

While what the public wants is relatively clear, Georgians do not see the ruling Georgian Dream party or elected opposition figures working towards providing that.

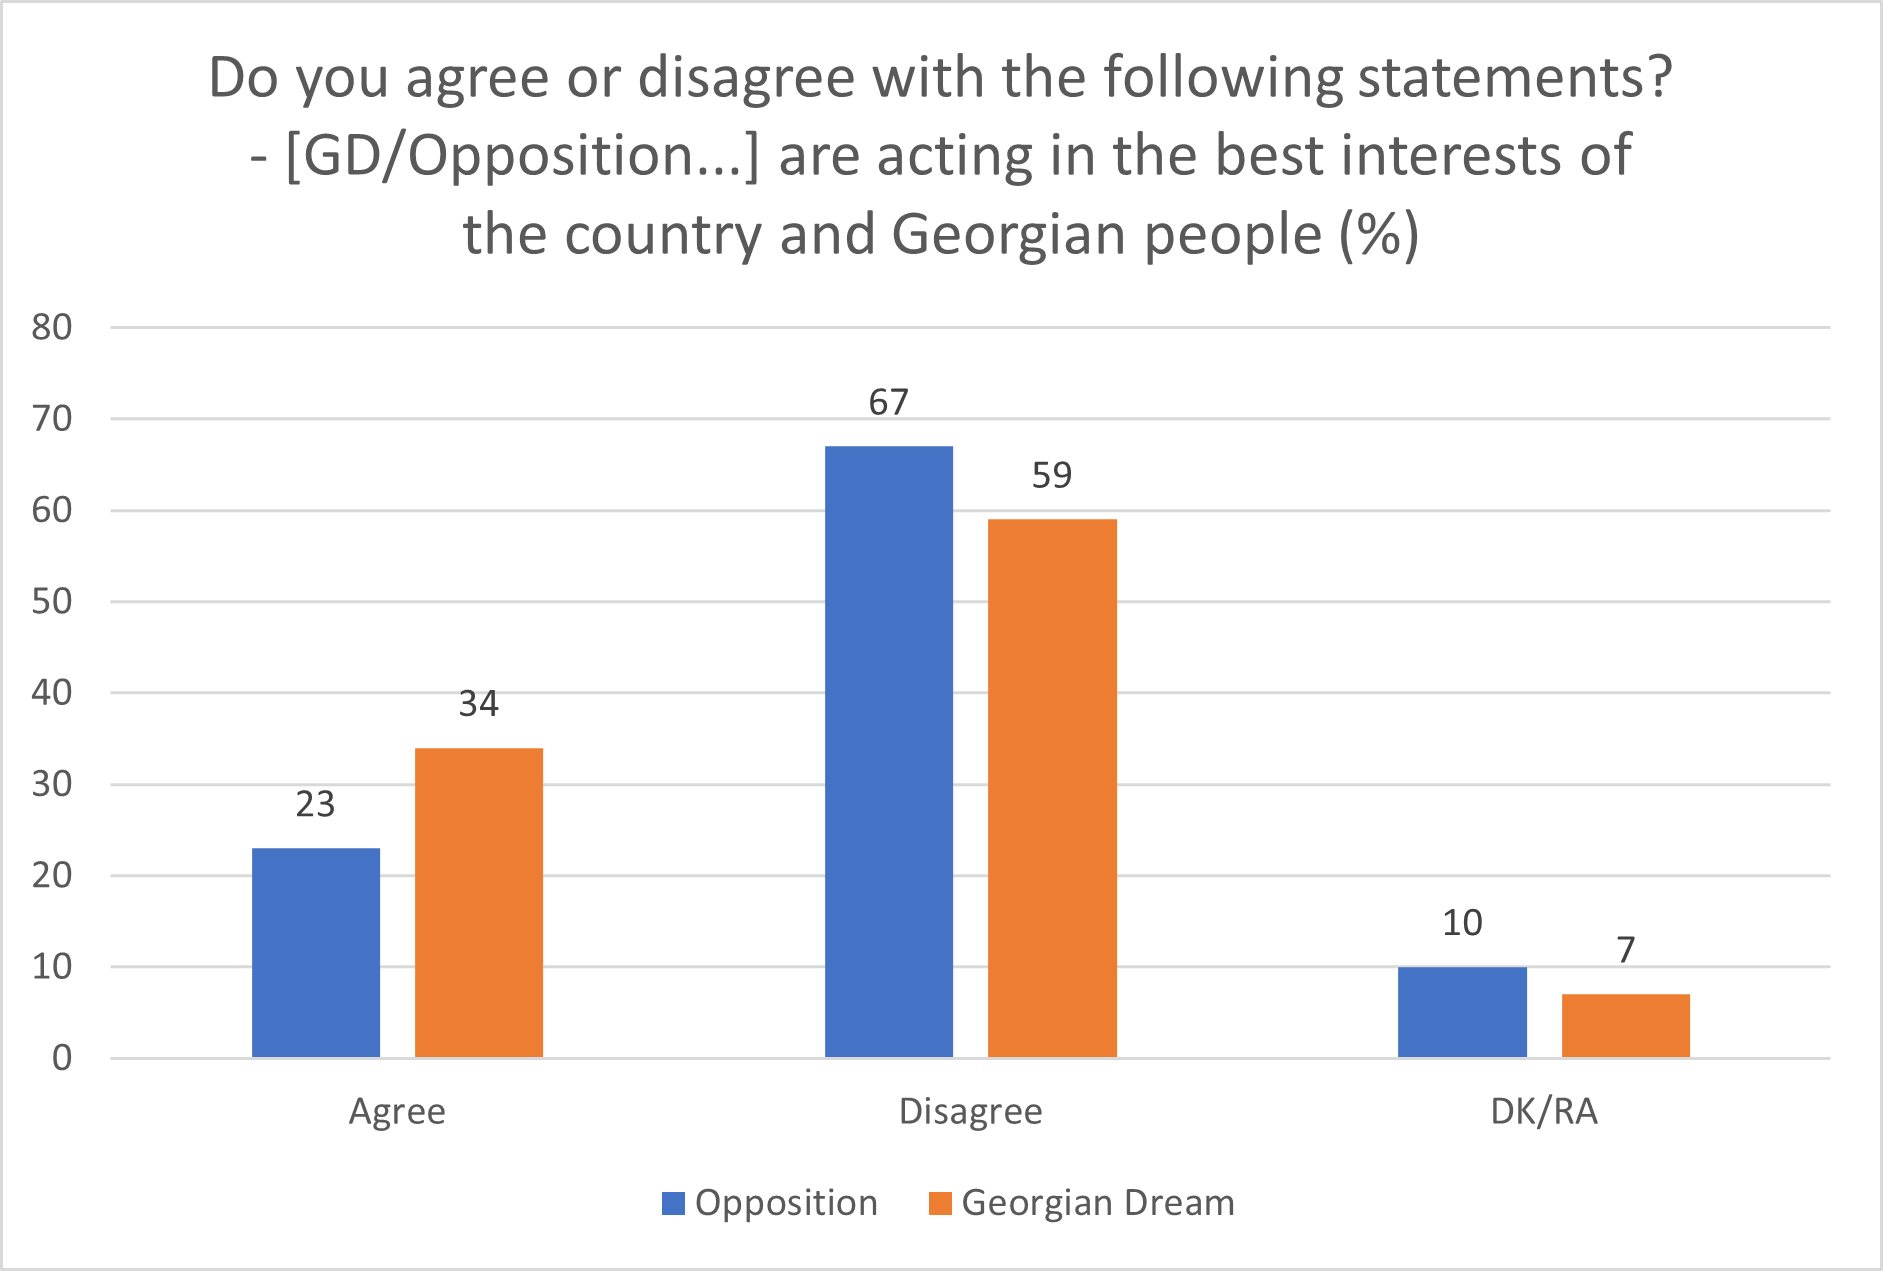
The most recent CRRC and NDI survey suggests that a majority of the public thinks that neither the opposition nor Georgian Dream serves the interests of people like them, although 11% more of the public believe that Georgian Dream serves the interests of people like them.

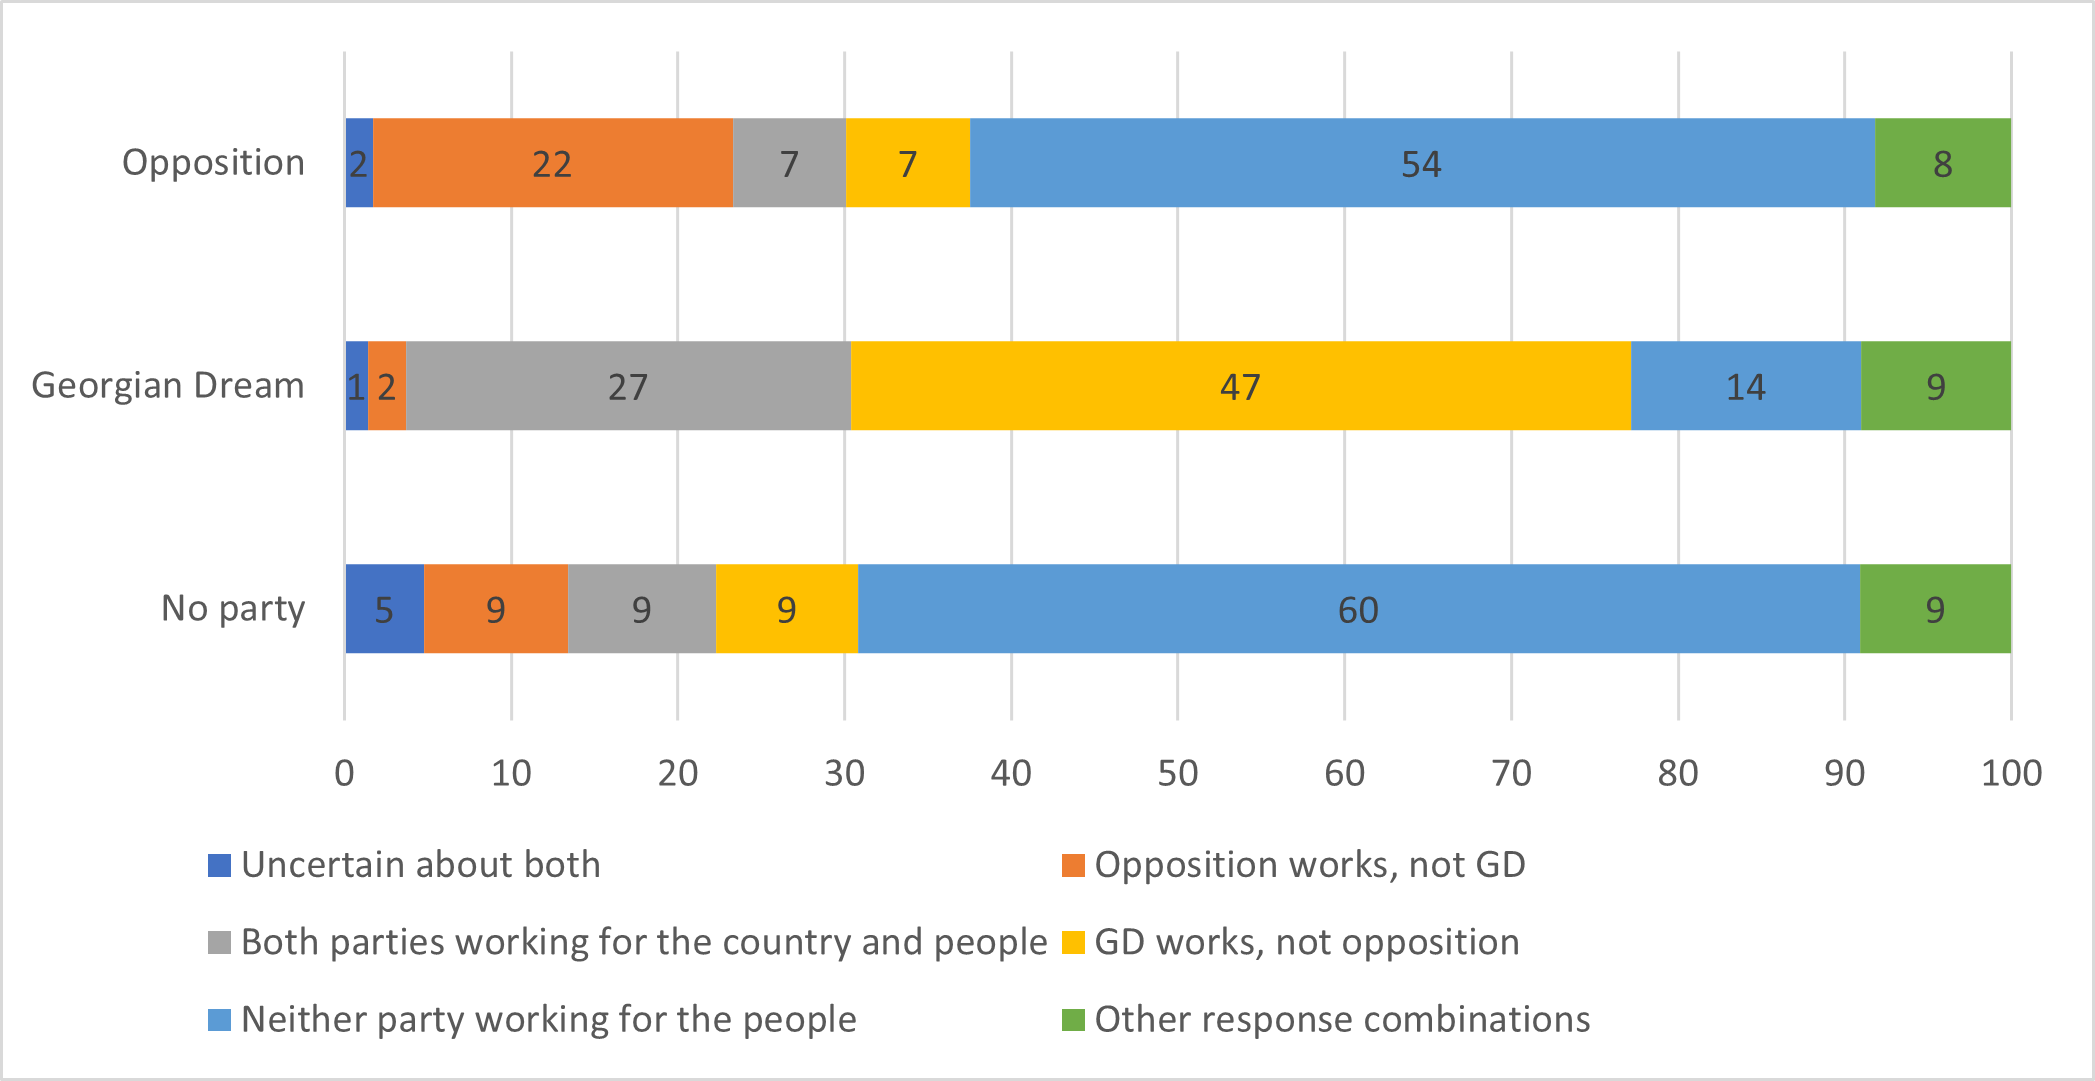
About half of the country (46%) says neither party acts in the best interests of Georgia or the Georgian people. 

The data show some partisan bent. About one in five (19%) say that the ruling party is working in the best interests of the country, while the opposition is not. One in ten (10%) thinks that the opposition is working in the interests of the country, while Georgian Dream is not. Only one in eight (13%) think that both parties are working in the best interests of the country.

At present, 50% of the country supports no party or has refused to answer which party they support; 27% support Georgian Dream and 24% support an opposition party.

When the above data is broken down by partisanship, the data show mistrust among partisans and non-partisans alike. Nearly half of Georgian Dream’s supporters (47%) report that their party works for the people, while the opposition does not. In contrast, 54% of opposition supporters and 60% of those that report they do not support any party say that neither the opposition nor Georgian Dream is working for the people. One in five opposition supporters (22%) report that the opposition works for the people, but Georgian Dream does not. 

The data should give politicians pause, whether they belong to the ruling party or the opposition.

If most Georgians believe their political parties are not working in good faith, that might be an indicator of a larger issue of miscommunication — whether or not the public’s fears are unfounded.

Moving away from the relentless accusations and infighting that have characterised Georgian politics in recent years and instead adopting a positive vision for the country might help Georgia’s political parties regain the trust of the public.

The data used in this analysis is available here.

Tuesday, September 20, 2022

Most Georgians believe that Georgia is not a democracy

Note: This article first appeared on the Caucasus Data Blog, a joint effort of CRRC Georgia and OC Media. It was written by Givi Silagadze, Researcher at CRRC-Georgia, The views presented in the article are of the author alone, and do not necessarily reflect the views of CRRC Georgia, or any related entity.

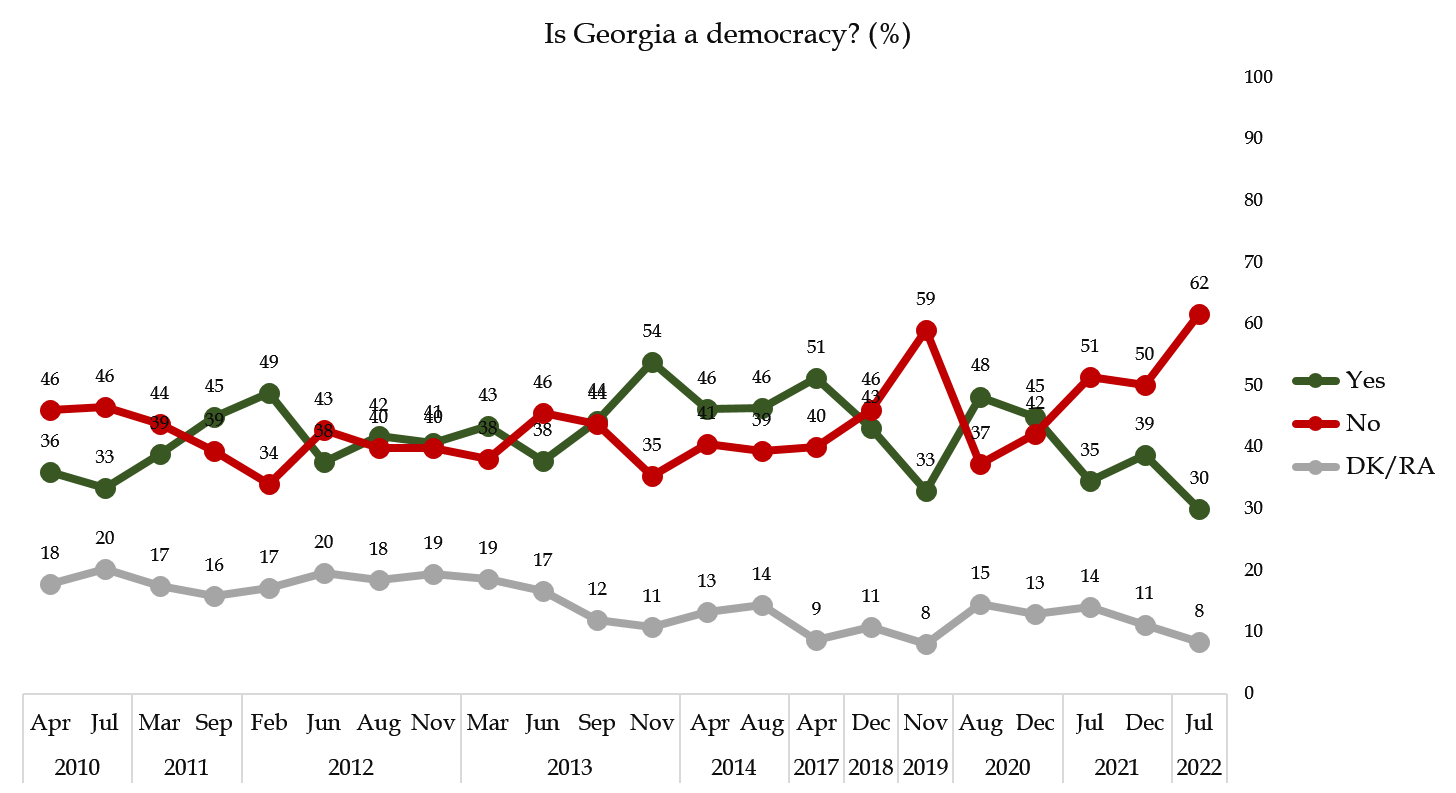
The share of Georgians who think the country is a democracy is at its lowest for the last decade. Supporters of the ruling party are the exception to this trend, tending to believe that the country’s democracy remains a good example for others. 

Newly released NDI/CRRC data suggests that Georgians are growing increasingly skeptical about democracy in the country. Except for supporters of the ruling Georgian Dream (GD) party, a majority of all other groups think that Georgia is not a democracy. 

As of 2022 August, only three out of ten Georgians felt Georgia was a democracy. Since 2010, when NDI and CRRC started to ask this question in nationwide surveys, this is the lowest share of the public expressing the opinion that Georgia is a democracy. Similarly, the share of the public explicitly saying Georgia is not a democracy was highest in August 2022. 

Note: There are no data for 2015 and 2016

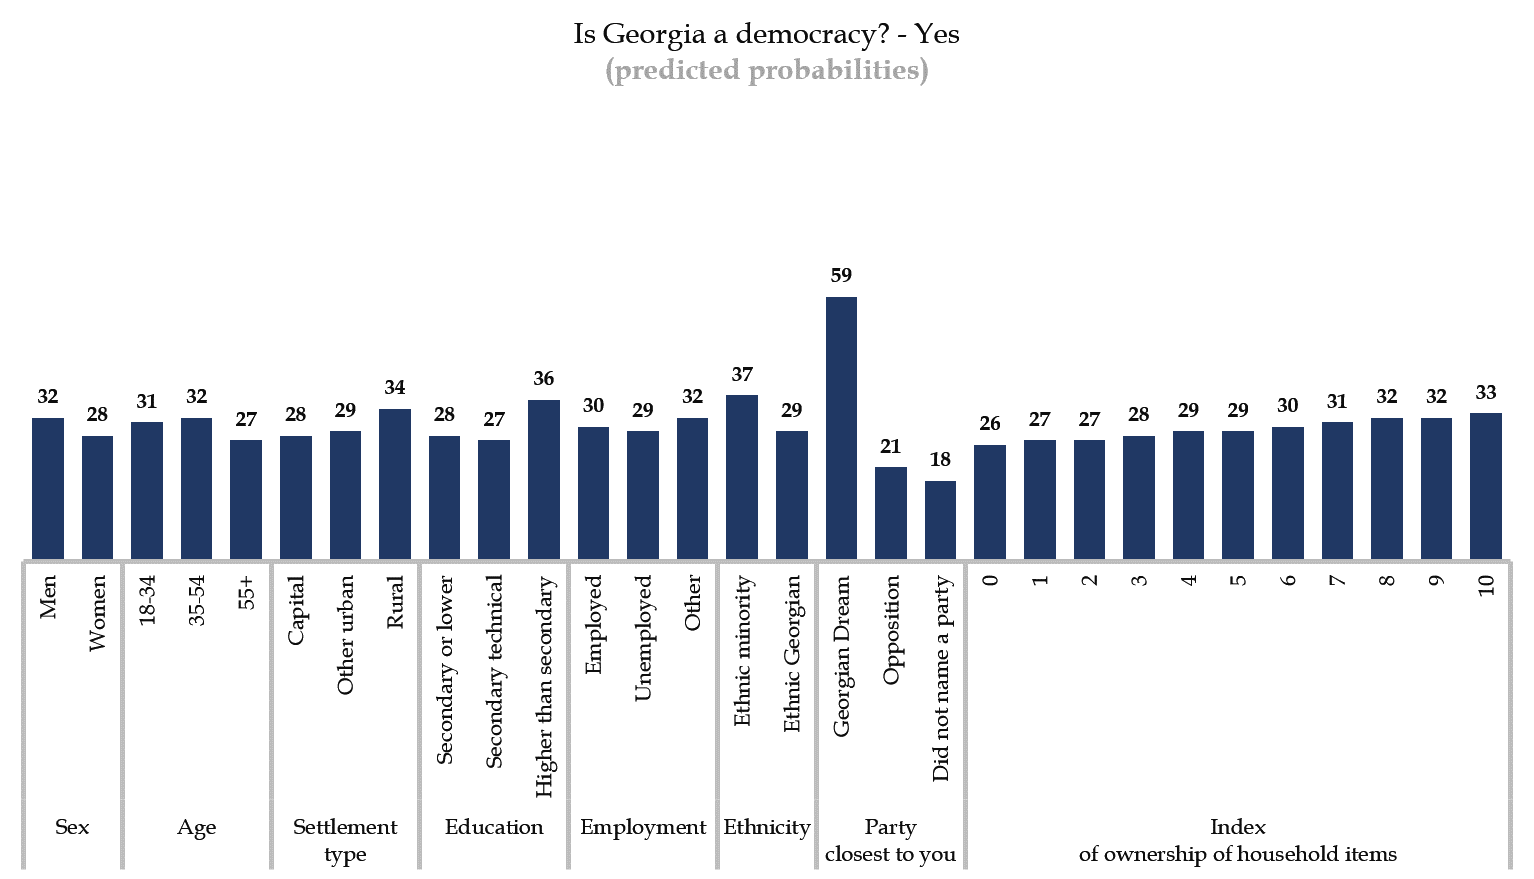
Logistic regression analysis was conducted to understand the differences between different groups. Age, sex, settlement type, employment status, ethnicity, and wealth are not associated with whether people think Georgia is a democracy or not, while education and party support are. 

People with a tertiary education are more likely to say that Georgia is a democracy than people with secondary or lower levels of formal education. However, a majority of  people of all education levels tend to think that Georgia is not a democracy. 

By far, the largest difference in attitudes to this question are between supporters of different parties. Supporters of the ruling party are 38 percentage points more likely than opposition supporters and 41 percentage points more likely than voters with no party preference to consider Georgia a democracy.

GD supporters constitute the only group in the electorate of whom a majority think that Georgia is a democracy, controlling for other factors.

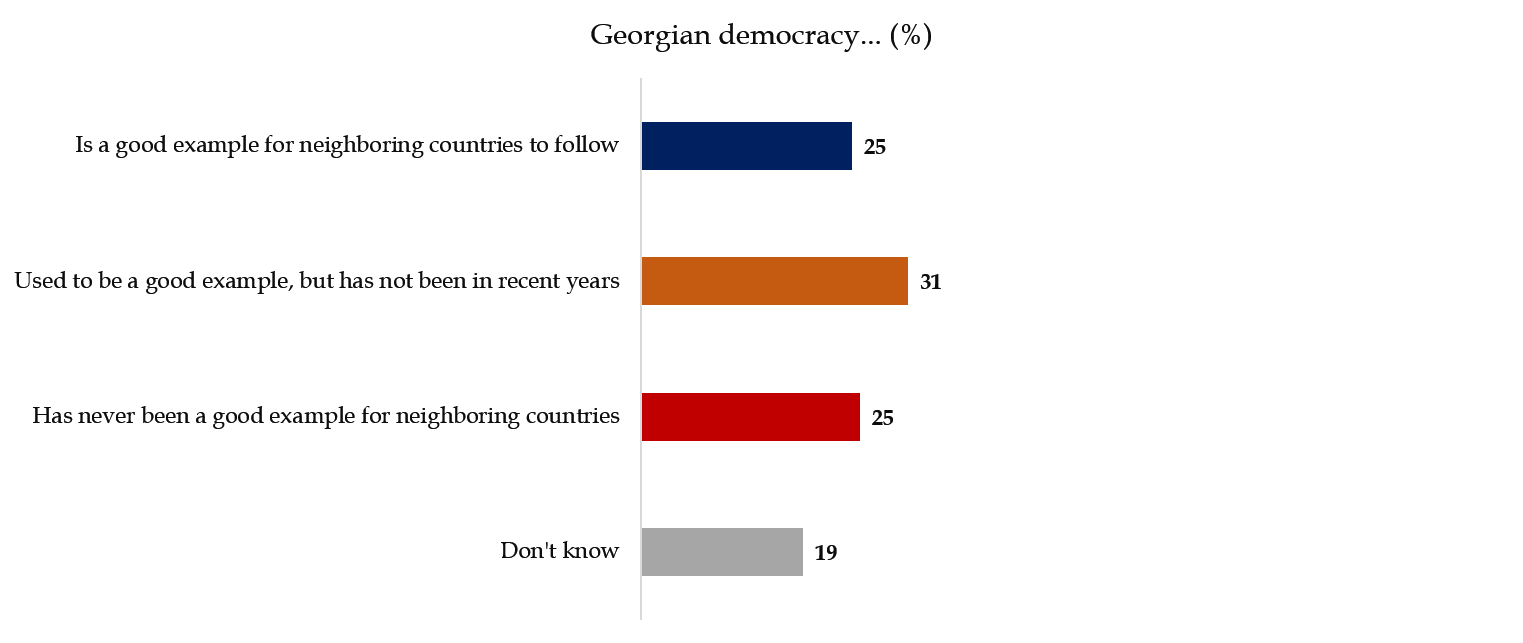
Another question on the NDI and CRRC August 2022 survey leads to similar conclusions. A quarter of the public (25%) think that Georgian democracy is a good example for neighbours, 31% believe that the country used to be a good example but ceased to be one, and another quarter (25%) feel that Georgia has never been an exemplary democracy. The remaining fifth (19%) of the electorate report that they do not know.

Multinomial regression analysis was conducted to better examine group differences. The results yielded were similar to those of the previous analysis. GD supporters hold exceptionally dissimilar and at the same time optimistic views regarding the quality of democracy in Georgia compared to the rest of the population.

Supporters of the ruling party are 35 percentage points more likely than opposition supporters and 32 percentage points more likely than non-affiliated voters to think that Georgian democracy is a good example for neighbours. GD supporters are also 30 percentage points less likely than opposition supporters and 16 percentage points less likely than non-partisans to believe that democracy in Georgia used to be exemplary, but no longer is.

The fact that the share of the public that considers Georgia to be a democracy is at its lowest since 2010 corresponds with the views of Freedom House, The Economist Intelligence Unit, and the Varieties of Democracy index, all of which have commented on Georgia’s democratic backsliding. 

However, GD supporters, in stark contrast to the rest of the public, tend to believe that Georgia is an exemplary democracy even in 2022. 

Note: The above data analysis is based on logistic and multinomial regression models which included the following variables: age group (18-34, 35-54, 55+), sex (male or female), education (completed secondary/lower, technical or incomplete higher education/higher), wealth (an additive index of ownership of 10 different items, a proxy variable), employment status (employed, not employed, other) ethnicity (ethnic Georgian or ethnic minority), and party identification (Georgia Dream, opposition, did not name a particular party).

Tuesday, September 13, 2022

Do Georgians trust TV?

Note: This article first appeared on the Caucasus Data Blog, a joint effort of CRRC Georgia and OC Media. It was written by Kristina Vacharadze, Programs Manager, and Mariam Kobaladze, Senior Researcher at CRRC-Georgia,  The views presented in the article are of the authors alone, and do not necessarily reflect the views of CRRC Georgia, or any related entity.

In an increasingly polarised media environment, Georgians have mixed feelings about how much TV and TV journalists can be trusted. 

Over the past decade, TV as a source of news has been on the decline in Georgia. With just 53% of those surveyed in 2021 using TV as their primary news source, as compared to 88% in 2009, it is clear that TV has lost its dominance. Nonetheless, it remains the main news source for  half of the adult population.

This fall in TV consumption has taken place against a background of an increasingly divided media environment. Media monitoring studies show that, in recent years, there have been clear trends of polarisation amongst television channels, with many strongly supporting either the ruling party or the opposition. 

This has been reflected in qualitative studies by CRRC-Georgia, in which many people have said that they have to watch news on several television channels to be able to draw reasonable conclusions on events that have happened and how they might interpret them. 

In such an environment, what does the Georgian public think of television and TV journalists? 

Can TV be trusted?

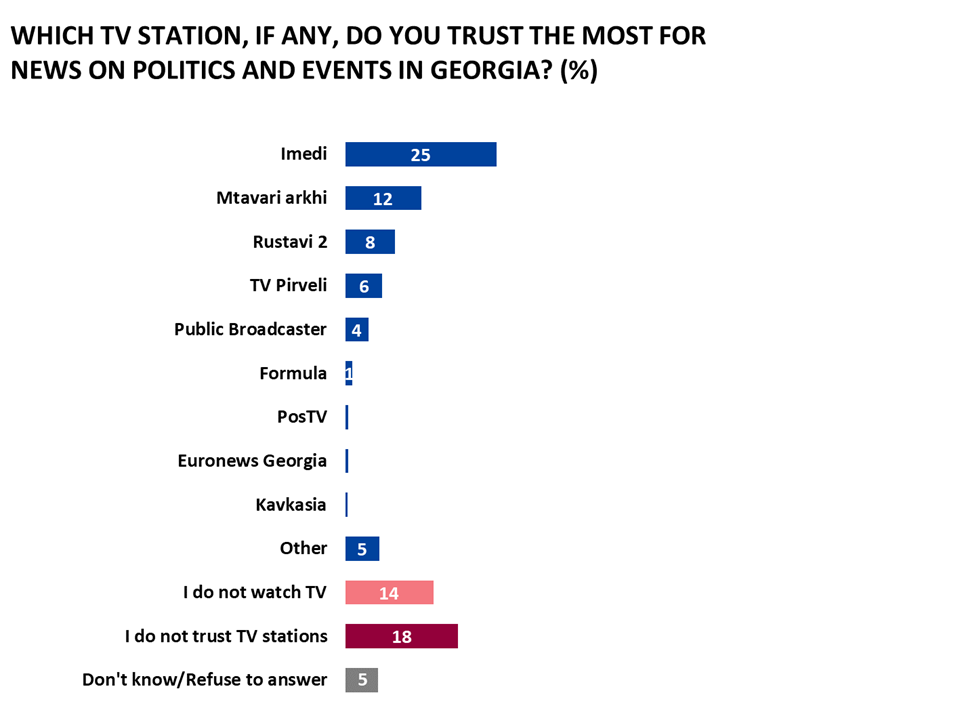
According to the Caucasus Barometer 2021, an annual household survey run by CRRC, 18% of the population does not trust any television channel for news about politics and current events and 14% does not watch television news at all. 

The most trusted television channels for news on politics and current events were found at opposite ends of the political sprectrum - the pro-government Imedi, trusted by a quarter (25%) of the population, and the pro-opposition Mtavari, trusted by 12%. Less than a tenth of the population trusted Rustavi 2 (8%), TV Pirveli (6%), and the Public Broadcaster (4%) more than any other station.

A regression analysis found that trust in TV and TV stations and viewing habits were associated with various demographic characteristics. 

Older people were more likely to watch and trust TV compared to other age groups. 

Ethnic minorities were more likely to distrust TV or not watch it compared to ethnic Georgians. This could be in part related to a lack of Armenian- and Azerbaijani-language programming on Georgian television. 

Working people were more likely to distrust and/or not watch TV news compared to people who did not work. 

People who supported a political party were more likely to watch and trust TV than people who did not support any party, or refused to report a party preference.

There were no patterns associated with settlement type, gender, or education level.

Note: The analysis uses a multinomial regression, where the dependent variable is whether people distrust TV, do not watch any TV channel for news about politics and current events, or trust a specific TV station. The independent variables are gender, age group, ethnicity, settlement type, level of education, and employment status.

What do the public think of TV journalists?

With a third of the population distrusting and/or not watching news on any television channel, what does the Georgian public think of the performance of TV journalists? 

About half of those surveyed (48%) believed that Georgian TV journalists inform the population about ongoing events in Georgia neither poorly nor well, while approximately a fifth of the population either positively or negatively assesses their work.

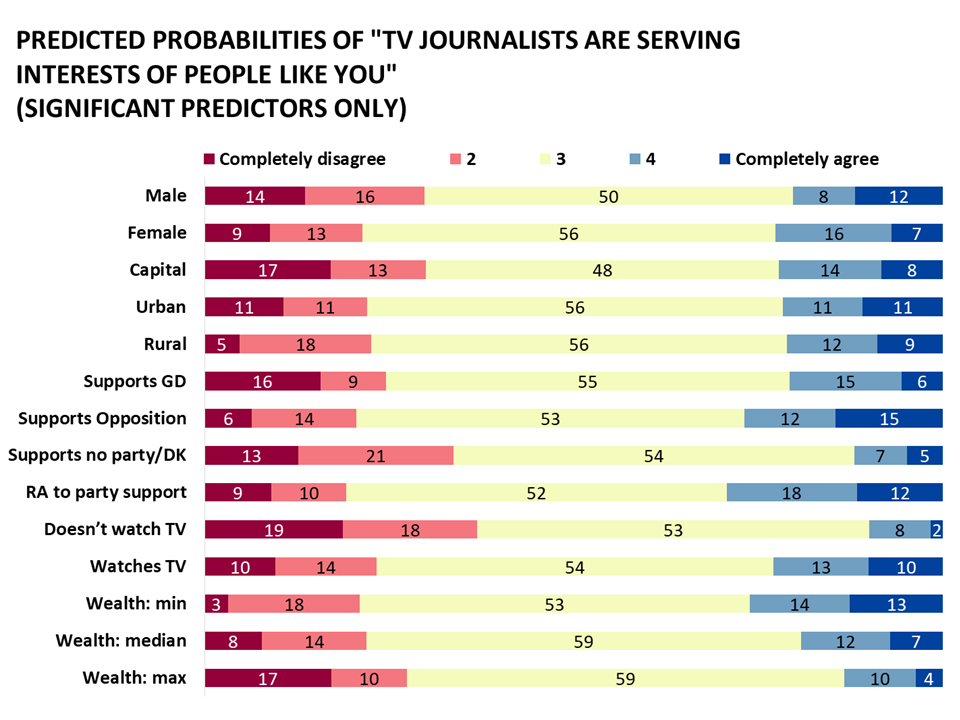
A multinomial regression showed that women were more likely to agree with the idea that TV journalists were serving their interests than men were. On the other hand, people living in urban areas assessed the performance of TV journalists more negatively than those living in rural settlements.

Party allegiance was also a significant predictor of people’s views: respondents who supported an opposition party were more positive towards the performance of journalists than supporters of the ruling party, Georgian Dream. 

Wealth (measured as the number of items a household owns from a list of 14) was also a significant predictor: poor people assessed the performance of journalists more positively than wealthier people.

Unsurprisingly, people who watched TV tended to feel more positively about TV journalists than people who do not watch TV.

A regression analysis did not show significant differences in attitudes between different age groups, ethnicities, people with different education levels, or with and without a job.

Note: The analysis uses a multinomial regression, where the dependent variable is whether people agree or disagree with the statement that TV journalists in Georgia are serving the interests of people like them. The independent variables are gender, age group, ethnicity, settlement type, level of education, wealth, watching TV and employment status.

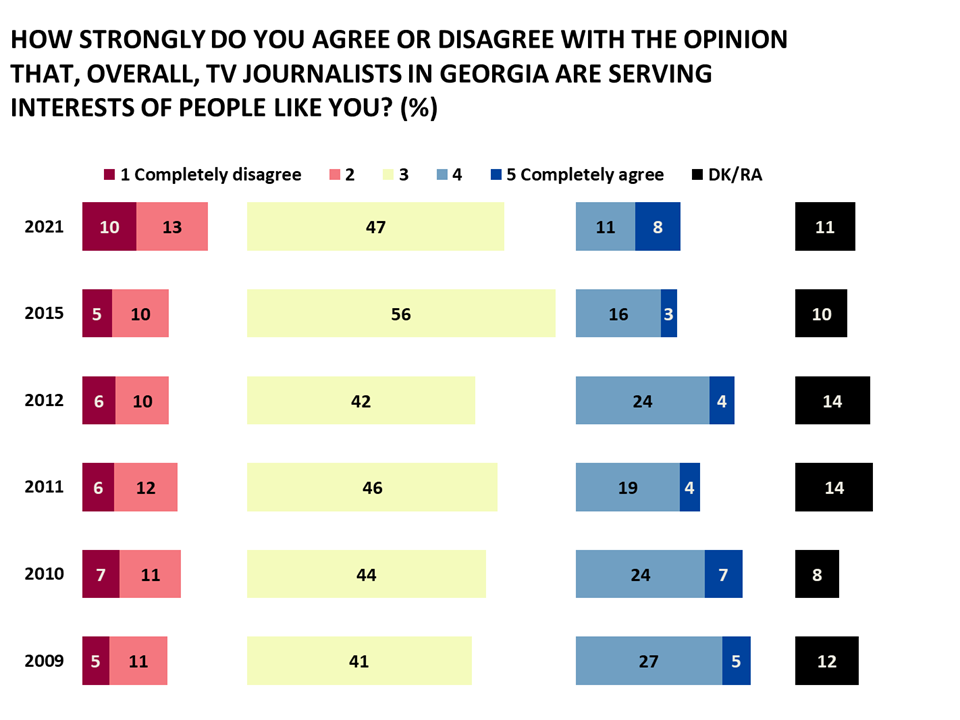
The data shows a similar pattern with regard to views on whether TV journalists in Georgia serve the interests of the people. Slightly less than half of the population in Georgia (47%) neither agree nor disagree, while around a quarter (23%) believed that TV journalists do not serve the interests of the people, and a fifth (19%) believed that they did. Notably, people have become more pessimistic with regards to this question over the last decade, with a seven percentage point increase in disagreement with this sentiment between 2009 and 2021, and a 13 point decline in agreement with the statement during the same period. 

In the context of a very divided media landscape, it is notable that there is low public trust in television news and outlets. This trust appears to have fallen over the past decade, with fewer now believing that TV journalists in Georgia serve their interests. 

The data used in this post is available here.