Note: This article first appeared on the Caucasus Data Blog, a joint effort of CRRC-Georgia and OC Media. It was written by Zachary Fabos, an International Fellow at CRRC-Georgia. The views presented in the article are the author’s alone and do not necessarily represent the views of CRRC-Georgia, Caucasian House, or any related entity.
Public discourse in Georgia has in recent months raised the idea that Georgia’s young people, and particularly Gen Z, are politically interested and active, particularly following the March foreign agent protests. CRRC data suggests that a majority of 18-29-year-old Georgians are politically engaged, although the older age bracket are somewhat more interested.
In the conversation around Georgia’s foreign agent law protests, which took place in March, Gen Z — people born between the late 1990s and early 2000s — have featured heavily. Many of the protests’ most striking moments were attributed to those recently having reached voting age, as was some of their creativity and momentum.
The legislation in question found itself between contesting visions of Georgia’s political future, with protestors suggesting it would ruin Georgia’s hopes of Western integration, and Georgian Dream arguing that the law was necessary for transparency.
But prior to their engagement in the protests, what were Gen Z’s attitudes towards politics and how did they choose to participate? Data from CRRC-Georgia and Caucasian House’s 2021 Survey on Youth Civic and Political Engagement and Participation in Peacebuilding suggests that both Georgia’s Gen Z and millennials are interested in and engaged with the country’s politics, though Millennials are slightly more interested in politics.
For the purpose of this analysis, 18-25 year-olds are considered part of Gen Z, while the survey’s older participants, those aged 26-29, are referred to as millennials despite only covering the youngest of those born between the late 1980s and mid-late 1990s.
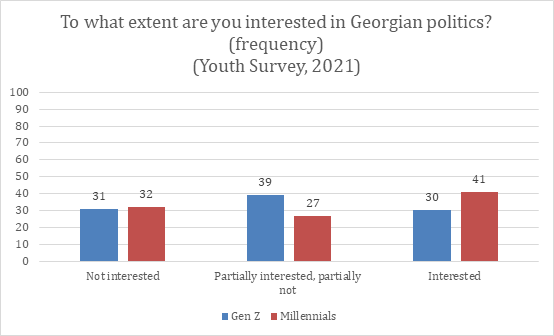
Data from the survey suggests a majority of both age groups are partially interested or interested in the country’s politics. However, more millennials were interested, with 41% reporting interest compared to 30% of Gen Z. By comparison, Gen Z was more likely to indicate partial interest, with 39% claiming to be somewhat interested and somewhat not and 27% of millennials stating the same.
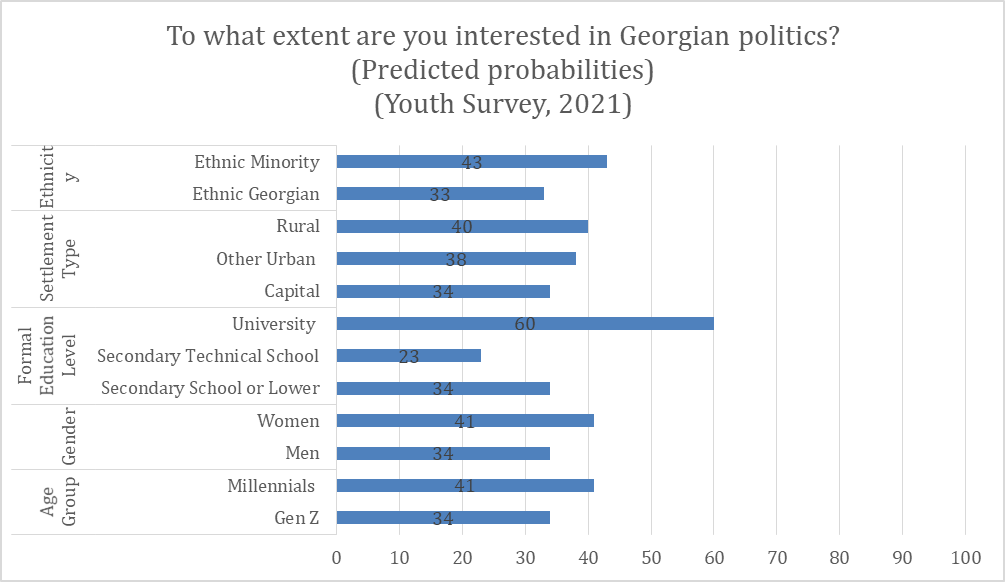
When the data is broken down by social and demographic groups including gender, ethnicity, settlement type, and education level, a number of patterns emerge.
In terms of settlement type, young people in rural areas are six points more likely to be interested in politics than people in Tbilisi. People in urban areas other than Tbilisi are interested at a rate somewhere between the two.
When it comes to gender, women are seven points more likely to be interested in Georgian politics than men.
Finally, people with a higher education are twenty-six and thirty-seven points more likely to report they are interested in politics than people with secondary education or vocational education, respectively.
Note: Interest is coded as expressing at least partial interest.
Aside from general interest, the survey asked young people if they ever engaged in a range of political actions including membership in a political party, donating to a political party, participating in a political campaign, attending a meeting with a party member or candidate, taking part in a protest, or having voted in the 2020 parliamentary elections.
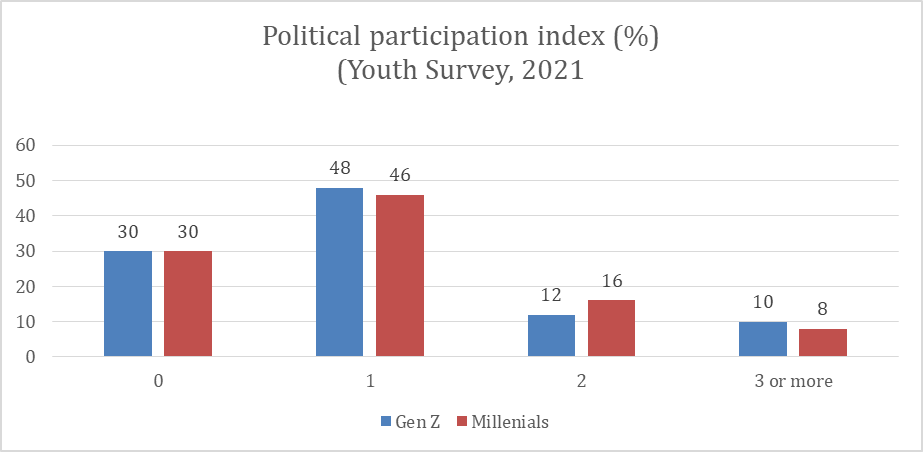
For the purpose of measuring engagement in politics among Gen Z and Millennials, the six activities were grouped together to create a political participation index, with six being all activities and zero being engagement in no activities. Overall, roughly half of respondents reported engaging in one activity, a third no activities, and the remainder two or more.
The survey data suggested that both generations engage in political activities at about the same rate, with a plurality having taken part in at least one action: 48% of Gen Z and 46% of millennials.
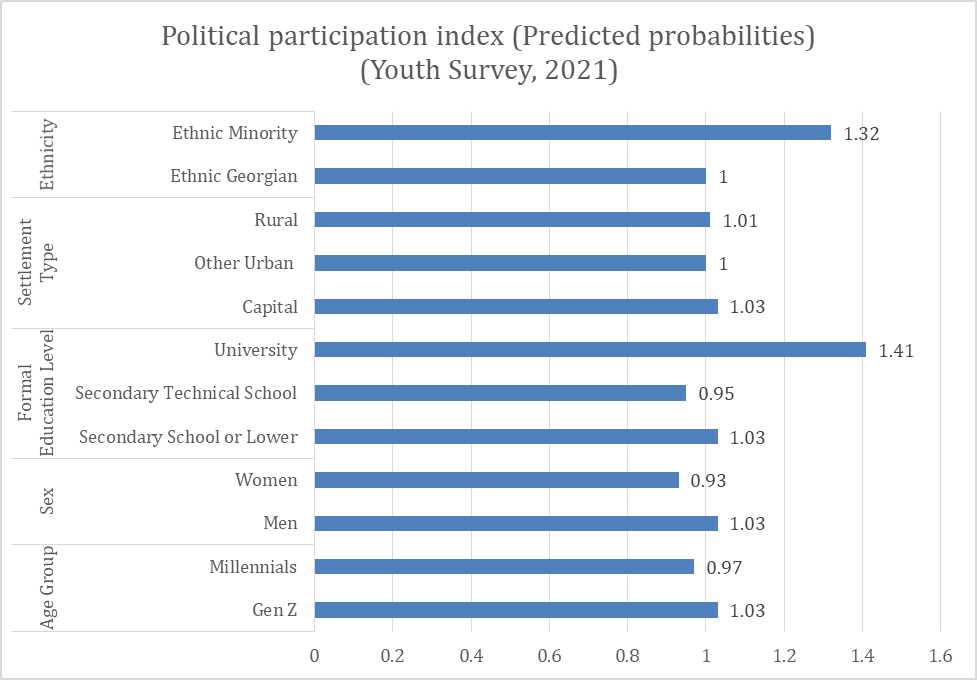
Breaking this down, education and ethnicity were the strongest predictors of how many political activities someone had taken part in.
Young people with a university education on average engaged in approximately one half of one activity more than those with other levels of education, controlling for other factors.
In contrast to perceptions in Georgia that ethnic minorities are politically unengaged, the data showed that ethnic minorities engaged in approximately one third more actions on average, controlling for other factors. While the data does not provide a clear explanation for this pattern, it may stem from the fact that this data focuses on young people, who may be more politically active than older people who are not ethnic Georgians. Alternatively, it could point towards an incorrect perception of ethnic minority political engagement more broadly.
Aside from one’s education level and ethnicity, the model demonstrated that other demographic factors were not associated with the types of civic engagement young people were engaged in.
Note: The chart above was generated from a regression model. The model includes ethnicity (ethnic Georgian, ethnic minority), settlement type (capital, other urban, rural), education (tertiary, secondary technical school, secondary school or lower), gender (female, male) and age group (18-25, 26-29).
The results of the youth survey suggest that among young people, interest in politics is slightly higher among millennials than among Gen Z. Within those groups, participation in political activities is more associated with education and ethnicity than most other factors. However, the data does confirm that Gen Z was interested in politics and as likely as millennials to have engaged in political activity prior to the protests against the foreign agent law in March.
Note: The analysis in this article makes use of logistic regression analysis. The analysis included gender (male, female), age group (18-25, 26-29), settlement type (capital, urban, rural), education (secondary or lower, secondary technical, tertiary), and ethnicity (ethnic Georgian, ethnic minority), as predictor variables. The data used in this article is available here.


No comments:
Post a Comment